

Abstract
Peak profiling and high-performance columns containing immobilized human serum albumin (HSA) were used to study the interaction kinetics of chiral solutes with this protein. This approach was tested using the phenytoin metabolites 5-(3-hydroxyphenyl)-5-phenylhydantoin (m-HPPH) and 5-(4-hydroxyphenyl)-5-phenylhydantoin (p-HPPH) as model analytes. HSA columns provided some resolution of the enantiomers for each phenytoin metabolite, which made it possible to simultaneously conduct kinetic studies on each chiral form. The dissociation rate constants for these interactions were determined by using both the single flow rate and multiple flow rate peak profiling methods. Corrections for non-specific interactions with the support were also considered. The final estimates obtained at pH 7.4 and 37°C for the dissociation rate constants of these interactions were 8.2–9.6 s−1 for the two enantiomers of m-HPPH and 3.2–4.1 s−1 for the enantiomers of p-HPPH. These rate constants agreed with previous values that have been reported for other drugs and solutes that have similar affinities and binding regions on HSA. The approach used in this report was not limited to phenytoin metabolites or HSA but could be applied to a variety of other chiral solutes and proteins. This method could also be adopted for use in the rapid screening of drug-protein interactions.
Keywords: High-performance affinity chromatography, Peak profiling, Human serum albumin, Phenytoin metabolites, Kinetic studies
1. Introduction
Phenytoin is a drug that is commonly used to treat epilepsy. About 90% of this drug is bound to serum proteins in the circulation, with most of this binding taking place with human serum albumin (HSA) [1,2]. HSA is a major transport protein in blood and is involved in carrying various drugs, hormones and other solutes throughout the body [3–8]. This protein has a typical serum concentration of 50 g/L and a mass of 66.5 kDa [3]. Studying the interactions between HSA and drugs and their metabolites is known to be important in characterizing the pharmacological and pharmacokinetic properties of drugs in the body [4–10].
There are two primary metabolites of phenytoin: 5-(3-hydroxyphenyl)-5-phenylhydantoin (i.e., m-HPPH) and 5-(4-hydroxyphenyl)-5-phenylhydantoin (i.e., p-HPPH) (see Figure 1) [11]. About 60–80% of phenytoin is converted into these forms [12,13]. m-HPPH and p-HPPH each bind to HSA at a single major site (i.e., Sudlow site II), with association equilibrium constants of 3.2 × 10³ and 5.7 × 10³ M−1, respectively, at pH 7.4 and 37°C [14]. However, there is little information on the kinetics of these interactions. This type of information would help scientists to better understand the effects of these metabolites on the distribution and observed activity for phenytoin in the human body [7,8,14].
Figure 1.
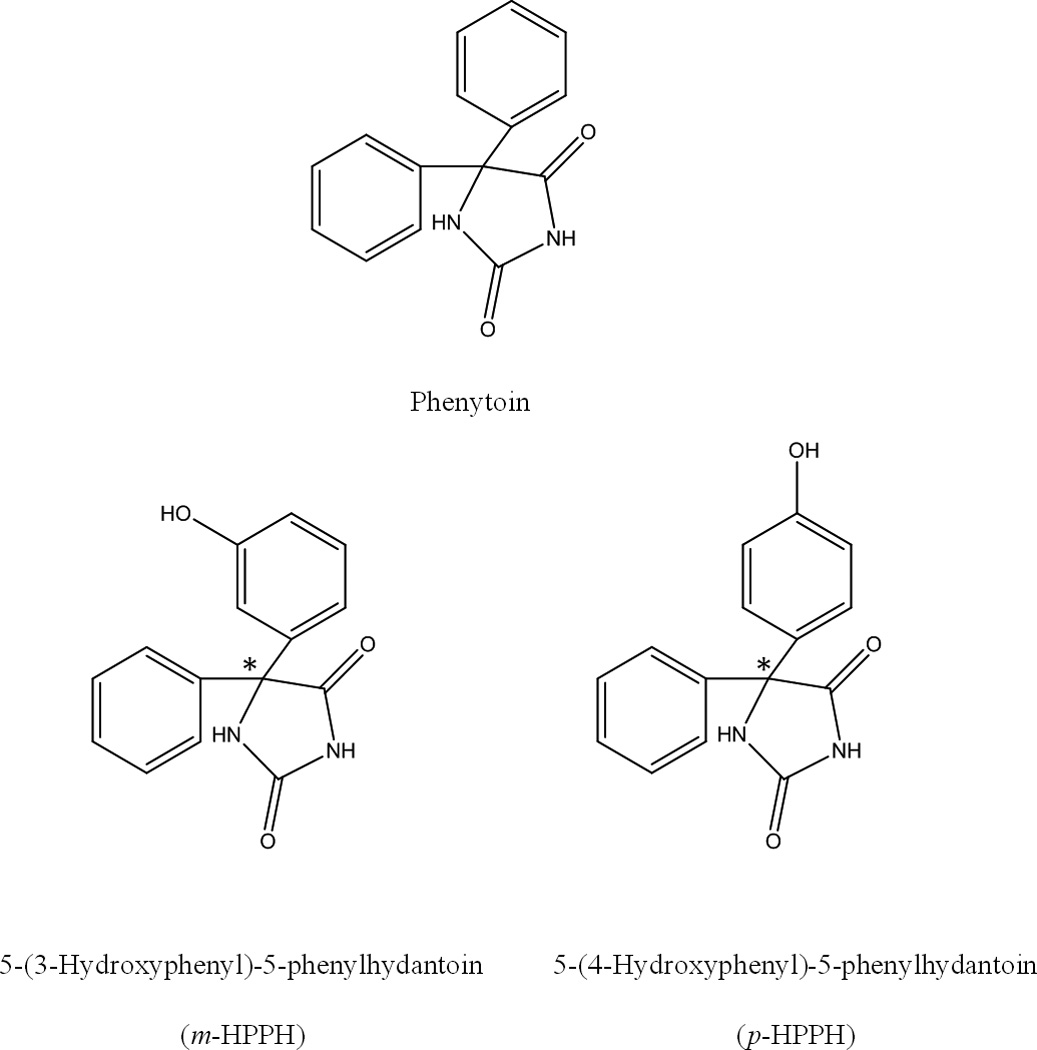
Structures of phenytoin and its major metabolites, 5-(3-hydroxyphenyl)-5-phenylhydantoin (i.e., m-HPPH) and 5-(4-hydroxyphenyl)-5-phenyl-hydantoin (i.e., p-HPPH). The asterisk shows the location of the chiral center in m-HPPH or p-HPPH.
Numerous methods have been employed to study the kinetics of drug-protein interactions. Examples include surface plasmon resonance, stopped flow techniques, and filtration assays [15–18]. Another technique that has been used for kinetic studies of drug-protein interactions is high-performance affinity chromatography (HPAC) [7,16,19–22]. This method makes use of an HPLC column that contains an immobilized protein such as HSA, which can then be utilized with a variety of approaches to examine the extent or rate of drug-protein binding and dissociation (see reviews in Refs. [7,8,16,20]). The use of immobilized HSA columns in HPAC for these studies has been found to give good agreement with reference methods that have used soluble HSA [7,8,20]. HPAC has also been found to have the added advantages of good speed, high precision and ease of automation, as well as the ability to work with various detection methods and to reuse the same protein preparation for hundreds of experiments [7,8,20]. In addition, it is known that HPAC columns containing HSA can be used in chiral separations for a variety of drugs and small solutes [23,24].
The goal of this study is to combine HPAC with the peak profiling method to conduct kinetics studies on the interactions between HSA and chiral solutes or drug metabolites such as m-HPPH and p-HPPH. The peak profiling method is carried out by injecting both the analyte and a non-retained species onto an HPAC column at one or more flow rates [7,19–22]. The dissociation rate constant for the analyte with the stationary phase is then obtained by using the measured retention times and variances of the peaks for the analyte and non-retained solute. This method has been used to study the interactions of HSA with L-tryptophan and carbamazepine, among other solutes, and has been found to give good agreement with literature values [19–22]. In this study, the stereoselective interactions of m-HPPH and p-HPPH with HSA will be examined by using both the single flow rate and multiple flow rate peak profiling methods [19,21,22]. This work will not only provide information on the rates of the interactions for HSA with these drug metabolites but will illustrate how peak profiling can be used to examine the kinetics of protein interactions that involve chiral solutes.
2. Theory
The binding of a drug or a small solute (A) with an immobilized protein (P) such as HAS is often described by the reversible reaction that is shown in Eq. (1) [21,25].
| (1) |
| (2) |
In this reaction, Ka is the association equilibrium constant for the binding of A to P. The terms ka and kd are the second-order association and first-order dissociation rate constants for this interaction.
The peak profiling method can be used to examine the kinetics of such a reaction by injecting a small plug of analyte A and a non-retained species onto a column that contains an immobilized protein or binding agent P. The first and second statistical moments of the peaks for the analyte and non-retained solute are then determined and compared. The peak profiling method was originally used with Eq. (3) and data measured at a single flow rate to calculate the apparent dissociation rate constant for a solute-protein interaction [19,21,26].
| (3) |
The term tR in this equation is the retention time for the analyte, and tM is the elution time for the non-retained solute (i.e., the void time). The peak variances, or second statistical moments, for the analyte and non-retained species are given by σ2R and σ2M.
A key assumption made in Eq. (3) is that all sources of band-broadening other than stationary phase mass transfer are negligible or approximately the same for the analyte and non-retained species [21]. One approach that can be used to avoid or overcome deviations from this assumption is to use multiple flow rates for the peak profiling measurements. This approach is represented by Eq. (4) [21,22].
| (4) |
The terms HR and HM in Eq. (4) are the total plate heights for the analyte and the non-retained species on a column that contains the immobilized binding agent P. The term k is the retention factor for the analyte and u is the linear velocity of the mobile phase. The difference between HR and HM in Eq. (4) is equal to the plate height contribution due to stationary phase mass transfer (Hk) for the interactions of A with P. According to this equation, the value of kd for this interaction can be determined by preparing a plot of (HR −HM) vs. (uk)/(1+k)2, which should result in a linear relationship with a slope that is inversely related to kd [21,22].
In some cases more than one type of binding site for an analyte may be present in a column. For instance, there may be non-specific binding between A and the support as well as interactions of A with P. It is necessary in these situations to expand Eq. (4) to include a multisite model, as illustrated in Eq. (5) for a system with two distinct and independent types of interactions [22] (Note: Similar relationships can be derived for other systems [22,27]).
| (5) |
In these relationships, the difference between HR and HM is now equal to the sum of two separate plate height contributions due to stationary phase mass transfer, as represented by Hk,1 and Hk,2. These two plate height terms can be described by two distinct dissociation rate constants, kd,1 and kd,2, and separate retention factors for A due to the two groups of sites, k1 or k2. It is also possible to simplify this relationship by using the overall retention factor for the analyte on test column (k) and fraction of this retention factor that is due to each of the two groups of sites, as given by α1 and α2. When a plot of (HR − HM) vs. (uk)/(1+k)2 is made for a two-site system, the expressions in Eq. (5) predict that this plot should again follow a linear relationship. However, the slope of this plot will now be a function of the dissociation rate constants and retention for the analyte at both types of sites in the column. If independent information can be obtained for some of these terms (e.g., the extent of non-specific binding to the support and the rate of this binding), it is possible to use the slope of Eq. (5) to also estimate the dissociation rate constant for the interaction of A with P [22].
3. Experimental
3.1. Reagents
The racemic samples of m-HPPH (>98% pure) or p-HPPH (>98%) and the HSA (99%, essentially fatty acid free) were from Sigma (St. Louis, MO). Nucleosil Si-300 (7 µm particle size, 300 Å pore size) was obtained from Macherey-Nagel (Duren, Germany). Reagents for the bicinchoninic acid (BCA) protein assay were purchased from Pierce (Rockford, IL). Other chemicals were reagent-grade or better. All aqueous solutions were prepared using water from a Nanopure system (Barnstead, Dubuque, IA) and were filtered using Osmonics 0.22 µm nylon filters from Fisher (Pittsburgh, PA).
3.2. Apparatus
The chromatographic system consisted of a Hitachi L-6000 pump (Pleasanton, CA), a ThermoSeparations AS3000 autosampler (Riviera Beach, FL), and a Waters 481 UV detector (Milford, MA). The columns were maintained at 37°C with a water jacket and circulating water bath from Fisher Scientific (Pittsburgh, PA). Chromatographic data were collected using an in-house program written in Labview (National Instruments, Austin, TX). The chromatograms were analyzed using Peakfit 4.12 (Jandel Scientific Software, San Rafael, CA). All columns were downward slurry-packed with an HPLC column slurry packer from Alltech (Deerfield, IL).
3.3. Column preparation
The immobilized HSA silica support was prepared as described previously [21,22,28]. Nucleosil Si-300 was first converted into diol-bonded silica; this support contained 235 (± 20) µmol diol groups per gram of silica, as determined by an iodometric capillary electrophoresis assay [29]. HSA was immobilized onto this diol-bonded silica by the Schiff base method [30]. A control support was prepared by using the same batch of diol-bonded silica and procedure except with no HSA being added during the immobilization step. The protein content of the final HSA support was 43 (± 3) mg HSA per gram of silica, as determined in triplicate by using a BCA protein assay with HSA as the standard and the control support as the blank.
The HSA support and control support were downward slurry-packed at 4000 psi (27 MPa) into separate 10 cm × 4.6 mm i.d. stainless steel columns using pH 7.4, 0.067 M potassium phosphate buffer as the packing solution. Both columns were stored at 4°C and in pH 7.4, 0.067 M potassium phosphate buffer when not in use. All the experiments were performed within 4 months of column preparation, and less than 300 injections were made on each column over the course of these studies. No significant changes in analyte retention or column binding properties were noted under these conditions.
3.4. Chromatographic experiments
The experiments in this study were performed at 37°C and using pH 7.4, 0.067 M potassium phosphate buffer as the mobile phase to mimic physiological conditions. All aqueous samples containing m-HPPH, p-HPPH or sodium nitrate (i.e., a non-retained solute) were prepared in this mobile phase. A sample concentration of 25 µM was used for all injected solutes in this study, which has been shown in previous work with other drugs and similar HAS columns to be appropriate for the peak profiling method [21,22]. Wavelengths of 203 nm and 205 nm were used to monitor the elution of the phenytoin metabolites and sodium nitrate, respectively.
Injections of racemic m-HPPH or p-HPPH and sodium nitrate were made on the HAS column and control column in triplicate and at flow rates ranging from 0.1 to 2.0 ml/min (Note: The separate enantiomers of m-HPPH and p-HPPH were not available for this work). Samples of these solutes were also injected onto a zero volume spacer/union to correct for any apparent elution times or band-broadening due to extra-column components. The first and second moments of the chromatographic peaks were determined using PeakFit. This moment analysis was performed using an exponentially-modified Gaussian fit (EMG) with a linear progressive baseline and the residual option of PeakFit, along with the fact that the enantiomer peaks in a given set had similar areas and shapes. The statistical moments measured for peaks that eluted from the HSA and control column were then used to estimate the dissociation rate constants for the analytes from the HSA column, as described in Section 2.
4. Results and Discussion
4.1. Peak profiling using the single flow rate method
It is known from previous studies that high flow rates are desirable for the single flow rate method of peak profiling [19,21,22]. These conditions help to provide a large difference between the total plate heights that are measured for the retained analyte and non-retained solute, which makes it easier to determine the plate height contribution due to stationary phase mass transfer (Hk) and the related value of kd. However, one practical limitation encountered in this current study at high flow rates was the fact that both phenytoin metabolites were made up of a racemic mixture of enantiomers that had slightly different binding to HSA. In previous work with HPAC and the plate height method for kinetic studies, the use of purified enantiomers has been used to examine the interaction kinetics of D- or L-tryptophan [31] and R- or S-warfarin with HSA [32]. However, samples of the separate enantiomers for m-HPPH and p-HPPH were not available for this current study. Instead, an alternative method based on peak deconvolution was used to simultaneously study the dissociation kinetics of the enantiomers for m-HPPH and p-HPPH on an HSA column.
As illustrated by the chromatograms for m-HPPH in Figure 2, the presence of these chiral forms required the use of low-to-moderate flow rates to provide at least partial resolution of the corresponding peaks for the measurement of retention times and peak variances. The resolution of the two m-HPPH enantiomers was about 0.75 at 0.1 ml/min and decreased at higher flow rates, giving a resolution of 0.59 at 0.5 ml/min, 0.54 at 1.0 ml/min, and 0.43 at 2.0 ml/min. Similar trends but at a lower resolution (i.e., down to 0.37) were seen for the enantiomers of p-HPPH, with only a single peak being observed for this drug metabolite at flow rates above 0.75 ml/min. To deal with this situation in the peak profiling studies, each set of partially-resolved peaks first underwent deconvolution to give the profiles for the two individual, overlapping peaks. This was done at all flow rates for m-HPPH and at flow rates below 0.75 ml/min for p-HPPH; for the latter compound, data for only the single combined peaks were available at higher flow rates and linear velocities. The first and second statistical moments for these peaks were then determined and used with Eq. (3) in the single flow rate peak profiling method [19,21,26].
Figure 2.
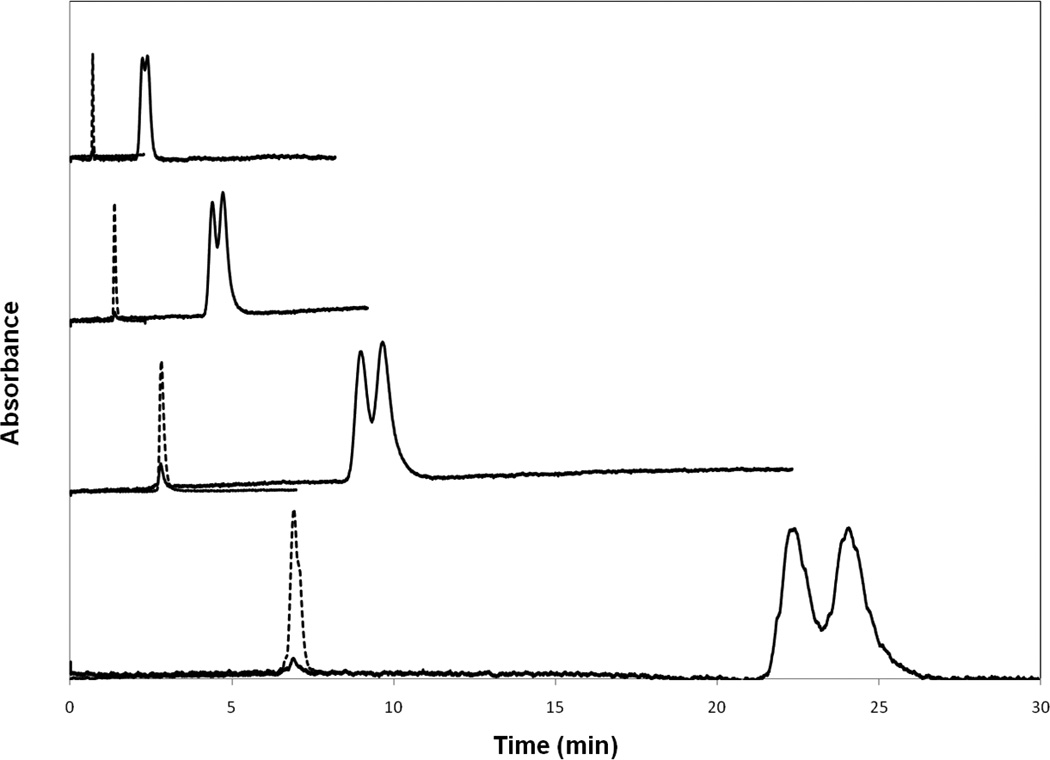
Chromatograms for m-HPPH (solid lines) and sodium nitrate (dashed lines) on an HSA column at flow rates (bottom-to-top) of 0.25, 0.5, 1.0, and 2.0 ml/min. Other conditions are given in the text.
Figure 3 shows the data that were obtained for the first eluting enantiomer of p-HPPH after using peak deconvolution and the single flow rate method of peak profiling. As indicated in Figure 3(a), the value of HR that was obtained for p-HHPH was similar to the value of HM for sodium nitrate at low linear velocities and flow rates (i.e., values up to around 0.5 ml/min). The size of HR became much greater than HM as the linear velocity was increased to larger values, as is required in the single flow rate method [19,21]. However, it was only at low-to-moderate flow rates that information on the individual enantiomers could be obtained for this particular analyte.
Figure 3.
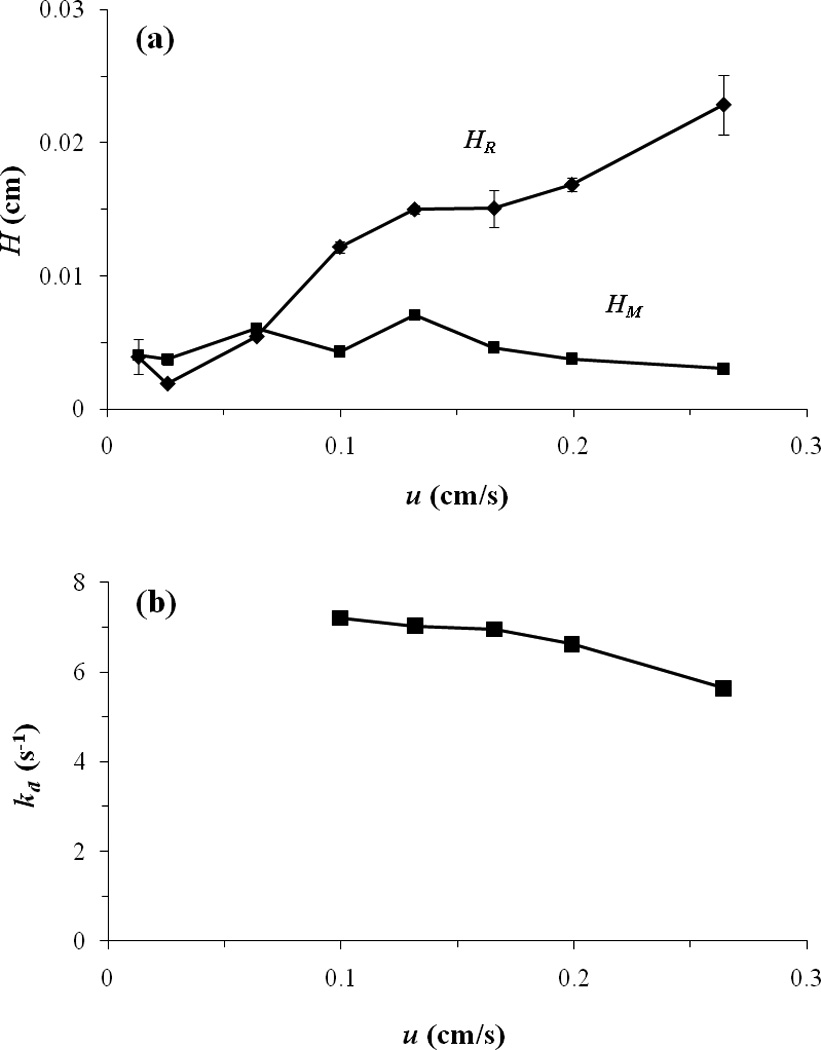
Peak profiling results obtained at individual flow rates for the first eluting enantiomer of p-HPPH on an HSA column. These graphs show (a) the total plate heights for p-HPPH (HR) and sodium nitrate (HM) as a function of linear velocity (u), and (b) the apparent value of kd that was obtained for p-HPPH at various linear velocities when using Eq. (3) and the single flow rate method. The error bars represent a range of ±1 S.D. for triplicate injections (Note: The error bars are often similar in size to the symbols for the data points).
As shown in Figure 3(b), the apparent dissociation rate constant that was measured by the single flow rate method for the combined enantiomers of p-HPPH (i.e., as obtained at flow rates above 0.75 ml/min) did change to a small extent with the flow rate. In this specific case, the value of kd decreased by 8% between flow rates of 0.75 and 1.5 ml/min (i.e., linear velocities of 0.10 to 0.2 cm/s) and decreased by 22% between 0.75 and 2.0 ml/min (linear velocities of 0.1 to 0.26 cm/s). A similar trend was seen for the separate enantiomers of m-HPPH. The estimates for kd that were obtained at the highest tested flow rate (2 ml/min) were 12.3 (± 0.8) s−1 and 12.0 (± 0.2) s−1 for the two enantiomers of m-HPPH and an average of 5.6 (± 0.7) s−1 for the combined enantiomers of p-HPPH. Work in the next section examined the use of multiple flow rates to obtain more accurate estimates of the dissociation rate constants for these interactions.
4.2. Peak profiling using the multiple flow rate method
The multiple flow rate method [21,22] was next used with the same samples and columns as employed in the single flow rate method. Figure 4 shows some typical results that were obtained for p-HPPH and m-HPPH. These results now made use of peak profiling data that were also obtained at low-to-moderate flow rates, allowing retention factors and plate heights to be determined for the separate enantiomers of these drug metabolites. When plots of (HR−HM) vs. (uk)/(1+k)2 were prepared for the separate enantiomers of p-HPPH and m-HPPH, linear fits were observed with correlation coefficients of 0.966–0.974 (n = 8). The dissociation rate constants for the interactions between these solutes and HSA were then obtained from the slopes of these plots.
Figure 4.
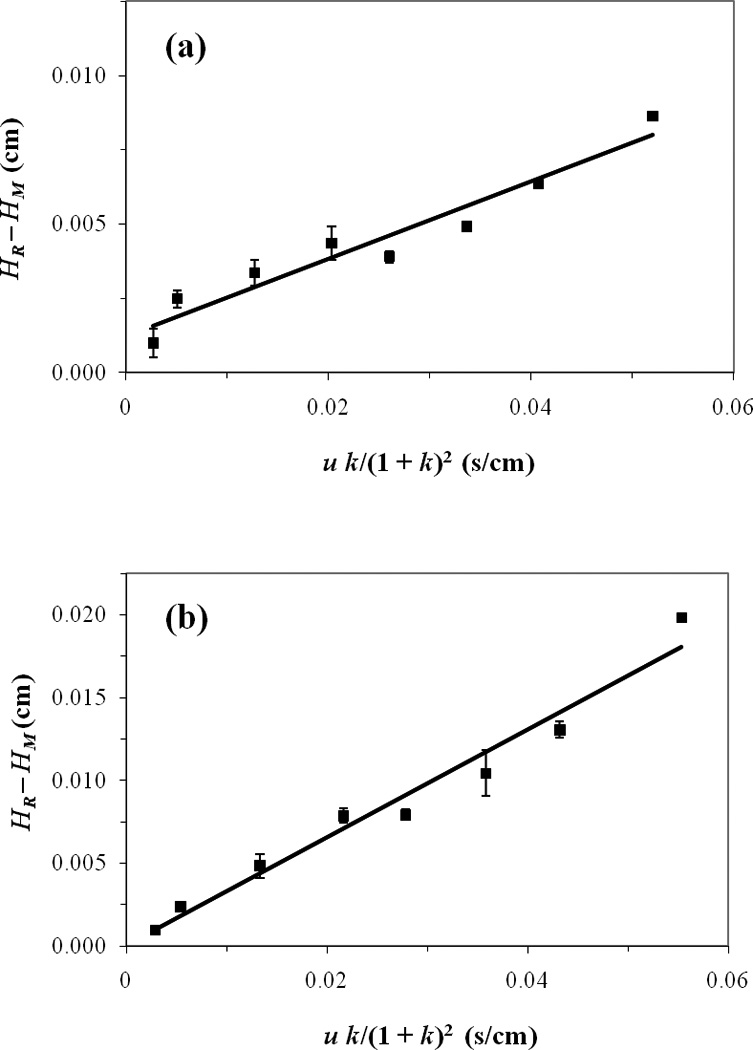
Plots prepared according to Eqs. (4) or (5) in peak profiling studies for the second eluting enantiomers of (a) m-HPPH and (b) p-HPPH on an HSA column. The correlation coefficients for the best-fit lines were 0.966 and 0.974, respectively. The error bars represent a range of ±1 S.D. for triplicate injections (Note: The error bars are often on the same size scale as the data point symbols in these plots).
Good agreement was seen between the experimental data and best-fit lines in these plots for each enantiomer and over the entire range of flow rates that were examined. If the enantiomer peaks had not been properly deconvoluted during this analysis, this would have been reflected by variations in the apparent widths of the separate peaks and the resulting values of HR and (HR−HM). This, in turn, should have lead to deviations from linear behavior (e.g., at high flow rates where lower peak resolution was present and deconvolution became more difficult to perform). Thus, the agreement between the data and best-fit lines indicated that the deconvolution of the enantiomer peaks was providing consistent peak shapes, plate heights and kinetic results under the conditions that were employed in this study.
Table 1 summarizes the dissociation rate constants that were obtained for the separate enantiomers of p-HPPH and m-HPPH by using the multiple flow rate method and a single-site binding model, as represented by Eq. (4). The apparent dissociation rate constants that were measured under these conditions were 14.1 (± 1.3) s−1 or 15.3 (± 1.7) s−1 for the enantiomers of m-HPPH and 4.9 (± 0.4) s−1 or 6.2 (± 0.5) s−1 for the enantiomers of p-HPPH. However, it was further observed with the control column that some non-specific binding was taking place between each of the phenytoin metabolites and the support. Such interactions can be fast and tend to elevate the net observed dissociation rates for solutes on HSA columns [22]. The next phase of this work used a modified version of the multiple flow rate method to correct for these secondary interactions.
Table 1.
Dissociation rate constants determined by various methods for phenytoin metabolites with HSA at 37 °C and pH 7.4
| Dissociation rate constant, kd (s−1)a | ||||
|---|---|---|---|---|
| Data analysis method | m-HPPH | p-HPPH | ||
| Enantiomer 1 | Enantiomer 2 | Enantiomer 1 | Enantiomer 2 | |
| Single flow rate method | ||||
| Single-site model | 12.3 (± 0.8) | 12.0 (± 0.2) | 5.6 (± 0.7) | 5.6 (± 0.7) |
| Multiple flow rate method | ||||
| Single-site model | 14.1 (± 1.3) | 15.3 (± 1.7) | 4.9 (± 0.4) | 6.2 (± 0.5) |
| Two-site modelb | 8.2 (± 0.9) | 9.6 (± 1.2) | 3.2 (± 0.3) | 4.1 (± 0.3) |
The values in parentheses represent a range of ± 1 S.D., as determined by error propagation and the best-fit results according to Eq. (3) for the single flow rate method and Eqs. (4) or (5) for the multiple flow rate method. The numbering system used in the labels for the enantiomers refers to their elution order and relative binding strength with HSA.
The values obtained with the two-site model have been corrected for non-specific interactions with the support, as described in the text, and represent dissociation of each phenytoin metabolite only from HSA.
4.3. Correction for multi-site interactions
According to Eqs. (4) and (5), both single-site and multi-site interaction models predict that a linear relationship will be obtained for plots like those given in Figure 4. Because some non-specific binding was present in this study between the tested solutes and the support, it was necessary to consider the contribution made by these secondary interactions on the apparent kd values that were being measured for the phenytoin metabolites with HSA. The total retention factors found for the p-HPPH enantiomers on the HSA column were 2.1 (± 0.1) and 2.4 (± 0.1), which reflected the binding of these solutes with both the immobilized HSA and the support. The total retention factors for the m-HPPH enantiomers on the same HSA column were 2.3 (± 0.1) and 2.5 (± 0.1). The retention factors due to achiral and non-specific binding to the support, as obtained by injecting each phenytoin metabolite onto the control column, were 0.95 (± 0.01) for p-HPPH and 1.2 (± 0.1) for m-HPPH.
When HSA is immobilized it will block some of the non-specific sites on a support. This process makes the amount of non-specific sites on the support in an HSA column less than what it would be in the absence of the immobilized protein [22]. Based on the measured protein content of the HSA support and the known cross-sectional area for HSA (i.e., 5600 Å per molecule) [22], the fraction of the support’s surface area that was occupied by proteins in the HSA column was estimated to be 0.22. This meant the amount of non-specific binding in the HSA column was 78%, or 100·(1-0.22)%, of the level found in the control column. The retention factor due to solute-protein interactions in the HSA column was then found by subtracting the estimated retention factor due to non-specific binding for this column from the total measured retention factor for each analyte. The resulting retention factors due to the solute-protein interactions made up 65 (± 3)% or 67 (± 3)% of the total retention factors for the first and second eluting enantiomers of p-HPPH on the HSA column and 59 (± 3)% or 63 (± 3)% for the first and second eluting enantiomers of m-HPPH.
Band-broadening and kinetic studies based on Eq. (3) on methods in Ref. [22] were also used with p-HPPH and m-HPPH on the control column to estimate the dissociation rate constants for these solutes from their non-specific sites on the support. These experiments gave kd values for the non-specific interactions of at least 15–21 s−1 for m-HPPH and p-HPPH, representing relatively fast dissociation of these solutes from the support. It was possible by using these values and the retention factors determined for each phenytoin metabolite on the HSA column and control column to estimate the relative contribution of non-specific interactions to Eq. (5). It was found that non-specific interactions contributed 8–21% or less to the combined kinetic terms in this equation (i.e., a value less than or similar to the precision of the estimated rate constants). Thus, it was possible to treat the term due to non-specific interactions in Eq. (5) as being negligible compared to the term for the solute-protein interactions, as noted previously for other drugs and solutes on similar HSA columns and supports [22].
It was still necessary, however, to make a correction for the contribution that the non-specific interactions made to the overall retention for each analyte on the HSA column. This retention had to be considered because it affected the value of á within each term in Eq. (5). When an adjustment was made for the non-specific retention of each analyte to the support [22], the final corrected dissociation rate constants for the p-HPPH enantiomers were 3.2 (± 0.3) s−1 and 4.1 (± 0.3) s−1. The dissociation rate constants between m-HPPH enantiomers and HSA, after being corrected by the same method, were 8.2 (± 0.9) s−1 and 9.6 (± 1.2) s−1.
4.4. Related kinetic values and comparison with other systems
It was possible to use the previously-measured association equilibrium constants for m-HPPH and p-HPPH with HSA [14] and the dissociation rate constants that were determined in this study to also calculate the association rate constants for these interactions. The association equilibrium constants that were used in this case were adjusted from the average values listed in Ref. [14] to reflect the small differences in retention that were measured in this current study for the enantiomers of m-HPPH and p-HPPH. When this was adjustment was made, Ka values of 3.0 (± 1.1) × 103 M−1 and 3.4 (± 1.3) × 103 M−1 at pH 7.4 and 37°C were calculated for the first and second eluting enantiomers of m-HPPH (i.e., a difference of only 13% in Ka between the enantiomers). The revised Ka values for the first and second eluting enantiomers of p-HPPH were 5.1 (± 0.7) × 103 M−1 and 6.3 (± 0.9) × 103 M−1 (i.e., a 24% difference in Ka between the enantiomers).
These revised equilibrium constants were then used with Eq. (2) and the measured dissociation rate constants to estimate the association rate constant for each solute with HSA. The results are summarized in Table 2. The association rate constants (ka) for the p-HPPH enantiomers during their interactions with HSA were determined by this approach to be 1.6 (± 0.7) × 104 M−1 s−1 and 2.6 (± 0.4) × 104 M−1 s−1 at pH 7.4 and 37°C. The association rate constants for the two m-HPPH enantiomers were found to be 2.5 (± 1.0) × 104 M−1 s−1 and 3.2 (± 1.3) × 104 M−1 s−1.
Table 2.
Estimated equilibrium constants and rate constants for phenytoin metabolites with HSA at 37 °C and pH 7.4a
| Phenytoin metabolite | Ka (M−1)b | kd (s−1) | ka (M−1 s−1)c |
|---|---|---|---|
| m-HPPH | |||
| Enantiomer 1 | 3.0 (± 1.1) × 103 | 8.2 (± 0.9) | 2.5 (± 1.0) × 104 |
| Enantiomer 2 | 3.4 (± 1.3) × 103 | 9.6 (± 1.2) | 3.2 (± 1.3) × 104 |
| p-HPPH | |||
| Enantiomer 1 | 5.1 (± 0.7) × 103 | 3.2 (± 1.3) | 1.6 (± 0.7) × 104 |
| Enantiomer 2 | 6.3 (± 0.9) × 103 | 4.1 (± 0.3) | 2.6 (± 0.4) × 104 |
Symbols: Ka, association equilibrium constant; ka, second-order association rate constant; kd, first-order dissociation rate constant. The values in parentheses represent a range of ± 1 S.D. The numbering system used in the labels for the enantiomers refers to their elution order and relative binding strength with HSA.
The association equilibrium constants for each isomer were determined by using the average Ka values from Ref. [14] and the retention factors measured in this study for each isomer on the HSA column, after correcting for non-specific binding to the support.
The value of ka was calculated by using the measured values of Ka and kd along with Eq. (2).
Although there are no known previous studies that have examined the interaction kinetics of phenytoin metabolites with HSA, information for similar systems is available in the literature. For instance, L-tryptophan and carbamazepine also bind to Sudlow site II on HSA and have association equilibrium constants of Ka = 103 to 104 M−1 that are comparable in size to those for m-HPPH and p-HPPH [19,21,22]. The reported rate constants for these other systems are also similar to the range of values that were seen in this report for the phenytoin metabolites. For instance, L-tryptophan has a Ka value of 1.1 × 10⁴ M−1 at pH 7.4 and 37° C and has a kd for HSA that has been estimated to be in range of 3–6 s−1 [3,7,8,19–22]. Carbamazepine has a Ka of 5.3 × 10³ M−1 at pH 7.4 and 37° C with HSA and a kd of 1.7 s−1 [22,33].
5. Conclusion
This report used HPAC and the peak profiling method to measure the dissociation rates constants for the chiral drug metabolites m-HPPH or p-HPPH during their interactions with HSA. Both the single flow rate and multiple flow rate methods for peak profiling were utilized in this study. Of these two approaches, the multiple flow rates had the advantage of allowing data from low-to-moderate flow rates to be used in the analysis. These conditions were desirable because they allowed for separation of the enantiomers of the phenytoin metabolites and for kinetic data to be obtained on each chiral form of these solutes with HSA. The results that were obtained in this report are summarized in Tables 1–2. The range of dissociation rate constants that were measured for m-HPPH and p-HPPH with HSA were in the same range as reported for other drugs that have similar affinities and the same binding site for this protein [19,21,22].
This work demonstrated how the method of peak profiling can be adapted to simultaneously investigate the interaction kinetics of several solutes with an immobilized protein such as HSA. This included the use of this approach to examine the kinetics of the different chiral forms of a solute by making use of HSA as both a serum transport protein [3,7] and as a chiral stationary phase [23,24]. Although peak profiling on HSA columns has been used to study purified enantiomers for chiral compounds (e.g., as used with L-tryptophan in Ref. [31]), it was found in this report that peak deconvolution could also be employed in cases for which only partial resolution is obtained for mixtures of enantiomers. This latter approach could be employed for enantiomer peaks with resolutions as low as 0.37 and for chiral compounds that differed in their Ka values for HSA by only 13–24%. These results indicated that the same approach could easily be extended to other chiral compounds with similar or even larger differences in their binding to HSA. The techniques that were used in this report are not limited to HSA and phenytoin metabolites but could be applied to a variety of other proteins and chiral solutes, drugs or drug metabolites. The ability to carry out this method in an automated fashion and as part of an HPLC system should make this approach of particular interest in the rapid screening of drug-protein interactions or in detailed studies of solute-protein binding within the body [16,19,21,22].
Acknowledgements
This research was supported by the National Institutes of Health under grant R01 GM044931 and was conducted in facilities that were renovated under NIH grant RR015468.
Footnotes
Publisher's Disclaimer: This is a PDF file of an unedited manuscript that has been accepted for publication. As a service to our customers we are providing this early version of the manuscript. The manuscript will undergo copyediting, typesetting, and review of the resulting proof before it is published in its final citable form. Please note that during the production process errors may be discovered which could affect the content, and all legal disclaimers that apply to the journal pertain.
References
- 1.Lunde PK, Rane A, Yaffe SJ, Lund L, Sjoqvist F. Clin. Pharmacol.Ther. 1970;11:846. doi: 10.1002/cpt1970116846. [DOI] [PubMed] [Google Scholar]
- 2.Lund L, Berlin A, Lunde KM. Clin. Pharmacol. Ther. 1972;13:196. doi: 10.1002/cpt1972132196. [DOI] [PubMed] [Google Scholar]
- 3.Peters T Jr., editor. All About Albumin: Biochemistry, Genetics and Medical Applications. San Diego, CA: Academic Press; 1996. [Google Scholar]
- 4.Colmenarejo G. Med. Res. Rev. 2003;23:275. doi: 10.1002/med.10039. [DOI] [PubMed] [Google Scholar]
- 5.Kragh-Hansen U, Chuang VTG, Otagiri M. Biol. Pharm. Bull. 2002;25:695. doi: 10.1248/bpb.25.695. [DOI] [PubMed] [Google Scholar]
- 6.Ascenzi P, Bocedi A, Notari S, Fanali G, Fesce R, Fasano M. Mini-Rev. Med. Chem. 2006;6:483. doi: 10.2174/138955706776361448. [DOI] [PubMed] [Google Scholar]
- 7.Hage DS, Anguizola J, Barnaby O, Jackson A, Yoo MJ, Papastavros E, Pfaunmiller E, Sobansky M, Tong Z. Curr. Drug. Metab. 2011;12:313. doi: 10.2174/138920011795202938. [DOI] [PMC free article] [PubMed] [Google Scholar]
- 8.Patel S, Wainer IW, Lough WJ. Chap. 24. In: Hage DS, editor. Handbook of Affinity Chromatography. 2nd ed. Boca Raton, FL: CRC Press; 2006. [Google Scholar]
- 9.Dockal M, Carter DC, Ruker F. J. Biol. Chem. 1999;274:29303. doi: 10.1074/jbc.274.41.29303. [DOI] [PubMed] [Google Scholar]
- 10.Wan H, Bergstrom F. J. Liq. Chromatogr. Related Technol. 2007;30:681. [Google Scholar]
- 11.Hara S, Hagiwara J, Fukuzawa M, Ono N, Kruoda T. Anal. Sci. 1999;15:371. [Google Scholar]
- 12.Soldin SJ, Wang E, Verjee Z, Elin RJ. Arch. Pathol. Lab Med. 2003;127:1623. doi: 10.5858/2003-127-1623-POIISI. [DOI] [PubMed] [Google Scholar]
- 13.Bowmer CJ, Lindup EW. Biochem. Pharmacol. 1978;27:937. doi: 10.1016/0006-2952(78)90421-5. [DOI] [PubMed] [Google Scholar]
- 14.Ohnmacht CM, Chen S, Tong Z, Hage DS. J. Chromatogr. B. 2006;836:83. doi: 10.1016/j.jchromb.2006.03.043. [DOI] [PubMed] [Google Scholar]
- 15.Rich RL, Day YSN, Morton TA, Myszka DG. Anal. Biochem. 2001;296:197. doi: 10.1006/abio.2001.5314. [DOI] [PubMed] [Google Scholar]
- 16.Schiel JE, Hage DS. J. Sep. Sci. 2009;32:1507. doi: 10.1002/jssc.200800685. [DOI] [PMC free article] [PubMed] [Google Scholar]
- 17.Fitos I, Visy J, Kardos J. Chirality. 2002;14:442. doi: 10.1002/chir.10113. [DOI] [PubMed] [Google Scholar]
- 18.Rietbrock N, Lassmann A. Naunyn-Schmiedeberg’s Arch. Pharmacol. 1980;313:269. doi: 10.1007/BF00505744. [DOI] [PubMed] [Google Scholar]
- 19.Talbert AM, Tranter GE, Holmes E, Francis PL. Anal. Chem. 2002;74:446. doi: 10.1021/ac010643c. [DOI] [PubMed] [Google Scholar]
- 20.Hage DS, Chen J. Chap. 22. In: Hage DS, editor. Handbook of Affinity Chromatography. 2nd ed. Boca Raton, FL: CRC Press; 2006. [Google Scholar]
- 21.Schiel JE, Ohnmacht CM, Hage DS. Anal. Chem. 2009;81:4320. doi: 10.1021/ac9000404. [DOI] [PMC free article] [PubMed] [Google Scholar]
- 22.Tong Z, Schiel JS, Papastavros E, Ohnmacht CM, Smith QR, Hage DS. J. Chromatogr. A. 2011;1218:2065. doi: 10.1016/j.chroma.2010.10.070. [DOI] [PMC free article] [PubMed] [Google Scholar]
- 23.Allenmark S. Chromatographic Enantioseparation: Methods and Applications. 2nd ed. New York: Ellis Horwood; 1991. Chap. 7. [Google Scholar]
- 24.Patel S, Wainer IW, Lough WJ. Chap. 21. In: Hage DS, editor. Handbook of Affinity Chromatography. 2nd ed. Boca Raton, FL: CRC Press; 2006. [Google Scholar]
- 25.Walters RR. Chap. 3. In: Chaiken IM, editor. Analytical Affinity Chromatography. Boca Raton, FL: CRC Press; 1987. [Google Scholar]
- 26.Denizot FC, Delaage MA. Proc. Natl. Acad. Sci. U.S.A. 1975;72:4840. doi: 10.1073/pnas.72.12.4840. [DOI] [PMC free article] [PubMed] [Google Scholar]
- 27.Schiel JE. Ph.D. Dissertation. Lincoln: University of Nebraska; 2009. [Google Scholar]
- 28.Larsson PO. Methods Enzymol. 1984;104:212. doi: 10.1016/s0076-6879(84)04091-x. [DOI] [PubMed] [Google Scholar]
- 29.Chattopadhyay A, Hage DS. J. Chromatogr. A. 1997;758:255. doi: 10.1016/s0021-9673(96)00742-x. [DOI] [PubMed] [Google Scholar]
- 30.Loun B, Hage DS. Anal. Chem. 1994;66:3814. doi: 10.1021/ac00093a043. [DOI] [PubMed] [Google Scholar]
- 31.Yang J, Hage DS. J. Chromatogr. A. 1997;766:15. doi: 10.1016/s0021-9673(96)01040-0. [DOI] [PubMed] [Google Scholar]
- 32.Loun B, Hage DS. Anal. Chem. 1996;68:1218–1225. doi: 10.1021/ac950827p. [DOI] [PubMed] [Google Scholar]
- 33.Kim H, Hage DS. J. Chromatogr. B. 2005;816:57. doi: 10.1016/j.jchromb.2004.11.006. [DOI] [PubMed] [Google Scholar]