

Abstract
A signal to noise ratio (SNR) measure based on the octahedral shear strain (the maximum shear strain in any plane for a 3D state of strain) is presented for MR elastography, where motion-based SNR measures are commonly used. The shear strain, γ, is directly related to the shear modulus, μ, through the definition of shear stress, τ = μγ. Therefore, noise in the strain is the important factor in determining the quality of motion data, rather than the noise in the motion. Motion and strain SNR measures were found to be correlated for MRE of gelatin phantoms and human breast. Analysis of the stiffness distributions of phantoms reconstructed from the measured motion data revealed a threshold for both strain and motion SNR where MRE stiffness estimates match independent mechanical testing. MRE of the feline brain showed significantly less correlation between the two SNR measures. The strain SNR measure had a threshold above which the reconstructed stiffness values were consistent between cases, whereas the motion SNR measure did not provide a useful threshold, primarily due to rigid body motion effects.
Keywords: Octahedral Shear Strain, Signal to Noise ratio, MR Elastography, SNR, MRE
1. Introduction
Elastography is a modality which seeks to image the stiffness distribution of tissue, which is correlated with many diseases including cancer [Samani et al., 2007] and liver fibrosis [Huwart et al., 2008], [Ehman, 2009]. Stiffness images (elastograms) are calculated using measurements of the mechanical response of the tissue under a mechanical load, such as a quasi-static compression [Ophir et al., 1991], transient impulse [Sandrin et al., 2002], or harmonic excitation [Weaver et al., 2001]. Measurements can be taken using MRI [Muthupillai et al., 1995], ultrasound [Ophir et al., 1996] or other imaging modalities [Miga, 2003]. This paper focuses on time-harmonic magnetic resonance elastography (MRE), where full volume, 3D motion distributions are measured during low frequency (40–1000Hz) harmonic excitation.
Noise in the response data reduces the accuracy of the elastograms. Even under noise-free conditions, stiffness reconstruction techniques suffer inaccuracies due to model-data mismatch, as well as the discretization of continuous response and material property fields. Although the exact property solution is not attainable, phantom results have been presented which show good correlation between elastographic stiffness estimates and independent mechanical testing for both ultrasound elastography and MRI methods, despite the intrinsic measurement noise and resolution of each imaging modality ([Hamhaber et al., 2003], [Doyley et al., 2003] [Fromageau et al., 2007]). Achieving high SNR in vivo presents additional challenges. For example, MRE of the brain can be problematic due to the mechanical shielding effects of the skull, meninges and cerebro-spinal fluid [Sack et al., 2008]. If high SNR can be consistently achieved in vivo, stiffness reconstruction accuracy will be improved, therefore, quantification of measurement noise is important in elastography.
Stiffness estimates are generated by processing the measured response data, either through direct inversion of the governing differential equation [Oliphant et al., 2001], [Manduca et al., 2001], [Sinkus et al., 2000], or iterative optimization techniques [Van Houten et al., 2001], [Oberai et al., 2003]. In order for a data SNR measure to be relevant to the accuracy of the calculated stiffness, it must encode the SNR of the measured variable which is the most directly affected by the stiffness. Currently, the SNR of the measured motion is often used, however, the definition of the shear modulus as the ratio between shear stress, τ, and shear strain, γ,
| (1) |
implies that shear strain is required for the shear modulus to have any effect. If the shear strain produced by measurement noise is large compared to the shear strain caused by the actual motion, the shear modulus information will be corrupted. This implies that the factor which will influence the quality of stiffness estimates is the SNR of the strain caused by the motion, rather than the SNR of the motion, itself. The observation has been recognized in the ultrasound literature, where a `strain to noise ratio' is sometimes calculated [Bilgen and Insana, 1997]. The MRE literature on the other hand focuses on motion noise measures ([Sinkus et al., 2005b], [Bishop et al., 2000], [Grimm et al., 2004]). Although motion noise contributes to strain noise, other factors are also important such as resolution, frequency, stiffness and noise distribution. A 5% displacement noise with 1mm resolution will produce twice as much strain noise as 5% displacement noise with 2mm resolution, and the strain `signal' produced by a motion waveform of a given amplitude will be dependent on the frequency of excitation, as well as the stiffness of the material. In addition, any measurements with a significant rigid body motion component can have acceptable displacement amplitudes, but very little shear deformation, and therefore, carry limited elasticity information. The rigid body component will give a high motion SNR; therefore, this measure does not indicate the potential problem with the data.
Three-dimensional, full volume motion measurement has 6 unique strain components, which raises the question of how to combine noise in these individual components into a single value which reflects the overall quality of the strain data. This paper presents a method based on the octahedral shear strain, which is the maximum shear stress in any plane for a three-dimensional strain field. The most common use of octahedral stress/strain is prediction of the yield point of elastic materials under a general state of stress. The material is predicted to yield when the octahedral shear stress reaches a threshold value, and is equivalent to the well-known von Mises yield criteria. The decoupling of dilatational and distortional effects is necessary to produce a yield-model driven by the maximum shear stress, and proves useful in MRE by providing a measure of the total shear deformation occurring at a point under a general 3D state of strain.
2. Methods
2.1. Motion SNR calculation
MR measurements of harmonic motion typically involve recording displacements, di, at a given number of phase offsets, ti, during the time-harmonic cycle (8 equally spaced values of ti are used in this study). A sinusoid of the form S = Re{Aeiωt} is then fitted to these temporal measurements using the discrete fourier transform (DFT), where ω is the actuation frequency, and A is the fitted complex-valued amplitude. The noise level of the measured values, Nmeas, can be estimated using the standard deviation of the misfit between the fitted sinusoid and the displacement measurements (which assumes all fourier components away from the fundamental frequency are due to noise, and may not be true if motions at other frequencies are present),
| (2) |
where σ indicates the standard deviation over the number of phase offset values. It is reasonably safe to assume that the MR noise is uniformly distributed; therefore, a global noise estimate could also be taken using the standard deviation over the whole imaging volume. Propagation of uncertainties through the DFT can be used to transform Nmeas into noise in the fitted motion amplitude, Namp,
| (3) |
where N is the number of phase offsets. Namp is the same for the real part, imaginary part, and absolute value of the complex motion amplitude.
An SNR estimate is then given by the ratio of the average displacement amplitude and the average noise[Sinkus et al., 2005a],
| (4) |
where the overbar indicates the average value over the region of interest.
2.2. Octahedral shear strain SNR calculation
Cauchy's Symmetric strain tensor can be written as
| (5) |
where u, v and w are the displacements in the x, y and z coordinate directions, respectively. The 6 unique components of describe a general 3D state of strain, and can be transformed into two scalars: a dilatational component, εn, and a deviatoric component, εs. The total strain energy of the general system is the same as the sum of the strain energies resulting from individual application of the dilatational and deviatoric strains. Performing this split requires transformation of the general state of strain onto the octahedral planes, which are the 8 planes forming equal angles with each of the principal strain directions (these planes form a regular octahedron), and results in the octahedral normal strain (dilatational component),
| (6) |
which describes the volume change, and the octahedral shear strain (OSS, deviatoric component),
| (7) |
which is the maximum value of the shear strain on any plane. Both of these components are independent of the orientation of the coordinate system [Polakowski and Rifling, 1966].
The harmonic displacements and strain components can represented by a complex amplitude, e.g
| (8) |
where u(t) is the time-harmonic function, U* is the complex amplitude, and ω is the harmonic frequency. The exponents and square root in equation 7, however, are non-linear operations, therefore, the octahedral shear strain is not able to be described by a complex amplitude. This also implies the octahedral planes change orientation during the harmonic cycle. A plot of the OSS over one harmonic cycle for a representative measured data point is given in figure 1, which shows the OSS is periodic, with a frequency twice that of the driving signal. The average value of OSS over one period can be calculated by integration,
| (9) |
where Equation 9 is complicated function to integrate analytically, numerical experiments using 1000 random phantom strain measurements showed that estimating this integral over half of a period using 5 point Gaussian quadrature gives a median error of 0.3% (with 21 point gaussian quadrature as a reference).
Figure 1.

Octahedral shear strain over one harmonic cycle at a representative point.
The octahedral normal strain (Eq. 6) is linear, so it remains a harmonic function, and it's complex amplitude can be calculated using the individual strain component complex amplitudes. Note that if comparisons between the octahedral shear and normal strains are to be made, the octahedral normal strain must be treated the same way, i.e. calculate the average absolute value,
| (10) |
where |…| indicates the magnitude of the complex-valued amplitudes.
In order to quantify an average OSS for a ROI, a volumetric average of the time-averaged octahedral shear strain, , was computed by integrating the OSS distribution over the volume of the ROI.
| (11) |
where the large overbar indicates a volumetric averaging, and the small overbar indicates time averaging.
The strain noise, , can be calculated by evaluating Eq 11, with an estimate of the motion noise in place of the actual measured motions. Namp, as defined in Eq. 2, is always positive, and least squares fitting of a sinusoid to the 8 measured phase offsets will tend to evenly distribute the over and underestimation of the true displacement values. Therefore, a random sign was applied to each Namp value to give the motion noise distribution (variations in resulting from different sets of random signs were insignificant, on the order of 0.2% for a typical dataset). A strain signal to noise ratio (SNRstrain)can then be defined as
| (12) |
An SNR distribution can also be calculated by performing the averaging in Eq. 12 over local subregions around each point. A detailed regional analysis was considered outside the scope of this article, therefore, unless stated, all SNRstrain values were based on averages over the full volume.
2.3. Collection of data
This study uses MR detected, full volume 3D motion data. A pneumatic actuator, which consists of an elastic membrane driven by two external 12 inch subwoofers powered by an amplified signal generator was used to induce vibrations in the material. A Phillips Achieva 3T clinical MR scanner was used for the measurements, with additional motion sensitizing gradients added to standard multi-slice spin-echo and EPI imaging sequences [Weaver et al., 2001]. All three steady-state motion components were measured.
Three different sources of MRE data were evaluated in this study. Phantom experiments used Porcine skin gelatin (Type A, 300 bloom, Sigma Aldrich), 5% by weight for the background, and 10% for the inclusions. Typical phantom dimensions were 95×95×40mm, with a 20mm inclusion. An EPI sequence was applied, with data resolution of 2mm in all 3 directions, and 100Hz actuation. In vivo data from our breast cancer MRE studies was also used, which incorporates the same sequence, resolution and actuation frequency as the phantoms. The patients were in the prone position on a standard breast coil, with the breast resting on the actuator. The third data source was an in vivo feline brain hydrocephalus study. In this case, the pneumatic actuator was placed under the jaw of the anesthetized animal, and 85Hz displacement data was collected using a spin-echo sequence, with 1.25×1.25×2mm resolution. Data was collected from 11 animals, with up to 4 imaging sessions performed on different days.
2.4. Model-based reconstruction
A subzone-based reconstruction algorithm which estimates shear moduli through an iterative optimization framework [Van Houten et al., 2001][Van Houten et al., 2000][Van Houten et al., 2003] generated estimates of the shear modulus distribution. Briefly, the finite element method was used to calculate displacements using an estimate of the material property distribution. A range of material models can be considered this step. For this study, linear elasticity was applied for lightly damped gelatin phantoms, and a poroelastic model (which has been validated in tofu phantoms [Perriñez et al., 2009],[Perriñez et al., 2010]) was used for brain tissue, as it is known to behave like a poroelastic continuum [Pena et al., 1999]. The Gauss-Newton method then iteratively updates the material properties to minimize the difference between the measured displacements and the displacements calculated using the updated property estimate. In both the linear elastic and poroelastic models, the shear modulus, μ, and second Lame's parameter, λ, were the updated properties.
2.5. Experiment 1: Relationship between motion SNR and strain SNR
Since strain noise was calculated using motion noise, the relationship between motion and strain SNR for three different sources of data - gelatin phantom, in vivo human breast and in vivo feline brain - was investigated. Motion noise resulting from MR measurements can be assumed to be unbiased, and have no rigid body motion (RBM) component. If the measured motions have relatively small RBM, motion and strain will be linearly related; therefore, the relationship between motion SNR and strain SNR will also be linear. If a non-negligible RBM component exists, this linear relationship will break down. Each data source was analyzed by plotting strain SNR vs. motion SNR to identify cases with significant RBM components through deviations from a straight line relationship.
The relative size of the RBM component compared to shear-generating motion can be estimated using the ratio of the average displacement of all voxels to the average motion amplitude,
| (13) |
where {u1, u2, u3} is a 3D vector displacement, and the overbar indicates a volumetric average. This estimate was used to confirm that the level of deviation from a straight line relationship between motion and strain SNR was influenced by the relative size of the RBM component.
2.6. Experiment 2: Quantitative accuracy in gelatin phantoms
Linear elastic subzone-based stiffness reconstructions of three separate gelatin phantoms consisting of a 5% gelatin background with a 10% gelatin inclusion were performed at a variety of actuation amplitudes. Time-temperature superposition (TTS) [Doyley et al., 2010] was performed on cylindrical samples of the same phantom materials using a TA Instruments Q800 Dynamic Mechanical Analyzer (DMA) to provide independent measurements of the shear modulus at 100 Hz. TTS is a technique originally designed for polymers which is used to estimate the mechanical response of a material at higher frequencies based on a relationship between the mechanical driving frequency and the temperature of the sample. TTS avoids the resonance behavior which often causes erratic results during standard dynamic measurements at high frequency (i.e. F > 30Hz) and in soft materials (i.e. μ < 20kPa). The reconstructed stiffness of the background material was compared to the TTS values, and analyzed as a function of both strain and motion SNR to determine thresholds required for accurate reconstruction. Regions of interest for calculating SNRstrain and analyzing the stiffness values were manually selected for both the background material and inclusion, and did not include any points within two voxels of the material interface or data acquisition boundaries.
2.7. Experiment 3: Effect of SNR on in vivo feline brain stiffness reconstructions
Feline brain shear modulus distributions were estimated using the sub-zone iterative poroelastic reconstruction algorithm outlined in section 2.4. The literature shows significant variation of published in vivo brain matter shear modulus measurements (ranging from less than 1 kPa up to 35kPa [Kruse et al., 2008]). Thus, it is not possible to compare reconstructed values to a reliable independent estimate as in Experiment 1, however, large inter-subject variation is not expected with sufficient data SNR. A useful SNR measure is, therefore, one which has mean reconstructed stiffness values falling within a tight band at high SNR values, and identifies reconstructions which deviate from the norm as having lower SNR. Mean poroelastic shear modulus as a function of both motion and strain SNR was investigated. Since a poroelastic material can be modeled as a porous linear elastic matrix with an infiltrating pore fluid, a shear strain-based SNR is equally appropriate in this case (as in standard linear elasticity) because shear strain is required to gain information about the shear modulus of the elastic matrix. Some brain tissues are regarded as being significantly anisotropic, in particular the white matter [Prange and Margulies, 2002], making an isotropic assumption a simplification that may cause some inaccuracies. MRE algorithms based on orthotropic materials are being developed which will allow the stiffness in different directions to be estimated. For these algorithms, a more sophisticated SNR measure will likely be required.
2.8. Breast Data
Breast stiffness reconstructions were not analyzed as a function of SNR in the same way as the phantom and feline brain data because tumor-bearing breasts of unknown stiffness and variable composition were involved. As a result, stiffness values between patients are expected to be variable, and no alternative independent estimate of in vivo stiffness was available. Motion attenuation within the breast leads to strong spatial variations in SNR that would also require a detailed regional analysis.
3. Results
3.1. Experiment 1: Relationship between motion noise and strain noise
Figure 2 shows the relationship between strain noise and motion noise for three different applications. The left plot includes a collection of gelatin phantom experiments, conducted with different amplitudes of actuation. The center plot shows a similar graph with in vivo breast data, and the rightmost plot contains data from in vivo feline brain experiments. Correlation coefficients are given above each plot. Estimates of the relative size of the RBM components for all datasets using Eq. 13 were 25 ± 17% for phantoms, 60 ± 18% for breast, and 86 ± 19% for feline brain.
Figure 2.
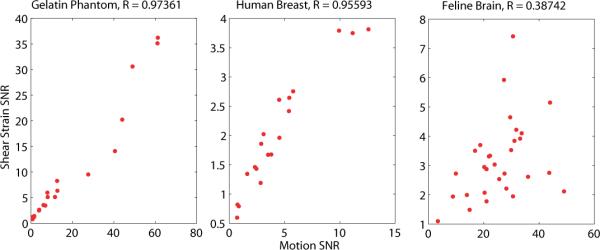
Correlation between shear SNR and motion SNR for three applications. The left plot shows gelatin phantoms, the center plot in vivo human breast, and the right plot shows in vivo feline brain. Pearson's correlation coefficients are given above each plot. Estimates of the mean relative size of the RBM components for all datasets were 25 ± 17% for phantoms, 60 ± 18% for breast data, and 86 ± 19% for feline brain.
3.2. Experiment 2: Quantitative accuracy in gelatin phantoms
Figure 3 shows typical motion, OSS, reconstructed shear modulus fields, along with the MR magnitude image and boundaries of ROI's used for the quantitative accuracy analysis of phantom reconstuctions.
Figure 3.
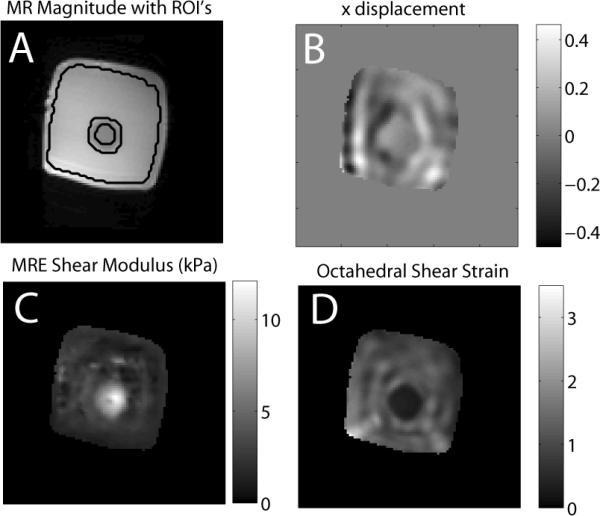
Typical displacement (B), MRE stiffness estimate (C), and octahedral shear strain (D) for a typical slice of a gelatin phantom. Image A shows the MR magnitude image with the outline of the ROI's used in the background and inclusion analysis shown as black lines. The background-inclusion interface was excluded from the ROI's to avoid manual segmentation errors.
Figure 4 shows the mean reconstructed background shear modulus as a function of both motion and strain SNR, for 3 different phantoms (5% gelatin background, 10% gelatin inclusion), imaged with a range of actuation amplitudes. A horizontal dotted line indicates the independent DMA shear modulus estimate.
Figure 4.

Quantitative evaluation of subzone MRE background shear modulus estimate with varying strain SNR (upper plot), and motion SNR (lower plot), for a collection of gelatin phantom datasets. Independent DMA measurements at the same frequency (using time-temperature superposition) are shown as dotted lines, the numerical values are 3.3 ± 0.8 kPa, and 8.8 ± 0.9 kPa.
3.3. Experiment 3: Effect of SNR on in vivo feline brain stiffness reconstructions
Figure 5 shows typical motion, OSS and reconstructed shear modulus fields, and the MR magnitude image with the the boundaries of the ROI used for the feline brain analysis.
Figure 5.

Typical displacement (B), MRE stiffness estimate (C), and octahedral shear strain (D) for a slice of a feline brain. Image A shows the MR magnitude image with the outline of the ROI used in the analysis shown as a black line.
Figure 6 shows the mean reconstructed poroelastic shear modulus of in vivo feline brain tissue with increasing SNR (strain SNR on the upper plot, motion SNR on the lower plot). Results are compiled from 11 different animals.
Figure 6.

Mean shear modulus of in vivo feline brain computed using a poroelastic subzone property reconstruction algorithm, plotted as a function of shear strain SNR (top) and motion SNR (bottom). Reliable independent estimates of brain stiffness are not available, however, large variations between datasets with sufficient SNR are not expected.
4. Discussion
Figure 2 shows motion SNR is correlated with strain SNR for both gelatin phantoms and in vivo human breast (R > 0.9); however, the correlation between the two SNR measures is weak for in vivo feline brain. The larger physical size of the phantom and breast, and boundary conditions at the chest wall leads to a small rigid body motion (RBM) component, i.e. the majority of the motion is wave-like, and produces strain. A motion SNR is proportional to a strain SNR in these cases, and therefore has similar properties. Phantom results presented in Figure 4 show the subzone reconstruction produces accurate modulus values for the background material at strain and motion SNR's above 4. The stiffer inclusion reconstructs accurately for strain SNR above 10, and for a motion SNR above 40 (limited SNR sampling indicates these values may be an upper limit). Strain SNR thresholds are similar for both materials, whereas motion SNR thresholds appear to be significantly different.
The case of the feline brain in Fig. 2 shows a weaker relationship between motion and strain SNR (R < 0.4) due to the large RBM component, resulting from the small size of the brain and the boundary conditions arising from the natural shock absorbing function of the skull and cerebral meninges. RBM increases the motion SNR; however, it leaves strain SNR unchanged. No change in SNR is desirable because no elasticity information is conveyed by RBM. The inadequacy of motion SNR when rigid body motion is present is illustrated in figure 6. The strain SNR plot shows the reconstructed modulus values stabilizing at a strain SNR above 3 (similar to the threshold from figure 4), whereas the motion SNR plot does not provide a reliable threshold for stability.
The strain SNR threshold for accurate reconstruction is similar for both phantom materials and feline brain, even with the differing experimental conditions (resolution, frequency and material). It is plausible that the strain SNR threshold will be approximately the same across a variety of resolutions, frequencies, and material shear moduli. The strain noise level is intrinsically sensitive to changes in resolution, due to the derivatives in the definition of strain. The size of the strain `signal' is dependent on the wavelength of the shear wave, which is determined by the frequency of excitation and the stiffness of the material [Manduca et al., 2001]. Changes in these experimental parameters will affect the strain SNR systematically, i.e it will decrease with higher resolution and longer shear wavelength (decreased frequency or increased stiffness). Motion SNR on the other hand does not necessarily follow these trends; therefore, even in cases such as phantoms and breast where a motion SNR threshold exists, new thresholds would have to be determined for each change in experimental conditions. A larger study involving multiple scans under a variety of experimental conditions would be required to test this hypothesis.
5. Conclusion
SNR based on strain rather than motion provides a reliable measure of the quality of MRE data, due to the direct dependency of shear modulus on strain. In some cases, such as phantoms and human breast, high motion SNR implies a high strain SNR, therefore, motion based measures are acceptable. However, in cases such as feline brain and stiff phantom inclusions, where significant rigid body motion components are possible, a strain based SNR measure is a better indicator of the likely reconstruction accuracy.
Acknowledgements
We gratefully acknowledge support from NIH/NIBIB R01-EB004632-04.
References
- Bilgen M, Insana MF. Error analysis in acoustic elastography. II. Strain estimation and SNR analysis. The Journal of the Acoustical Society of America. 1997;101:1147. doi: 10.1121/1.418019. [DOI] [PubMed] [Google Scholar]
- Bishop J, Samani A, Sciarretta J, Plewes DB. Two-dimensional MR elastography with linear inversion reconstruction: methodology and noise analysis. Physics in medicine and biology. 2000;45:2081. doi: 10.1088/0031-9155/45/8/302. [DOI] [PubMed] [Google Scholar]
- Doyley MM, Weaver JB, Van Houten EEW, Kennedy FE, Paulsen KD. Thresholds for detecting and characterizing focal lesions using steady-state MR elastography. Medical Physics. 2003;30:495. doi: 10.1118/1.1556607. [DOI] [PubMed] [Google Scholar]
- Doyley MM, Perreard I, Patterson AJ, Weaver JB, Paulsen KM. The performance of steady-state harmonic magnetic resonance elastography when applied to viscoelastic materials. Medical Physics. 2010;37:3970. doi: 10.1118/1.3454738. [DOI] [PMC free article] [PubMed] [Google Scholar]
- Ehman RL. Science to Practice: Can MR Elastography Be Used to Detect Early Steatohepatitis in Fatty Liver Disease? Radiology. 2009;253(1):1. doi: 10.1148/radiol.2531091040. [DOI] [PubMed] [Google Scholar]
- Fromageau J, Gennisson JL, Schmitt C, Maurice RL, Mongrain R, Cloutier G. Estimation of polyvinyl alcohol cryogel mechanical properties with four ultrasound elastography methods and comparison with gold standard testings. IEEE Transactions on Ultrasonics, Ferroelectrics and Frequency Control. 2007;54(3):498–509. doi: 10.1109/tuffc.2007.273. [DOI] [PubMed] [Google Scholar]
- Grimm RC, Kugel JL, Ehman RL. Proc. Intl. Soc. Mag. Reson. Med. volume 11. 2004. Improved phase to noise ratio for short T2* spins in MRE; p. 572. [Google Scholar]
- Hamhaber U, Grieshaber FA, Nagel JH, Klose U. Comparison of quantitative shear wave MR-elastography with mechanical compression tests. Magnetic Resonance in Medicine. 2003;49(1):71–77. doi: 10.1002/mrm.10343. [DOI] [PubMed] [Google Scholar]
- Huwart L, Sempoux C, Vicaut E, Salameh N, Annet L, Danse E, Peeters F, ter Beek LC, Rahier J, Sinkus R, et al. Magnetic resonance elastography for the noninvasive staging of liver fibrosis. Gastroenterology. 2008;135(1):32–40. doi: 10.1053/j.gastro.2008.03.076. [DOI] [PubMed] [Google Scholar]
- Kruse SA, Rose GH, Glaser KJ, Manduca A, Felmlee JP, Jack CR, Ehman RL. Magnetic resonance elastography of the brain. Neuroimage. 2008;39(1):231–237. doi: 10.1016/j.neuroimage.2007.08.030. [DOI] [PMC free article] [PubMed] [Google Scholar]
- Manduca A, Oliphant TE, Dresner MA, Mahowald JL, Kruse SA, Amromin E, Felmlee JP, Greenleaf JF, Ehman RL. Magnetic resonance elastography: non-invasive mapping of tissue elasticity. Medical Image Analysis. 2001;5(4):237–254. doi: 10.1016/s1361-8415(00)00039-6. [DOI] [PubMed] [Google Scholar]
- Miga MI. A new approach to elastography using mutual information and finite elements. Physics in Medicine and Biology. 2003;48:467. doi: 10.1088/0031-9155/48/4/304. [DOI] [PubMed] [Google Scholar]
- Muthupillai R, Lomas DJ, Rossman PJ, Greenleaf JF, Manduca A, Ehman RL. Magnetic Resonance Elastography by Direct Visualization of Propagating Acoustic Strain Waves. Science. 1995 September;269:1854–1857. doi: 10.1126/science.7569924. [DOI] [PubMed] [Google Scholar]
- Oberai AA, Gokhale NH, Feijoo GR. Solution of inverse problems in elasticity imaging using the adjoint method. Inverse Problems. 2003;19(2):297–313. [Google Scholar]
- Oliphant TE, Manduca A, Ehman RL, Greenleaf JF. Complex-valued stiffness reconstruction for magnetic resonance elastography by algebraic inversion of the differential equation. Magnetic Resonance in Medicine. 2001;45:299–310. doi: 10.1002/1522-2594(200102)45:2<299::aid-mrm1039>3.0.co;2-o. [DOI] [PubMed] [Google Scholar]
- Ophir J, Cespedes I, Ponnekanti H, Yazdi Y, Li X. Elastography: A quantitative method for imaging the elasticity of biological tissues. Ultrasonic imaging(Print) 1991;13(2):111–134. doi: 10.1177/016173469101300201. [DOI] [PubMed] [Google Scholar]
- Ophir J, Cespedes I, Garra B, Ponnekanti H, Huang Y, Maklad N. Elastography: ultrasonic imaging of tissue strain and elastic modulus in vivo. European journal of ultrasound. 1996;3(1):49–70. [Google Scholar]
- Pena A, Bolton MD, Whitehouse H, Pickard JD. Effects of brain ventricular shape on periventricular biomechanics: a finite-element analysis. Neurosurgery. 1999;45(1):107. doi: 10.1097/00006123-199907000-00026. [DOI] [PubMed] [Google Scholar]
- Perriñnez PR, Kennedy FE, Van Houten EEW, Weaver JB, Paulsen KD. Modeling of Soft Poroelastic Tissue in Time-Harmonic MR Elastography. IEEE transactions on biomedical engineering. 2009;56(3) doi: 10.1109/TBME.2008.2009928. [DOI] [PMC free article] [PubMed] [Google Scholar]
- Perriñnez PR, Pattison AJ, Kennedy FE, Weaver JB, Paulsen KD. Contrast detection in fluid-saturated media with magnetic resonance poroelastography. Medical Physics. 2010;37:3518. doi: 10.1118/1.3443563. [DOI] [PMC free article] [PubMed] [Google Scholar]
- Polakowski N, Rifling EJ. Strength and Structure of Engineering Materials. Prentice-Hall; New York: 1966. [Google Scholar]
- Prange MT, Margulies SS. Regional, directional, and age-dependent properties of the brain undergoing large deformation. Journal of biomechanical engineering. 2002;124:244. doi: 10.1115/1.1449907. [DOI] [PubMed] [Google Scholar]
- Sack I, Beierbach B, Hamhaber U, Klatt D, Braun J. Non-invasive measurement of brain viscoelasticity using magnetic resonance elastography. NMR in Biomedicine. 2008;21(3) doi: 10.1002/nbm.1189. [DOI] [PubMed] [Google Scholar]
- Samani A, Zubovits J, Plewes D. Elastic moduli of normal and pathological human breast tissues: an inversion-technique-based investigation of 169 samples. Physics in Medicine and Biology. 2007;52(6):1565–1576. doi: 10.1088/0031-9155/52/6/002. [DOI] [PubMed] [Google Scholar]
- Sandrin L, Tanter M, Catheline S, Fink M. Shear modulus imaging with 2-D transient elastography. IEEE Transactions on Ultrasonics, Ferroelectrics and Frequency Control. 2002;49(4):426–435. doi: 10.1109/58.996560. [DOI] [PubMed] [Google Scholar]
- Sinkus R, Lorenzen J, Schrader D, Lorenzen M, Dargatz M, Holz D. High-resolution tensor MR elastography for breast tumour detection. Physics in Medicine and Biology. 2000;45(6):1649–1664. doi: 10.1088/0031-9155/45/6/317. [DOI] [PubMed] [Google Scholar]
- Sinkus R, Tanter M, Catheline S, Lorenzen J, Kuhl C, Sondermann E, Fink M. Imaging anisotropic and viscous properties of breast tissue by magnetic resonance-elastography. Magnetic Resonance In Medicine. 2005a;53:372–387. doi: 10.1002/mrm.20355. [DOI] [PubMed] [Google Scholar]
- Sinkus R, Tanter M, Xydeas T, Catheline S, Bercoff J, Fink M. Viscoelastic shear properties of in vivo breast lesions measured by MR elastography. Magnetic Resonance Imaging. 2005b;23:159–165. doi: 10.1016/j.mri.2004.11.060. [DOI] [PubMed] [Google Scholar]
- Van Houten EEW, Miga MI, Weaver JB, Kennedy FE, Paulsen KD. Three-dimensional subzone-based reconstruction algorithm for MR elastography. Magnetic Resonance in Medicine. 2001;45:827–837. doi: 10.1002/mrm.1111. [DOI] [PubMed] [Google Scholar]
- Van Houten EEW, Doyley MM, Kennedy FE, Weaver JB, Paulsen KD. Initial in-vivo experience with steady-state subzone-based MR elastography of the human breast. J. Magn. Reson. Imaging. 2003;17:72–85. doi: 10.1002/jmri.10232. [DOI] [PubMed] [Google Scholar]
- Van Houten EEW, Weaver JB, Miga MI, Kennedy FE, Paulsen KD. Elasticity reconstruction from experimental MR displacement data: initial experience with an overlapping subzone finite element inversion process. Medical Physics. 2000;27:101. doi: 10.1118/1.598861. [DOI] [PubMed] [Google Scholar]
- Weaver JB, Van Houten EEW, Miga MI, Kennedy FE, Paulsen KD. Magnetic resonance elastography using 3D gradient echo measurements of steady-state motion. Medical Physics. 2001;28:1620. doi: 10.1118/1.1386776. [DOI] [PubMed] [Google Scholar]