Abstract
Background
Many studies in evolutionary biology and genetics are limited by the rate at which phenotypic information can be acquired. The wings of Drosophila species are a favorable target for automated analysis because of the many interesting questions in evolution and development that can be addressed with them, and because of their simple structure.
Results
We have developed an automated image analysis system (WINGMACHINE) that measures the positions of all the veins and the edges of the wing blade of Drosophilid flies. A video image is obtained with the aid of a simple suction device that immobilizes the wing of a live fly. Low-level processing is used to find the major intersections of the veins. High-level processing then optimizes the fit of an a priori B-spline model of wing shape. WINGMACHINE allows the measurement of 1 wing per minute, including handling, imaging, analysis, and data editing. The repeatabilities of 12 vein intersections averaged 86% in a sample of flies of the same species and sex.
Comparison of 2400 wings of 25 Drosophilid species shows that wing shape is quite conservative within the group, but that almost all taxa are diagnosably different from one another. Wing shape retains some phylogenetic structure, although some species have shapes very different from closely related species. The WINGMACHINE system facilitates artificial selection experiments on complex aspects of wing shape. We selected on an index which is a function of 14 separate measurements of each wing. After 14 generations, we achieved a 15 S.D. difference between up and down-selected treatments.
Conclusion
WINGMACHINE enables rapid, highly repeatable measurements of wings in the family Drosophilidae. Our approach to image analysis may be applicable to a variety of biological objects that can be represented as a framework of connected lines.
Background
Many endeavors in biology are limited by a combination of the number of specimens that can be measured, and the amount of information that can be extracted from each one. Examples include biodiversity surveys [1], quantitative trait locus studies [2], and artificial selection experiments [3]. Consequently, automated methods for measuring the morphology of specimens have long been desired by systematists, geneticists and evolutionary biologists.
Advances in technology and manufacturing of digitizing equipment and video cameras have greatly increased the ease with which landmarks or outlines can be recorded, especially in organisms (or parts thereof) where the specimen is readily projected into two dimensions [4]. In some cases, the combination of specimen handling, imaging and feature extraction can be very rapid. Good examples include the extraction of outlines from high contrast objects such as leaves [5] or shells [6]. In many other cases internal details of a specimen are of primary interest, or the form of the organism precludes such a simple approach. Sophisticated automated systems have been devised to extract such information [7], but none appear to have been widely used. As a result, in the vast majority of morphometric studies, considerable effort on the part of the observer is still required in the measurement of each specimen. Despite the fact that digitization is far quicker than manual measurement and recording of data, it can still be the limiting step in many morphometric studies. The preparation of the specimen for measurement may also be quite time-consuming.
Here we report on our largely automated system for recovering the locations of wing veins of flies in the family Drosophilidae. Drosophilid wings are an unusually favorable subject for automated image analysis. This is first because of the wealth of interesting and accessible biological questions that can be addressed with their wings. The function of wings for flight is clear, although they also function as sense organs [8], and in courtship. The nominate genus Drosophila includes the model organism D. melanogaster, as well as many other species that are preadapted to laboratory culture. Second, Drosophilid wings are quite easy to measure and handle because they are two-dimensional, translucent and relatively sturdy, having evolved to withstand large forces. As a result of these factors, Drosophilid wings are widely used for the study of the genetics of development, morphometrics and evolution (e.g. [9-13].
The current standard approach to the measurement of Drosophila wings is to mount detached wings, then digitize the positions of vein intersections manually (e.g. [12,14]. Weber [15] devised a complex apparatus to immobilize the wing of a live, intact fly, and project its image onto a digitizing tablet, thereby shortening handling time. Using this apparatus, Weber was able to perform a comprehensive series of selection experiments that demonstrated that the wings of D. melanogaster could readily evolve counter to the allometry within the species [16,17].
In this paper we describe the hardware and software that together make up the automated wing measurement system, which we call WINGMACHINE. The WINGMACHINE allows the measurement of 100 parameters that together sum up the positions of the major veins. Wings of live flies can be measured at a rate of better than one per minute. Our approach to feature extraction is unusual in basic biological applications in employing an a priori model as part of feature extraction. We report the repeatability of the resulting data, and briefly describe results from comparison of species and an artificial selection experiment.
Techniques
Specimen Handling
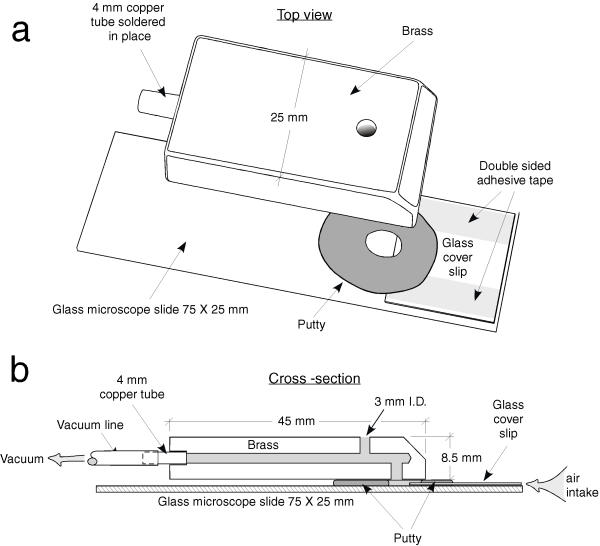
To handle specimens, we devised the simple 'wing grabber' suction device shown in Fig. 1. This is a simplified version of the apparatus used by Weber [15]. Vacuum is provided by a small pump (1/8 hp 22 l/min Welch dry vacuum pump 2522B-01). The flies to be measured are anaesthetized on a standard CO2 stage. The operator then takes the wing grabber in one hand, while maneuvering the target fly with a small paintbrush in the other hand. Once the wing grabber is properly positioned with the slit directly behind the fly and parallel to its wings, the operator places one finger over the top hole of the grabber, thus increasing the suction through the slit and sucking one wing into the grabber. Releasing and recovering the opening permits repositioning of the fly until a single wing is clearly visible, as shown in Fig. 2a. The wing grabber with attached fly is then positioned on the stage of a macroscope (see below) and a video image recorded. When suction is relaxed, the fly is pulled from the wing holder. This operation takes a few seconds, so the fly is still anaesthetized despite being removed from the CO2 flow. Flies are unharmed by this procedure, and recover consciousness rapidly. Operators usually become moderately proficient at this operation after a few trials, and expert with a few hours of experience. The amount of vacuum is adjusted to a level where the wing is readily grabbed without folding the wing by varying the input of the pump or the width of the slit.
Figure 1.
Wing grabber. (a) Separated into components; (b) cross-section of assembled grabber.
Figure 2.
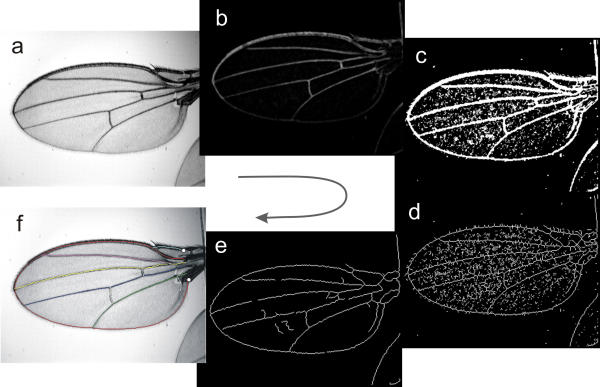
Steps in image processing. Raw image (a) is reversed, then filtered to minimize background features (b), then thresholded, and holes filled (c), features are skeletonized (reduced to 1 pixel width) (d) and short segments pruned away (e). The intersections of these lines are used to register the model with this image, and the model modified to fit the grey scale image in (c). The final result with the spline model overlayed on it (f). The white circles are the two landmarks digitized by the operator. Wing is from the Wabasso population of D. melanogaster.
After a few hours of operation, the slide and cover slip become too dirty for further use. At this point, the brass fitting is detached from the putty holding it in place, and a clean cover slip is attached to a new slide using fresh double-sided tape. A ring of putty is then placed over the gap between slide and cover slip and the brass fitting reattached.
Imaging
We have constructed three imaging systems with different hardware and front-end software programs. The key requirements of the system are that it produce a monochrome digital image, record two landmark locations and associate both with other recorded information about the specimen. To calibrate the size of the image, a stage micrometer is digitized before wings are imaged.
Both of our current systems use an Optem Zoom100 (or 120) macroscope interfaced with 1/2 inch monochrome CCD video cameras and a frame grabber board in a Windows computer. The video images have a maximum size of 632 × 480 pixels. Recording information about each image requires programmable software. ImagePro Plus 4.0 [18], an expensive image analysis program that includes a full-featured C-based programming language, is readily adapted for this purpose. In addition, we also use Scion Image [19], the commercial Windows version of NIH Image. While Scion Image is available without charge, it can only be used with a Scion frame grabber board. Scion Image has very minimal programming and output capability, so recording specimen information requires the use of a companion C++ program we have written.
Once an image is obtained, contrast is adjusted using the automatic algorithm in each software package. The operator then records the positions of two landmarks, the distal edge of the humeral break, and the tip of the fissure between the alula and the posterior edge of the wing blade. The recording programs automatically zoom the image to these areas in turn to improve accuracy. The image is saved as a TIFF file, and the associated identification, landmark coordinates and scale information written to another file.
Feature Extraction
The heart of the image analysis system is a C program called FINDWING, which takes the TIFF image and the associated coordinate information and produces a cubic B-spline [20] approximation to the position of all the wing veins distal to the line between the user-supplied landmarks, as shown in Fig. 2f. The key to the success of this algorithm is its use of an a priori B-spline model which is matched to the image of the wing. An example of this model is shown in Fig. 3. B-splines do not pass through their control points (shown as squares in Fig. 3), although they do pass through a point half way between adjacent control points. By convention, the end of the spline curve is represented as a control point (shown as circles in Fig. 3), and the interpolating function adjusted to compensate.
Figure 3.
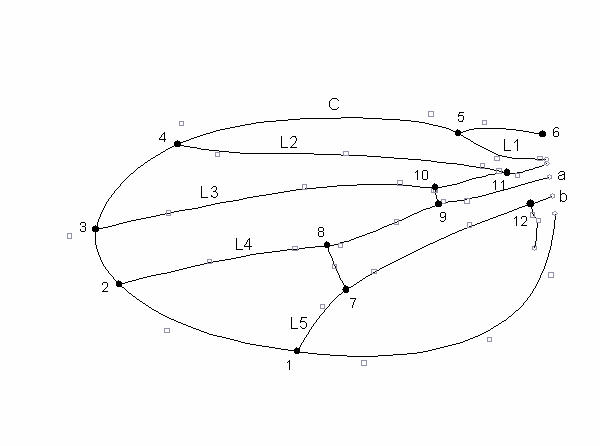
A B-spline wing model. Circles are the ends of splines, and the large filled circles are the landmarks analyzed. The squares are the internal control points of the splines. The long veins are labeled according to the standard 'genetic' nomenclature used in the paper. C denotes the costa. The model is optimized for a wing of Drosophila affinis.
FINDWING combines basic image processing of the wing image to facilitate the registration and modification of the a priori model. FINDWING proceeds in four major steps: preprocessing, production of a skeletonized binary representaion, registration of the intersections of the skeleton with the joints in the a priori model, and fitting of each spline curve to the preprocessed image. These steps are illustrated in Fig. 2.
In the preprocessing step, the raw image matrix (Fig. 2a) is inverted, subjected to a 3 × 3 median filter, and then subtraction of a gray scale opening (an erosion, followed by dilation using the same dimension of operator) to obtain the image Fig. 2b. These two operations largely remove small-scale features that form the uninformative background of the image. This preprocessed matrix is then thresholded, holes between features filled (Fig. 2c), the resulting features skeletonized (Fig. 2d), and short line segments removed (Fig. 2e). The parameters of each of these operations, such as the size of the opening filter and the cutoff for thresholding are under the control of the operator. The intersections (joints) of the remaining lines in this step are used as input for the registration step.
For registration, the image is first flipped to the standard orientation shown in Fig. 2 if necessary. Each observed joint is then tested to see if it is far enough from the landmark at 6 to potentially be either point 1 or 2. If it is, then the direction from the joint to landmark is used to define an affine transformation (translation, rotation, x and y scaling and shear) of all the observed joints. The nearest joint to the set of reference joints in this transformed space is then tentatively assigned the identity of that point, and the least squares deviation of this configuration from the model computed. The affine transformation that results in the best fit by least squares is then assumed to be the correct one. Reference systems based on both points 1 and 2 are evaluated in this way to guard against the case where no joint corresponding to one of these points is detected.
Finally, from the starting point defined by the best affine transformation of the model, the fit of each of the nine model curves is optimized using an approach based on that of Lu and Milios [20]. This approach treats the coordinates of the control points as variables, and does not fix the locations of the knots. The fit of the curve is optimized by maximizing the brightness of the pixels under the curve in the inverted image (Fig. 2b). The brightness (b, range 0 to 255) of each pixel is transformed to "energy" E as Eij = 255 exp [-0.12bij], and this matrix smoothed. The energy of a spline curve is the sum of the energy of each point under the curve. This energy is maximized by solving for the gradient vector of each control point with respect to E, then updating the set of control points using a variable step size. When this step converges to a solution, the resulting set of 100 parameters is output.
The output of FINDWING is a file giving the model parameters for each wing, and a TIFF image with the model overlayed on the raw image (Fig. 2f). This model is readily used to solve for derived measurements of any aspect of wing form defined by the model. We have principally analyzed the locations of vein intersections using a geometric morphometric approach, but any parameters measurable from the original vein structure, such as lengths, perimeters, areas or angles, can be recovered from the model.
The fitting parameters currently implemented in FINDWINGS work well on monochrome images that are 316 by 240 pixels. We expect that parameters giving good fits for other image sizes could be found, although we have not yet done so.
Running FINDWING
The success of FINDWING in fitting a model depends on the initial model parameters furnished the program, and a large set of fitting parameters that can be altered by the user. To maximize the success of the splining process, the model and fitting parameters often must be altered for each batch of wings according to species or lighting conditions. Finding an appropriate set of parameters is a matter of trial and error, aided by examining the results of intermediate processing steps (Fig. 2). Fitting parameters that are frequently altered include the dimension of the open radius used in preprocessing, and the threshold used to create the binary image for skeletonization. Models from one species can frequently be successfully used to spline wings from species with similar wing shapes. When a new model is needed, it is usually quite easy to find, as even a poor set of initial model parameters will result in a good fit to a minority of wings in a sample. Use of any of these successful output parameter sets as the initial model usually results in suitable fit to the majority of images in subsequent runs. Alternatively, a new model can be created by digitizing a likely set of control points, based on the properties of B-splines (Fig. 3).
We use FINDWING for both batch processing of large sets of wings, and for real-time interactive processing of single wings. When the goal of a study is to characterize variation among individuals or taxa, batch processing is more rapid than real-time processing. Real-time processing is convenient during a selection experiment, where a decision about whether to use an individual as a parent must be made rapidly. An important advantage of real time processing is that the operator can immediately examine the fit and if necessary alter the fitting parameters and rerun FINDWING until a suitable fit is achieved. The cost is the time that the operator puts into this checking and rerunning process. The run time of FINDWING itself is less than a second per wing on current Windows-based machines. In batch mode, one set of fitting parameters will typically produce excellent fits for 95 to 98% of the specimens. When used in batch mode, an experienced operator can image about 1 fly every 30 seconds. In real-time applications, this is slowed to about 1 fly per minute. This time advantage of batch processing is diminished but not eliminated when the editing or resplining of poorly splined wings is factored in.
When processing wings in batch mode, an important challenge is finding those cases when the fit of the model to the image is deficient. In all batch applications, we have been interested in the coordinates of landmark points, rather than curve locations per se. Since the vast majority of wings spline properly, examining each image is exceptionally tedious. To automate this process, we examine only multivariate outliers. The locations of the twelve labeled landmarks shown in Fig. 3 are first identified as the intersections of the appropriate model curves. Landmark coordinates are then aligned using the generalized least squares fit in tpsRegr [21]. Potential outliers are then flagged with Rousseeuw's minimum volume ellipsoid (MVE) algorithm [22,23], as implemented in the S-Plus program cov.mve [24]. MVE uses the Mahalanobis distance based on a robust estimate of the covariance matrix to detect outliers, thus preventing outliers from masking their own presence. The unaligned landmark coordinates from each outlier model are displayed along with the raw wing image in the digitizing program tpsDig [25], and landmarks dragged to their proper locations using a mouse, if necessary. This procedure finds both abnormal wings and cases where the model does not fit well.
Real-time processing is currently implemented through the C++ program SELECTOR that uses the output of a Scion Image macro and runs FINDWING and a tiff viewer. Batch processing is implemented in both R [26] and S-Plus scripts [27]. Source and compiled code for FINDWING, the R and S-Plus scripts, and example data are available on the WINGMACHIINE website [28].
Results
Repeatability
To assess the repeatability of the WINGMACHINE system, we repeatedly imaged and analyzed the wings of a sample of Drosophila melanogaster generated as part of a much larger quantitative genetic study. Male flies (N = 87) were imaged an average of 3.3 times, and female flies (N = 92) an average of 2.7 times each, for a total of 535 wing images. The flies were measured between 2 and 11 days of adult age over a period of 9 days by five operators.
As expected, female wings are on average larger than male wings (centroid size 1201 vs. 1036 μm), and the mean location of all of the landmarks also differs between the sexes at P < 0.0001. The repeatability of centroid size within sexes is very high at 96%. Table 1 also shows the among fly variance component over sexes, and the proportion of the within-sex variance that this represents. The average repeatability over all 12 points is 82%. The least repeatable points also tend to have the least variance, so the proportion of the total variance in locations that is fly variance is a little higher at 86%. Point 5 is the least accurately captured (repeatability 47%), which is not surprising as this curve does not follow the entire length of the costal vein. This was a deliberate choice in the design of the program, as the large costal break near point 5 is quite difficult to spline around. When point 5 is removed from consideration, the average repeatability rises to 85%. Operator effects are significant for the majority of the points, but represent less than 1% of the total variation among images. Point 6, one of the initial landmarks entered by the operator, has the largest operator effect, but this is still only 3.2% of the total.
Table 1.
Repeatabilities of centroid size and landmark positions in the Wabasso population of Drosophila melanogaster. Centroid size is in units of μm. Point locations are in units of mean centroid size/1000.
| Percent of within-sex variance | |||||||
| Over repeated imaging |
Over fitting, models |
||||||
| Trait | Differencea |♀-♂| |
Among fly varianceb | % Fly | % Operator | % Fly | ||
| Centroid size | 164.83 | 517.21 | 96.2 | 0.5 | 99.5 | ||
| Landmark: | 1 | 3.32 | 52.67 | 90.2 | 1.1 | *** | 97.4 |
| 2 | 6.83 | 22.54 | 91.1 | 0.0 | 96.7 | ||
| 3 | 4.18 | 21.78 | 89.5 | 0.3 | * | 96.7 | |
| 4 | 11.68 | 75.15 | 91.6 | 0.9 | *** | 96.1 | |
| 5 | 3.44 | 14.32 | 46.9 | 2.4 | * | 72.6 | |
| 6 | 3.16 | 11.71 | 75.7 | 3.2 | *** | 94.6 | |
| 7 | 4.60 | 39.82 | 94.3 | 0.2 | ** | 97.8 | |
| 8 | 2.19 | 43.83 | 95.2 | 0.2 | *** | 98.0 | |
| 9 | 1.42 | 24.57 | 90.6 | 0.9 | *** | 96.3 | |
| 10 | 2.61 | 26.74 | 91.7 | 0.4 | *** | 97.5 | |
| 11 | 2.17 | 7.67 | 64.5 | 1.6 | *** | 78.7 | |
| 12 | 4.08 | 12.39 | 65.8 | 0.6 | *** | 71.0 | |
| Landmark total | 355.17 | 86.0 | 0.8 | 92.7 | |||
* P < 0.05; ** P < 0.01; *** P < 0.001. aDistance between mean locations of each point. All differences between the sexes are significant at P < 0.0001. bAll among fly differences are significant at P < 0.0001. Point variances are the sums of variance components in the x and y dimensions.
Another potential source of error is the choice of the initial model and fitting parameters. To investigate this, we took the images from the above data set measured by one operator (N = 179), and splined and corrected them using two different sets of initial model parameters and four different sets of fitting parameters in a total of five combinations. After the editing process, repeatabilities across this set of measurements are considerably higher, totaling 93%, as shown in the final column of Table 1. Mean differences among parameters are slight, and generally not significant. Even when models based on the wings of three different species are used for the initial models (D. melanogaster, virilis, and affinis), total repeatability only declines to 91%. As above, points 5, 11 and 12 again have relatively low repeatabilities.
Species Data
One important use of high dimensional phenotypic data that an automated system can produce is investigation of the relationship between phylogeny and phenotypic evolution. For example, discrepancies between phenetic and phylogenetic relationships may indicate taxa where evolution has been rapid or unusual in some other way.
To investigate the ability of the wing machine system to measure other species, we imaged individuals of 25 species in the sub-family Drosophilinae of the family Drosophilidae, listed in Table 2 (see Additional File 1). Species were chosen to represent a wide diversity of taxa in the traditional genus Drosophila, along with a few related taxa.
Despite the great interest in the genus Drosophila as a model for genetics, development and evolution, there is still considerable doubt over the correct phylogeny within the genus and the Drosophilinae. Fig. 4 presents a phylogenetic hypothesis for the taxa in our sample, showing some major unresolved issues. The consensus phylogeny of Remsen and O'Grady [29] was used as the basis for the hypothesis, supplemented by other results for the more closely related taxa [30-32].
Figure 4.
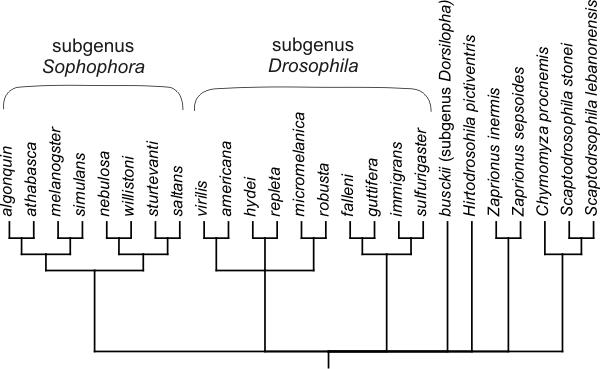
Phylogenetic hypothesis for the taxa in this study.
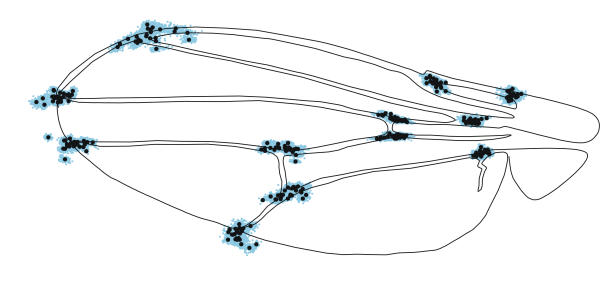
The aligned and size-adjusted landmark coordinates for all 2406 individuals measured are shown in Fig. 5. Overall, the positions of landmarks are quite conservative, with considerable overlap in landmark positions among species. Wing shape in the Drosophilinae provides an example of relative stasis.
Figure 5.
Aligned species data. Black circles represent the mean locations of landmarks in each species; blue dots are the positions of each of the landmarks in each of the 2406 specimens. The wing used as the basis for the line drawing was chosen to be as close as possible to the tangent or reference configuration.
Despite the impression of stasis, linear discriminant analysis of the aligned data, plus centroid size indicates that taxa are usually diagnosable: When a random half of the data is used to train the discriminant function, the error rate in assigning specimens in the remaining, evaluation data set to species is only 4%, compared to 3% in the training data set itself. The vast majority of classification errors are between two closely-related species pairs:D. melanogaster and simulans, and algonquin and athabasca in sub-genus Sophophora. D. robusta and hydei in subgenus Drosophila are also frequently confused, despite being less closely related. The wide taxonomic sampling in our data set suggests that a randomly chosen set of species would be less diagnosable.
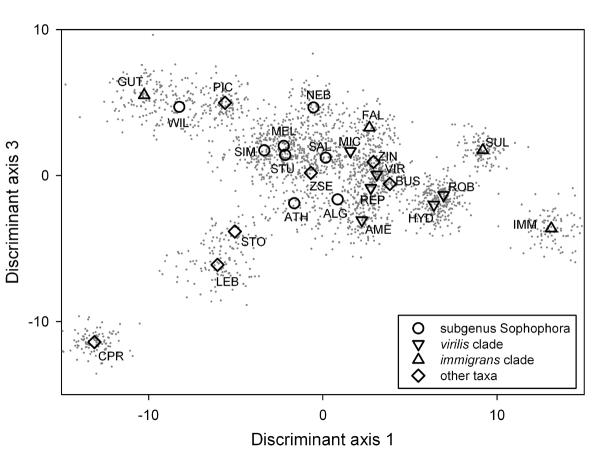
Ordination of the data along the first and third linear discriminant axes is shown in Fig. 6. The first and third axes explain 33 and 13% of the variation respectively. The second discriminant axis (which explains 20% of the variation) is not shown, as it largely serves to separate the divergent D. guttifera from the other species. Examination of the ordination shows some support for the major hypothesized species groups. In this projection, subgenus Sophophora (with the exception of D. willistoni) and the virilis-repleta clade of subgenus Drosophila are reasonably tightly grouped. The hypothesized immigrans clade, however, is spread across the entire space. In particular D. guttifera is very far removed from other members of this clade.
Figure 6.
Ordination of species data on the first and third discriminant axes. Gray dots are individuals, while large symbols denote species means. Species codes are given in Table 2 (Additional File 1).
To evaluate the correspondence of the distance matrix with the phylogeny, we fit the branch lengths of the consensus tree using a minimum evolution criterion, with the result shown in Fig. 7. The high variance in branch lengths, and the disappearance of many of the internal nodes (representing negative branch lengths) suggest that there are large scale departures from clock-like divergence. D. guttifera and D. willistoni again stand out as highly diverged from their closest relatives. Because of the strong evidence for changes in the rate of wing shape divergence, we fit a neighbor-joining tree to these data. The result is the peculiar tree in Fig. 8, which diverges from the consensus trees in numerous ways. This suggests that wing shape evolution involves departures from random divergence, such as convergence, as well as differences in rate. Convergence in wing form is suggested by the similarity of phylogenetically distant taxa, such as D. busckii grouping within the Sophophorans.
Figure 7.
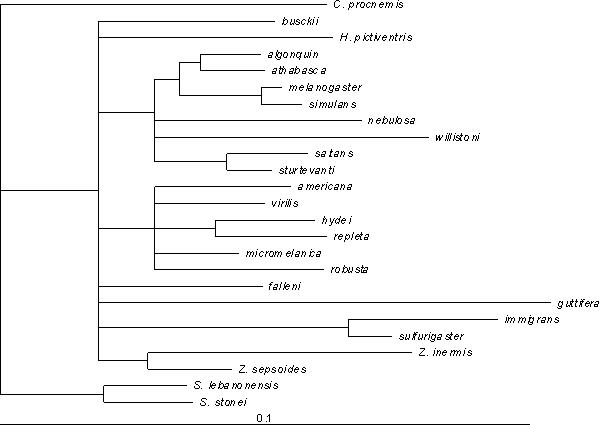
Mapping of the species distance matrix onto the phylogenetic hypothesis in Figure 4.
Figure 8.
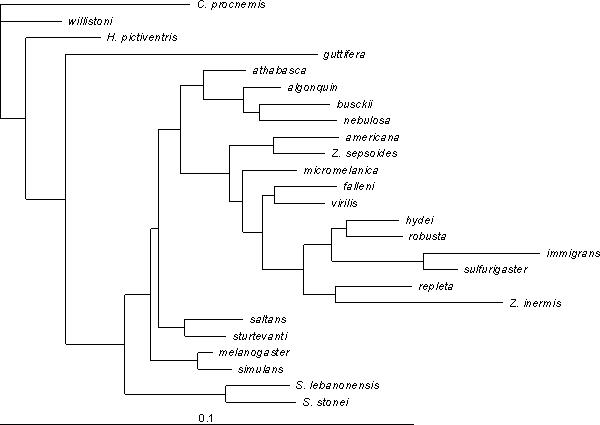
Neighbor-joining phylogeny based on wing shape. Tree is rooted by designating Chymomyza procnemis as the outgroup.
Selection on Wing Shape
Wing size or shape has long been a popular target for artificial selection experiments (e.g. [33,34]) due to the relative ease with which wings can be measured. For measurement of simple characters, such as length, our automated system offers few advantages. For some questions, however, it is advantageous to be able to readily construct complex selection indices that capture many aspects of variation. For example, to test whether arbitrary aspects of form can respond to selection, Weber [16,17] selected on six ratios of lengths between landmarks on the wing. Remarkably, all six ratios were readily able to evolve away from the allometric relationship they showed within species. The spline models we fit to each wing allow the instantaneous calculation of any function of wing shape.
We have used the WINGMACHINE system to select on a complex index of wing shape. The base population for this experiment is the IV laboratory population of D. melanogaster [35]. We chose to select on two uncorrelated but highly heritable traits. Trait S1 is defined as the standardized average distance between veins L3 and L4 distal to the proximal crossvein. Trait S2 measures the relative position of the distal crossvein along both veins L4 and L5. See Fig. 3 for the vein terminology used. The final selection index was the variance-weighted sum of S1 and S2. Details of the traits are given in Methods. A total of 27 measurements are needed to calculate the overall selection index.
In an initial sample of parents and offspring of 57 full-sib families (N = 470 offspring), traits S1 and S2 had high heritabilities (0.54 ± 0.05; 0.64 ± 0.06 respectively) and additive genetic coefficients of variation typical of those found in fly wings (1.5% and 1.6%; c.f. [36]). S1 and S2 have a non-significant additive genetic correlation (rA= 0.12).
We formed two replicate populations by a random division of flies in the IV population, then founded three treatments in each replicate: selection up, selection down, and a control. Each generation, in each of the four selected treatment/replicate combinations 100 virgin flies were measured, and the 20 most extreme chosen as parents of the next generation.
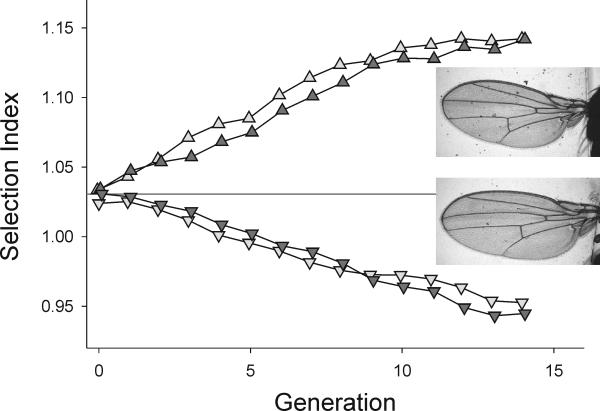
Figure 9 shows the highly significant 15 S. D. divergence in trait values achieved between these selected lines in 15 generations. The realized h2 for the selection index averaged over treatments and replicates was 0.38, lower than that in the base population. Examination of Fig. 9 shows that this is due to a reduction in response with increasing number of generations, particularly in the Up lines.
Discussion
Our automated wing analysis system, WINGMACHINE, successfully fulfils its intended purpose as a means of rapidly gathering repeatable high-dimensional phenotypic data. We have shown that the system is useful for characterizing variation among Drosophilid species, and that it facilitates artificial selection experiments on complex aspects of wing shape.
Dryden and Mardia [37] divide image analysis into "low" and "high-level" operations. Low level analysis involves local operations on small numbers of pixels, such as filters and edge detection. High level analysis involves detection and fitting of large-scale features of an image. Our use of an a priori model of wing shape that is deformed to optimize fit to each image is a simple example of high-level analysis.
Prior to developing this approach, we devoted considerable effort to developing a feature extraction system based entirely on low level analysis. These efforts were frustrated by several features of wings. The leading edge of the wing consists of a thickened vein that exhibits high contrast, while the trailing edge of the wing does not. Second, lighting across the image is uneven. Third, small flaws in the image, such as dust or hairs, or in the wing itself, such as small nicks, are hard to automatically disentangle from wing features. All of these frustrate simple edge detection and tracing algorithms. WINGMACHINE successfully splines wings that are both damaged and dirty. Similar complications are common in most biological imaging problems. Our success in implementing high-level analysis suggests that it could be useful in a large number of image analysis applications in basic biology.
More specifically, our approach may be directly extensible to other objects that can be summarized as a framework of intersecting lines, such as leaf veins and edges, scales or feathers. The specification of a model with different vein or edge topologies than in Drosophila wings is readily accomplished. While the precise algorithms in our software are specifically tailored to Drosophila wings, our general approach might be useful to fit models of very different structures.
In comparison with the more widely used hand-digitization of wing landmarks (e.g. [12,14]) the WINGMACHINE approach has the advantage of great speed, both in handling the specimens, and recovering quantitative information from them. An experienced operator spends on average about 1 minute per specimen in total. This speed comes with some disadvantages. While the repeatabilities of most landmarks are quite high, human observers can in some cases do much better. If the goal is to characterize the mean of a population (such as a family or a species), there is a simple tradeoff between speed and accuracy: if it takes x times as long to measure an image by hand, then it will be worthwhile to do so if the measurement error of the automated system is greater than x times the measurement error achieved by hand.
The structure of the model chosen for fitting and the details of image processing determine the precise locations of the curves and interesections recovered. The result is that the landmarks, for example, are frequently not as a human observer would place them. For example point 11, the intersection of L2 and L3, has relatively low repeatability because it is recognized as the intersection of the curves along these veins, rather than as the sinus formed by the interior outline of the veins, as a human observer would naturally do. This feature of the model potentially creates bias if a particular feature of the wing is of primary interest.
Another limitation of the system is that it is restricted to dealing with the distal features of the wing. The attachment point of the wing to the body, and the complex arrangement of veins near that point are not included. These aspects of wing form may be important mechanically and aerodynamically.
A final disadvantage of the WINGMACHINE may fail for wings of species with highly melanized spots at vein intersections, for example the "picture-winged" Hawaiian Drosophila. Initial attempts to spline wings of D. grimshawi have such a high error rate that hand-digitization is simpler and less time-consuming. On the other hand, melanization seems to be dependent on rearing conditions, and we have had good success with lighter-winged individuals of another picture-winged species, D. gymnobasis.
Ultimately, our understanding of biological systems needs to encompass the relationships between molecular and phenotypic data. Much attention is now focused on high throughput genomic techniques such as sequencing, expression microarrays and proteomics. To take advantage of this avalanche of genetic data, comparable efforts will be needed to characterize the whole-organism phenotype, what might be called phenomics [38]. The WINGMACHINE shows that high-throughput phenotyping is also feasible.
Conclusions
The combined software and hardware that make up the WINGMACHINE enables rapid, highly repeatable measurements of the wings of flies in the family Drosophilidae. In total 100 parameters are extracted about each win in only 1 minute per specimen. This system greatly speeds up various data intensive studies with Drosophila wings. Our approach would benefit studies of the relationship between genotype and phenotype, quantitative genetics, QTL mapping, selection experiments, developmental genetics, biodiversity surveys to name but a few examples. Our approach to image analysis may be applicable to a variety of biological objects that can be represented as a framework of connected lines.
Availability and requirements
Project name: FLYWING
Project home page: http://www.bio.fsu.edu/~dhoule/Software
Operating system: Windows
Programming language: C, S
License: GNU
Methods
Repeatability
The source population consisted of the offspring of one hundred thirty-five D. melanogaster females captured in Wabasso, Florida in March 2002. The offspring were pooled to form a laboratory population. In August 2002, five males from this population were each mated to three virgin females, and their offspring reared on standard cornmeal-sucrose-brewer's yeast medium at 25°C. The upper surface of the left wing of 179 flies was repeatedly imaged and splined. Variance component estimates for each sex separately showed that the variances did not differ significantly, so the sexes were analyzed together. Variance components for centroid size and the coordinates of the 12 landmarks were estimated in the SAS program MIXED [39,40], with sex as a fixed effect and fly and operator as random effects. Variance components for the x and y coordinates of each point were summed to obtain the point variance estimates shown in Table 1. Significance of the main effects at each point was tested by MANOVA in GLM [40].
Species sample
Stocks were obtained through collection, or through the Drosophila Species Stock Center, then at Bowling Green, Ohio, as shown in Table 2 (Additional File 1). Specimens were mostly reared in our laboratory on either cornflour-sucrose, or banana-molasses medium according to the recommendations of the Stock Center (currently at the University of Arizona [41]). Individuals of Scaptodrosophila stonei, Zaprionus sepsoides, Z. inermis and D. micromelanica did not reproduce in our hands, and so wings of individuals emerging from vials sent by the stock center were imaged. Individuals of D. melanogaster were drawn from two populations: a wild collection from Whitby, Ontario, Canada; and a long-term laboratory population (IV) [35]. All specimens were imaged and splined by one operator. Splining model and fitting parameters were adjusted for each species to maximize the success rate as judged by the operator. The result was that a different model was used for each species. Discriminant analysis was carried out in Proc Discrim in SAS [40]. Distance-based trees were fit with PAUP* [42].
Selection index
The terminology used to refer to wing veins and landmarks is given in Fig. 3. To calculate S1, we took ten evenly spaced points along the length of vein L3 distal to the crossvein, and solved for the distance to the closest point on vein L4. The average of these distances was then standardized by wing area to yield S1. Trait S2 is calculated as  , where |x-y| denotes distance from point x to point y along the model curve that connects them. The selection index used for artificial selection was 2.6S1 + S2. S1 was weighted 2.6 times as much as S2 so that the intensity of selection on each trait would be equal.
Authors' contributions
DH conceived the approach, commissioned the writing of FINDWING, supervised the application studies and their final analyses and wrote the manuscript. JM carried out the repeatability study, PG performed the species analysis, and AC supervised the selection experiment. PG, JM, and DH wrote the ancillary S-Plus software. All authors read and approved the final manuscript.
Figure 9.
Response to 14 generations of selection on the wing shape index. Two replicate populations were selected up, and two were selected down. Wings of female flies from an up-selected (upper) and down-selected (lower) population at generation 14 are shown.
Supplementary Material
Table 2 Description: List of taxa included in the multi-species data set.
Acknowledgments
Acknowledgements
Feng Lu deserves all credit for developing the FINDWING program. If only he hadn't disappeared. Y. Ng and V. Jackson wrote the program SELECTOR. F. James Rohlf generously modified his TPS programs to facilitate our analyses, and responded to all queries on how to use them. Locke Rowe, Don Jackson, Tim Dickinson, Doug Currie, J. Birdsley, Jim Wilgenbusch and Scott Steppan offered valuable advice and comments. D. Houle was supported by NSERC, and by NSF grant DEB-0129219. P. Galpern was supported by a PGS award from NSERC. L. Carpenter, M. Castilla, J. Gunzburger, N. Guram, Y. Ng, F. Smyth, J. Woehlke, and T. Weier, all helped measure wings.
Contributor Information
David Houle, Email: dhoule@bio.fsu.edu.
Jason Mezey, Email: jgmezey@ucdavis.edu.
Paul Galpern, Email: paul.galpern@utoronto.ca.
Ashley Carter, Email: carter@bio.fsu.edu.
References
- Weeks PJD, Gaston KJ. Image analysis, neural networks, and the taxonomic impediment to biodiversity studies. Biodiversity and Conservation. 1997;6:263–274. doi: 10.1023/A:1018348204573. [DOI] [Google Scholar]
- Liu J, Mercer JM, Stam LF, Gibson GC, Zeng Z-B, Laurie CC. Genetic analysis of a morphological shape difference in the male genitalia of Drosophila simulans and D. mauritiana. Genetics. 1996;142:1129–1145. doi: 10.1093/genetics/142.4.1129. [DOI] [PMC free article] [PubMed] [Google Scholar]
- Weber KE, Diggins LT. Increased selection response in larger populations. II. Selection for ethanol vapor resistance in Drosophila melanogaster at two population sizes. Genetics. 1990;125:585–597. doi: 10.1093/genetics/125.3.585. [DOI] [PMC free article] [PubMed] [Google Scholar]
- Rohlf FJ. Feature extraction in systematic biology. In: Fortuner R, editor. In Advances in computer methods for systematic biology: artificial intelligence, databases, computer vision. Johns Hopkins: Baltimore; 1993. pp. 375–392. [Google Scholar]
- Jensen RJ, Ciofani KM, Miramontes LC. Lines, outlines, and and landmarks: morphometric analyses of leaves of Acer rubrum, Acer saccharinum (Aceraceae) and their hybrid. Taxon. 2002;51:475–492. [Google Scholar]
- Ferson S, Rohlf FJ, Koehn RK. Measuring shape variation of two-dimensional outlines. Syst Zool. 1985;34:59–68. [Google Scholar]
- Zhou Y, Ling L, Rohlf FJ. Automatic description of the venation of mosquito wings from digitized images. Syst Zool. 1985;34:346–358. [Google Scholar]
- Dickinson MH, Hannaford S, Palka J. The evolution of insect wings and their sensory apparatus. Brain Behav Evol. 1997;50:13–24. doi: 10.1159/000113318. [DOI] [PubMed] [Google Scholar]
- Cowley DE, Atchley WR, Rutledge JJ. Quantitative genetics of Drosophila melanogaster. I. Sexual dimorphism in genetic parameters for wing traits. Genetics. 1986;114:549–566. doi: 10.1093/genetics/114.2.549. [DOI] [PMC free article] [PubMed] [Google Scholar]
- Garcia-Bellido A, de Celis JF. Developmental genetics of the venation pattern of Drosophila. Ann Rev Genet. 1992;26:277–304. doi: 10.1146/annurev.ge.26.120192.001425. [DOI] [PubMed] [Google Scholar]
- Stark J, Bonacum J, Remsen J, DeSalle R. The evolution and development of Dipteran wing veins: a systematic approach. Ann Rev Entomol. 1999;44:97–129. doi: 10.1146/annurev.ento.44.1.97. [DOI] [PubMed] [Google Scholar]
- Klingenberg CP, Zaklan SD. Morphological integration between developmental compartments in the Drosophila wing. Evolution. 2000;54:1273–1285. doi: 10.1111/j.0014-3820.2000.tb00560.x. [DOI] [PubMed] [Google Scholar]
- Gilchrist AS, Azevedo RBR, Partridge L, O'Higgins P. Adaptation and constraint in the evolution of Drosophila melanogaster. Evolution and Development. 2000;2:114–124. doi: 10.1046/j.1525-142x.2000.00041.x. [DOI] [PubMed] [Google Scholar]
- Zimmerman E, Palsson A, Gibson G. Quantitative trait loci affecting components of wing shape in Drosophila melanogaster. Genetics. 2000;155:671–683. doi: 10.1093/genetics/155.2.671. [DOI] [PMC free article] [PubMed] [Google Scholar]
- Weber KE. A system for rapid morphometry of whole, live flies. Drosop Inform Serv. 1988;67:96–101. [Google Scholar]
- Weber KE. Selection on wing allometry in Drosophila melanogaster. Genetics. 1990;126:975–989. doi: 10.1093/genetics/126.4.975. [DOI] [PMC free article] [PubMed] [Google Scholar]
- Weber KE. How small are the smallest selectable domains of form? Genetics. 1992;130:345–353. doi: 10.1093/genetics/130.2.345. [DOI] [PMC free article] [PubMed] [Google Scholar]
- Media Cybernetics . ImagePro Plus, Version 40 for Windows. Media Cybernetics: Silver Spring, MD; 1999. http://www.mediacy.com [Google Scholar]
- Scion Corporation . Scion Image 20. Scion: Frederick, MD; 2001. http://www.scioncorp.com [Google Scholar]
- Lu F, Milios EE. Optimal spline fitting to planar shape. Signal Processing. 1994;37:129–140. doi: 10.1016/0165-1684(94)90171-6. [DOI] [Google Scholar]
- Rohlf FJ. tpsRegr: shape regression Ver 117 Dept of Ecology and Evolution, State University of New York, Stony Brook, NY. http://life.bio.sunysb.edu/morph/
- Rousseeuw PJ. Multivariate estimation with high breakdown point. In: Grossman W, Pflug G, Vincze I, Wertz W, editor. In Mulivariate Statistics and Applications. Reidel: Dordrecht; 1985. pp. 283–297. [Google Scholar]
- Rousseeuw PJ, van Zomeren BC. Unmasking multivariate outliers and leverage points. J Am Stat Assoc. 1990;85:633–639. [Google Scholar]
- Insightful Corporation . S-Plus 60 Professional Release 1. Insightful: Seattle; 2001. [Google Scholar]
- Rohlf FJ. tpsDig: digitizing software V 117 Dept of Ecology and Evolution, State University of New York, Stony Brook, NY. http://life.bio.sunysb.edu/morph/
- R Project for Statistical Computing R 1.8.0 for Windows http://www.r-project.org
- Insightful Corporation S-Plus 6 for Windows Programmer's Guide Insightful: Seattle; 2001.
- WINGMACHINE Software http://bio.fsu.edu/~dhoule/Software/
- Remsen J, O'Grady P. Phylogeny of Drosophilinae (Diptera: Drosophilidae), with comments on combined analysis and character support. Mol Phyl Evol. 2002;24:249–264. doi: 10.1016/S1055-7903(02)00226-9. [DOI] [PubMed] [Google Scholar]
- Powell JR, DeSalle R. Drosophila molecular phylogenies and their uses. In: Hecht MK, MacIntyre RJ, Clegg MT, editor. In Evolutionary Biology. Vol. 28. Plenum Press: New York; 1995. pp. 87–138. [Google Scholar]
- Tatarenkov A, Ayala FJ. Phylogenetic relationships among species groups of the virilis-repleta radiation of Drosophila. Mol Phyl Evol. 2001;21:327–331. doi: 10.1006/mpev.2001.1002. [DOI] [PubMed] [Google Scholar]
- O'Grady PM, Kidwell MG. Phylogeny of the subgenus Sophophora (Diptera:Drosophilidae) based on combined analysis of nuclear and mitochondrial DNA sequences. Mol Phyl Evol. 2002;22:442–453. doi: 10.1006/mpev.2001.1053. [DOI] [PubMed] [Google Scholar]
- Reeve EC, Robertson FW. Studies in quantitative inheritance II. Analysis of a strain of Drosophila melanogaster selected for long wings. J Genet. 1953;51:276–316. [Google Scholar]
- Waddington CH. Genetic assimilation of an acquired character. Evolution. 1953;7:118–126. [Google Scholar]
- Houle D, Rowe L. Natural selection in a bottle. Am Nat. 2003;161:50–67. doi: 10.1086/345480. [DOI] [PubMed] [Google Scholar]
- Houle D. Comparing evolvability and variability of quantitative traits. Genetics. 1992;130:195–204. doi: 10.1093/genetics/130.1.195. [DOI] [PMC free article] [PubMed] [Google Scholar]
- Dryden IL, Mardia KV. Statistical Shape Analysis. John Wiley and Sons: Chichester; 1998. [Google Scholar]
- Houle D. Characters as the units of evolutionary change. In: Wagner GP, editor. In The Character Concept in Evolutionary Biology. Academic Press: New York; 2001. pp. 109–140. [Google Scholar]
- Littell RC, Miliken GA, Stroup WW, Wolfinger RD. SAS System for Mixed Models. SAS Institute: Cary, NC; 1996. [Google Scholar]
- SAS Institute . The SAS System for Windows, Release 801. SAS: Cary, NC; 2002. [Google Scholar]
- Drosophila Species Stock Center http://stockcenter.arl.arizona.edu
- Swofford DL. PAUP*: Phylogenetic Analysis Using Parsimony (and Other Methods) Version 40. Sinauer: Sunderland, MA; 2002. http://paup.csit.fsu.edu [Google Scholar]
Associated Data
This section collects any data citations, data availability statements, or supplementary materials included in this article.
Supplementary Materials
Table 2 Description: List of taxa included in the multi-species data set.


