Abstract
Background
Tumor necrosis factor α (TNF) is able to induce a variety of biological responses in the nervous system including inflammation and neuroprotection. Human astrocytoma cells U373 have been widely used as a model for inflammatory cytokine actions in the nervous system. Here we used cDNA microarrays to analyze the time course of the transcriptional response from 1 h up to 12 h post TNF treatment in comparison to untreated U373 cells. TNF activated strongly the NF-κB transcriptional pathway and is linked to other pathways via the NF-κB target genes JUNB and IRF-1. Part of the TNF-induced gene expression could be inhibited by pharmacological inhibition of NF-κB with pyrrolidine-dithiocarbamate (PDTC). NF-κB comprises a family of transcription factors which are involved in the inducible expression of genes regulating neuronal survival, inflammatory response, cancer and innate immunity.
Results
In this study we show that numerous genes responded to TNF (> 880 from 7500 tested) with a more than two-fold induction rate. Several novel TNF-responsive genes (about 60% of the genes regulated by a factor ≥ 3) were detected. A comparison of our TNF-induced gene expression profiles of U373, with profiles from 3T3 and Hela cells revealed a striking cell-type specificity. SCYA2 (MCP-1, CCL2, MCAF) was induced in U373 cells in a sustained manner and at the highest level of all analyzed genes. MCP-1 protein expression, as monitored with immunofluorescence and ELISA, correlated exactly with microarray data. Based on these data and on evidence from literature we suggest a model for the potential neurodegenerative effect of NF-κB in astroglia: Activation of NF-κB via TNF results in a strongly increased production of MCP-1. This leads to a exacerbation of neurodegeneration in stoke or Multiple Sclerosis, presumably via infiltration of macrophages.
Conclusions
The vast majority of genes regulated more than 3-fold were previously not linked to tumor necrosis factor α as a search in published literature revealed. Striking co-regulation for several functional groups such as proteasome and ribosomal proteins were detected.
Background
TNF is a cytokine that is bound to membrane receptors (TNF-Rs) which trimerize upon binding. This provides an intracellular platform for the recruitment of adapter molecules which transmit downstream signals culminating in a transcriptional response [1]. TNF is frequently involved in neural inflammation. Conditions whereas increased amounts of TNF contribute to brain inflammation include infection (meningitis), neurodegenerative diseases such as Alzheimer, Aids dementia complex or Multiple Sclerosis [2]. Moreover TNF itself is produced in glia in response to pro-inflammatory cytokines in type of a feed forward mechanism [3]. Target cells for TNF within the nervous system include neurons and glia. Several reports have described a neuroprotective action of TNF [4]. One of the important signaling pathways triggered by binding of TNF to TNF-receptors (p55 and p75) is the activation of NF-κB [1]. NF-κB is an ubiquitous transcription factor with inducible activity. This factor is crucially involved in regulation of genes relevant in neuronal survival, inflammatory response, cancer and innate immunity [5-7]. NF-κB has been implicated in protective or degenerative pathways, dependent on the stimulus concentration [8] or its nature [9]. The activation of NF-κB is mainly controlled at the posttranscriptional level by complex formation with the inhibitory subunit IκB in the cytoplasm. Activating stimuli (such as TNF) activate a kinase complex composed of two IκB-specific kinases (IKKα and IKKβ) and a modulatory subunit (NEMO or IKKγ). This leads to phosphorylation of the inhibitory subunit, which is then ubiquitinilated and degraded via the proteasome. This triggers translocation of NF-κB into the nucleus, where it initiates transcription by binding to regulatory DNA-sequences [1]. NF-κB is also frequently found in different cells of the nervous system [5]. TNF mediated activation of NF-κB in U373 cells was described [10], a cell line frequently used as a model for inflammatory responses e.g. in Alzheimer disease. Target genes of NF-κB in glia include manganese superoxide dismutase, IκB-α, ICAM-1 and TNF-α [11]. In neurons different target genes such as cyclooxygenase 2 might be regulated by NF-κB [12]. Thus far no systematic analysis of TNF mediated gene expression over time in glia cells has been reported. Here we analyzed the TNF mediated induction of gene expression using microarrays containing 7500 probes for human cDNAs. In order to identify potential NF-κB target genes, we analyzed the influence of pharmacological NF-κB inhibition on TNF mediated gene expression.
Results
TNF regulates IκB-α expression in U373 glioblastoma cells
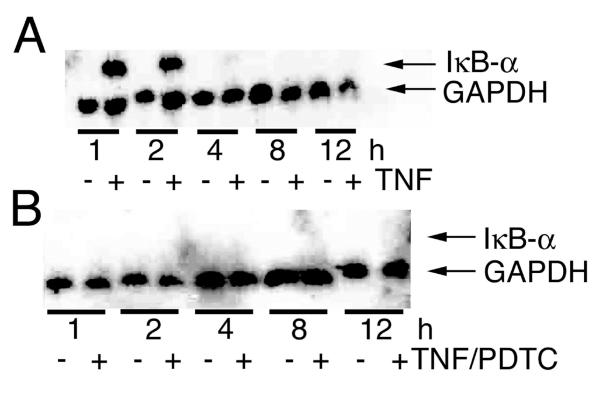
In order to test the feasibility of our approach to induce TNF-responsive genes in U373 cells and to inhibit NF-κB target genes pharmacologically with PDTC, IκB-α expression was analyzed by Northern blotting. U373 cells were treated for up to 12 h with TNF and RNA was isolated at different time points. As expected from data with non-neuronal cells [13], induction of the NF-κB target gene IκB-α was readily detected after 1 h and peaked after 1 h of TNF treatment (Fig. 1a). In accordance with the NF-κB dependent upregulation of IκB-α expression, PDTC pre-treatment blocked the TNF effect on IκB-α expression (Fig. 1B). Furthermore these data can be used as an independent validation of the microarray results.
Figure 1.
Northern Blot analysis of IκB-α in U373 cells after TNF treatment (A) or PDTC and TNF cotreatment (B). U373 cells were stimulated with 10 ng/ml TNF-α for the time indicated. RNA was blotted onto a nylon membrane after gel electrophoresis. Hybridization was done with probes for IκB-α and GAPDH as a loading control. Note that the induction of IκB-α by TNF is blocked by cotreatment with PDTC.
Gene Expression Analysis using DNA microarrays
RNA from TNF-treated or control U373 cells, respectively was isolated. After cDNA synthesis and Cy3 and Cy5 labeling the probes were hybridized on the microarray. Three biological replicas were analyzed for each time point (medians of replicas were used for further analysis). In response to TNF 881 genes exhibited altered RNA levels by a factor of two or more in at least one of the tested time points (Fig. 2). Hierarchical clustering [14] was used to visualize patterns of coregulated genes (Fig. 2). In order to screen for potential NF-κB target genes, cells were pretreated with PDTC. These data were compared to the TNF induction.
Figure 2.
Hierarchical cluster analysis of gene expression in U373 cells after TNF treatment. The Gene expression matrix for the cluster algorithm contains the log-transformed medians of normalized ratios. Upregulated genes are depicted in shades of red, downregulated genes in shades of green. Each row represents the color coded expression of one gene at indicated time points after TNF treatment (columns). Genes with similar expression patterns are clustered together (dendrogram on the right). Clusters selected for further analysis are color coded in the dendrogram on the right. Fold changes, annotation and data used for clustering are presented in supplementary table 1 (supp_table1_cluster).
TNF induced gene expression profiles cluster in different time dependent groups
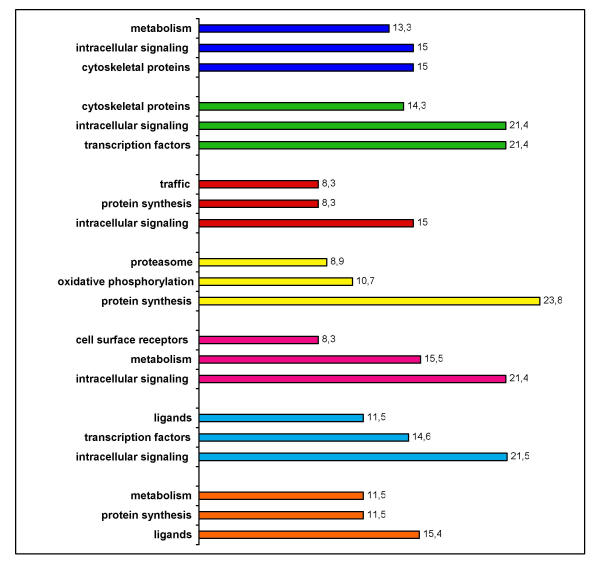
The Eisen matrix primarily visualized an upregulation of genes after TNF treatment (red shades in Fig. 2). Since it is not possible to describe all of the observed changes, a supplementary table (supp_table_1_cluster) is included for further analysis. Clusters containing genes that peaked relatively early were identified (Fig. 2 orange cluster and supp_table_1_cluster). To visualize the composition of different clusters concerning to their cellular role, we used an annotation by functional groups as previously described [15]. Based on this annotation, the orange cluster contains a high number of genes encoding ligands and genes involved in metabolism or protein synthesis (Fig. 3). The highest expression within this cluster depicts genes for the eukaryotic translation initiation factor 3 (EIF3S4 and EIF3S5), followed by the gene for TNF-converting enzyme ADAM17. In addition, this cluster contains cell surface receptors such as the chemokine receptor CCR6 and the Lewis X receptor (SELP), which is an important mediator of cell adhesion in the nervous system. Several secreted receptor ligands, which include known target genes of NF-κB, were also detected. It has been previously reported that TNF induces the expression of the proinflammatory cytokine IL-6 in U373 cells [16]. The brain derived neurotrophic factor (BDNF) was likewise detected. The second cluster we identified contains genes which are induced over a longer time frame (Fig. 2, turquoise cluster). This cluster is dominated by genes involved in intracellular signaling and genes encoding ligands or transcription factors (Fig. 3). Within this cluster are some of the well-known TNF target genes, e.g. constituents of transcription factors: IκB-α and IRF-1 (NFKBIA, IRF1). The data obtained with these two genes can also be used as an independent quality assessment of the reproducibility of the multiple hybridizations. Two independent measurements on the same microarray were available for both genes. The probes for NFKBIA and IRF1 detected nearly identical expression levels throughout the experiments (supp_table_1_cluster, turquoise cluster). This cluster also contains many genes already known to be TNF regulated, such as tumor necrosis factor induced protein 2 (TNFAIP2, B94) [17], IκB-α [13] or VCAM-1 [18]. The latter NF-κB target genes provide an independent validation of our system. Several genes show an early onset of expression, which is maintained during the whole time course. These include the tumor necrosis factor α induced protein 2 (B94), a secreted protein with no homology to other known protein domains, the cell surface protein VCAM-1, and the cytokine MCP-1 (MCAF, SCYA2, CCL2). In addition, several genes not previously described in this context, e.g. phospholamban (PLN) and phosphodiesterase 8a (PDE8A), were detected. Few enzymes involved in metabolism such as the sulfotransferase or carboxypeptidase appeared in this cluster of immediate early genes. Surprisingly few genes directly linked with apoptosis were induced, e.g. the anti-apoptotic cIAP2 BIRC3 (>18x), immediate early response gene 3 (IER3), and the apoptosis antagonizing transcription factor (AATF). Several calcium binding proteins were highly induced, calsequestrin (CASQ2) for example, was induced more than 8-fold. Very high induction rates were detected with probes for ICAM-1 (> 67x) and VCAM (> 48x). Surprisingly the kinetics of the induction of these bona fide NF-κB target genes was slower than expected (peak induction after 4 h).
Figure 3.
Percentage of functional groups in clusters. Genes in clusters were annotated to functional groups. Percentage of the three most abundant groups within genes with annotated functions are depicted. Same color coding is used as in clusters of Fig. 2. Several clusters could be discriminated on the basis of the functional groups.
Cluster 3 (pink) predominantly contains genes that show peak induction after 4 h of TNF treatment. Functional annotation of genes of which the function is known suggest that this cluster is dominated by genes involved in intracellular signaling, metabolism and cell surface receptors (Fig. 3). Most genes within this cluster show a peak of induction at 4 h after TNF treatment. The cluster includes two caspases (CASP4 and CASP7). Other gene products involved in protein processing, such as proteasome mediated degradation, were included in this cluster. Beta-arrestin and numerous genes involved in metabolism such as enzymes (transferases, hydrolases) were grouped in this cluster.
Cluster 4 (yellow) contains genes which show a delayed induction (12 h after initiation of TNF treatment). Functional clustering (Fig. 3) suggests that this cluster is dominated by genes involved in protein synthesis and oxydative phosphorylation, such as NADH dehydrogenase. Similarly many ribosomal proteins such as S3; L27; S30 (FAU) were upregulated. A further important functional group is constituted by gene products involved in protein degradation via the proteasome, such as proteasome subunits 1, 2, 3, 5 and 10. The upregulation of the SUMO activating enzyme may also be relevant in this regard.
Cluster 5 (red) contains many genes whose expression show a biphasic time course. For example the cytokines CCL7 and CCL13 show peaks of induction at 2 h and 12 h. The TNF receptor 10c shows a similar induction pattern, which appears to be a decoy receptor without an intracellular domain. Numerous genes within this cluster encode for proteins responsible for intracellular signaling, protein synthesis and traffic (Fig. 3).
Cluster 6 (green) contains downregulated genes (depicted in shades of green). Functional annotation of genes in this cluster is given in figure 3. Downregulation of genes by a factor of two or more (clusters 6 and 7) was rarer than upregulation (clusters 1–5). Examples of such downregulated genes detected after 1 h of treatment are the intracellular TNF receptor interactor TRADD and the cGMP regulated protein kinase 1 (PRKG1). The observed downregulation was not persistent, and levels around 1 were usually reached within two hours of treatment. Cluster 7 (blue) contains genes which were downregulated after 12 h. The strongest downregulation (nearly ten-fold reduction) was observed with a probe for the cannabinoid receptor 1. Another interesting observation is the downregulation of glucocorticoid receptor expression. This cluster contains a high amount of genes encoding cytoskeletal proteins and genes involved in intracellular signaling (Fig. 3).
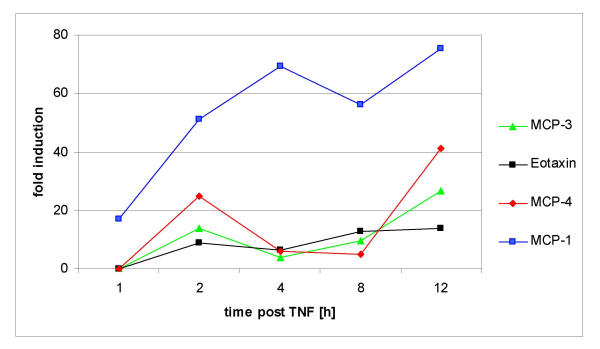
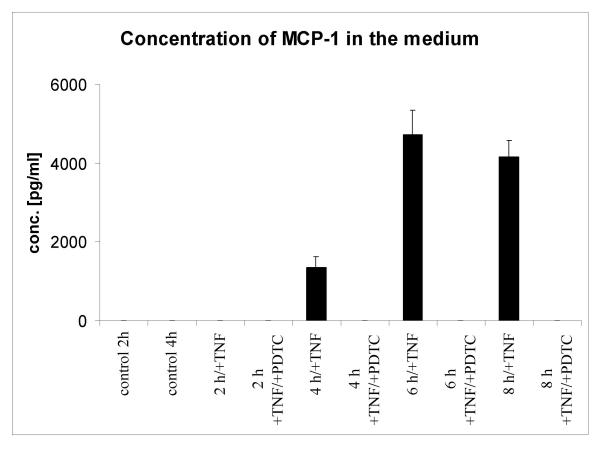
Because the expression of the chemokine monocyte chemoattractant protein 1 (MCP-1) was earlier and more rapid than other chemokines or cytokines (Fig. 4). We analyzed the MCP-1 expression on the protein level. Immunofluorescence analysis of U373 cells treated with TNF revealed a striking upregulation of intracellular MCP-1 (Fig. 5). As expected, strong expression of MCP-1 protein was later (beginning from 4 h after TNF treatment) than observed with the RNA expression. Next we investigated wether MCP-1 secretion in U373 cells is also stimulated by TNF. Analysis of U373 culture supernatants using ELISA revealed an increase of MCP-1 (1360 pg/ml) after 4 h post TNF (Fig. 6), and in higher amounts after 6 h (4720 pg/ml), and after 8 h (4160 pg/ml). MCP-1 levels of control cultures and cultures cotreated with TNF and PDTC were below the detection limit (<15 pg/ml). Thus we conclude that the microarray data can give a valid picture of the protein data. In addition, the inhibiting effects of PDTC on MCP-1 protein secretion were preceded by inhibition of MCP-1 RNA expression as measured on microarrays (see below).
Figure 4.
Time course of MCP-1 expression and other chemokines in U373 cells after TNF exposure at indicated time points (x-axis). Data are shown as medians (fold change) of normalized ratios of three biological replicas (y-axis). Note the sustained MCP-1 expression.
Figure 5.
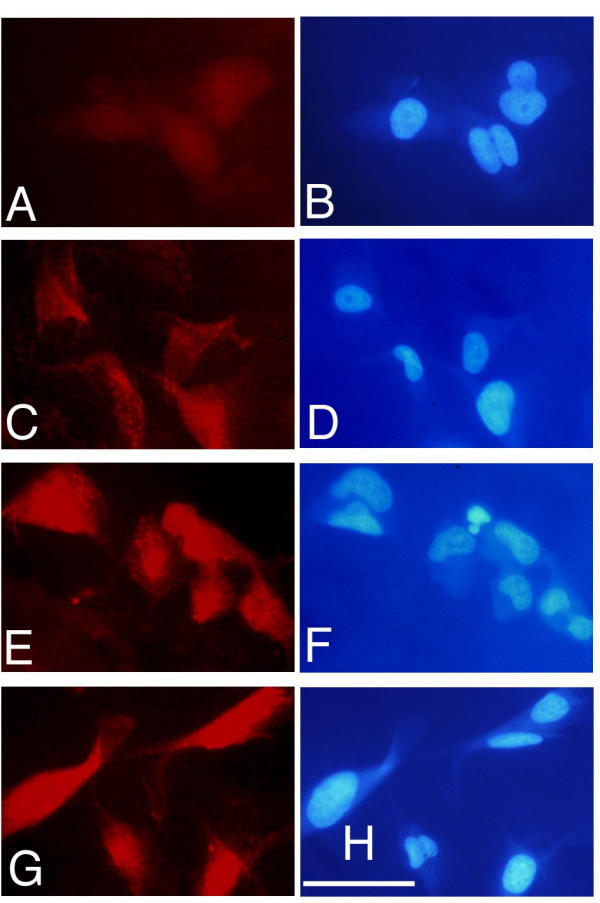
Detection of intracellular MCP-1 protein in U373 cells. Cells were treated with TNF for 0 h (A, B), 2 h (C, D), 4 h (E, F) and 24 h (G, H). Left panels show immunoreactivity of anti-MCP-1 antibody in red. Right panels show nuclear DAPI images. White bar depicts a size of 50 μm.
Figure 6.
MCP-1 ELISA analysis of supernatants of U373 cells. Supernatants of cultured U373 cells treated as indicated were analyzed with ELISA (Chemicon). Data are shown as mean + SEM of four replicates. Detection limit was 15 pg/ml human MCP-1. As compared with untreated cells (control) TNF stimulation resulted in high amounts of secreted MCP-1. PDTC blocks this induction of MCP-1 to a level below the detection limit of the assay (<15 pg/ml).
In order to gain further insight in the signaling cascades involved in TNF-induced transcription a pharmacological inhibition of NF-κB was performed with PDTC. The system was verified initially with Northern blotting (Fig. 1). As expected from the Northern blot data (Fig. 1), microarrays also detected an inhibition by PDTC of TNF induced IκB upregulation. Repressed genes are listed in a supplemantary table (sub_table_3). The expression of MCP-1, IRF1, JunB and IκB-α were inhibited by PDTC after one hour Since these genes are known NF-κB target genes, this is an independent evaluation of our experimental design. Summarily we detected the following known NF-κB target genes in U373 cells: MCP-1, IRF1, NFKBIA, GSTA4, BIRC3, MMP3, TNFRSF10B, DAD1. This specificity of PDTC to known NF-κB target genes might suggest that the other inhibited genes may be novel NF-κB target genes. Surprisingly the expression of the eukaryotic translation initiation factor 3, subunit 4 was also repressed. Furthermore ADAM17 (TACE), the TNF-converting enzyme, glutathione S transferase and importin β3 were also repressed by PDTC after 1 h.
MCP-1, IRF-1, B94, a well known TNF induced gene, and the small inducible cytokine A14 were repressed after 2 h TNF/PDTC treatment. The known NF-κB target gene cIAP2 is also repressed. Several transcription factors are also repressed by PDTC, such as the hypoxia inducible factor HIF-2 (EPAS-1) and the nuclear orphan hormone receptor (NOR-1).
Discussion
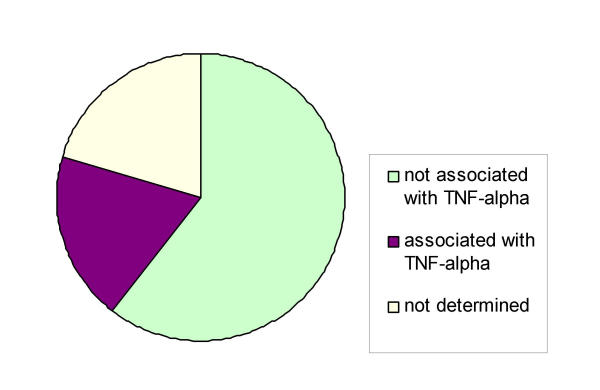
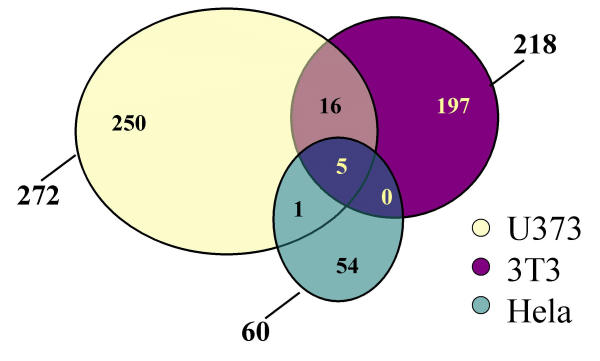
Tumor necrosis factor has pleiotropic effects on different cell types. One of the crucial questions regarding the role of tumor necrosis factor in the nervous system is its neuroprotective or neurodegenerative action. We and others have proposed that a neurodegenerative action of TNF might be linked with the expression of NF-κB target genes in glia [19]. For a better understanding of the TNF actions in glia we used microarrays containing more than 7500 known human genes to analyze the time course of a TNF induced gene expression response. We identified more than 800 genes, the expression of which was up- or downregulated by a factor of two or more. More genes are upregulated than downregulated. We wanted to know which of these genes were already published as TNF-regulated. Two strategies were used to explore this notion. First PubGene queries were made to test for association with TNF (Fig. 7). As a second strategy we compared the results of two microarray studies using TNF treated 3T3 cells [20] and Hela cells [21] with our results. We used the gene symbols of 200 genes that were more than 3-fold regulated to query PubGene [22]. PubGene is a database derived from PubMed; in this database all gene names abbreviations and aliases of a given gene were linked to one gene symbol. This allows an exhaustive literature search using the gene symbol only. The vast majority of all genes which could be queried in the PubGene database showed no previous association with TNF (Fig. 7). This suggests that we have identifed a high degree of new or novel genes induced by TNF. We are aware that this approach might be somewhat limited by the fact that the database omits publications where the gene of study is not mentioned clearly in the abstract. Therefore we additionally compared our data obtained in U373 cells after four hours of TNF induction to published data of 4 h TNF treatment of 3T3 cells [20] and Hela cells [21]. A Venn diagram (Fig. 8) visualizes a surprisingly short list of common TNF-induced genes (Table 1).
Figure 7.
Degree of association with TNF in current literature. Gene symbols were used to query PubGene http://www.PubGene.org. 200 more than 3-fold regulated genes were used (100%).
Figure 8.
Venn diagram of TNF-induced gene expression in three different cell lines. Data obtained after 4 h of TNF treatment were obtained from U373 cells (this study) from 3T3 [20] and Hela [21].
Table 1.
Genes induced by TNF in different cell lines
| U373 AND 3T3 AND Hela | U373 AND 3T3 | U373 AND Hela |
| PSMB8 proteasome (prosome, macropain) subunit, beta type, 8 (large multifunctional protease 7) | BCL3 B-cell leukemia/lymphoma 3 | TNFAIP2 tumor necrosis factor, alpha-induced protein 2 |
| CCL2 chemokine (C-C motif) ligand 2 | BIRC3 baculoviral IAP repeat-containing 3 | |
| NFKBIA nuclear factor of kappa light polypeptide gene enhancer in B-cells inhibitor, alpha | CCL7 chemokine (C-C motif) ligand 7 | |
| TNIP1 TNFAIP3 interacting protein 1 | CHST2 carbohydrate sulfotransferase 2 | |
| NFKB1 nuclear factor of kappa light polypeptide gene enhancer in B-cells 1 (p105) | CSF1 colony stimulating factor 1 (macrophage) | |
| CXCL10 chemokine (C-X-C motif) ligand 10 | ||
| CYP1B1 cytochrome P450, 1b1, benz [a]anthracene inducible | ||
| EMP1 epithelial membrane protein 1 | ||
| IRF1 interferon regulatory factor 1 | ||
| LPL lipoprotein lipase | ||
| MMP3 matrix metalloproteinase 3 | ||
| MX1 myxovirus (influenza virus) resistance 1 | ||
| OSMR oncostatin receptor | ||
| PSMB10 proteasome (prosome, macropain) subunit, beta type 10 | ||
| SLC1A4 solute carrier family 1 (glutamate/neutral amino acid transporter), member 4 | ||
| TNFRSF6 tumor necrosis factor receptor superfamily, member 6 |
One of the genes which displays a striking high level of induction throughout the treatment with TNF is the small inducible cytokine A2 (CCL2), also called monocyte chemoattracting protein (MCP-1) or monocytochemotactic and activating factor. MCP-1 was detected after 1 h of TNF treatment and remained highly induced for up to 12 h. On the other hand induction of MCP-1 by TNF was heavily blunted by treatment with PDTC. This notion prompted us to regard MCP-1 as a potential NF-κB target gene. Indeed MCP-1 was already described as NF-κB target gene in non-neuronal cells [23]. Interestingly a recent study showed a constitutive expression of functional MCP-1 receptor CCR2 on neurons and glia [24]. On the other hand, it was shown that TNF could also induce MCP-1 expression in human and simian astocytes [25]. An important physiological role of MCP-1 can be deduced from the observation that MCP-1 -/- animals show a reduced lesion in an ischemic brain paradigm. Since MCP-1 is in our analysis the chemokine with the highest and longest lasting expression (Fig. 2 and Fig. 4) we propose that MCP-1 expression is one of the main reasons for glial NF-κB dependent neurodegeneration. NF-κB activation might be disease exacerbating in the following models: experimental autoimmune encephalomyelitis (EAE) and brain ischemia. We and others have shown that in EAE NF-κB is activated in glia [26,27]. NF-κB is activated in Multiple Sclerosis also, for which EAE is an experimental animal model [28]. Recently it was shown that NF-κB inhibition with PDTC ameliorates EAE [29]. There is also compelling evidence that MCP-1 is responsible for inflammatory infiltration in MS. Upregulation of MCP-1 was detected in hypertrophic astrocytes of MS lesions [30]. Similarly NF-κB is activated during brain ischemia and its partial repression improves the damage [31]. MCP-1 is highly upregulated during ischemia and upregulation persists for several days [32]. Interestingly the knock out of the NF-κB target gene MCP-1 also ameliorates ischemic damage [33]. Since induced MCP-1 expression is mainly observed in glia and macrophages, a potential neuroprotective strategy involving repression of NF-κB activation might lead to the inhibition of MCP-1 expression. On the other hand MCP-1 might play a role as a signal to induce stem cell homing to the site of injury.
Why have we used PDTC as a NF-κB inhibitor? PDTC was already characterized as a NF-κB inhibitor in U373 cells [16]. PDTC could be used to ameliorate neurological diseases such as EAE (see above). PDTC is currently the only drug for which it was shown that the PDTC induced phenotype corresponds with that of a genetic ablation of NF-κB activation [34].
What might be the reason for a cell type specific TNF response? There are several striking observations where our data can be seen to support the hypothesis of the combinatory nature of gene expression. TNF induced the expression of several transcription factors. IRF1, a known NF-κB target gene, is highly upregulated and is responsible for the cross-coupling of an interferon response with the TNF receptor mediated responses [35]. Another trancription factor with striking regulation is JunD. In non-neuronal cells it was shown that JunD is a NF-κB target gene [36]. The activation of these additional transcription regulators might be responsible for cell type specific differences. In U373 cells we detected some known NF-κB target genes, e.g.: CCL2, IRF1, NFKBIA, GSTA4, BIRC3, MMP3, TNFRSF10B, DAD1 and glutathione S-transferase. Data summarized in the supplemantary table (supp_table_1_cluster) suggest that there are many more. Many ribosomal genes appear to be coordinately coregulated by TNF in U373 cells. Two subunits of initiation factor EIf are also induced. Perhaps these are rescue responses since it is known especially from work with muscle cells that TNF inhibits protein biosynthesis. The physiological outcome of such a suppression of protein synthesis by TNF is seen in cachexia, where muscle protein is degraded due to TNF mediated signal transduction [37].
Conclusion
TNF induces many genes, and expression profiles from different cell types treated with TNF are different. Pharmacological inhibition of NF-κB suggests many novel target genes in glia. MCP-1 expression might a disease exacerbating factor controlled by NF-κB in glia.
Methods
Cell Culture
Human U373 glioblastoma cells (American Type Culture Collection, Rockville, MD, USA) were grown as described [16] in Earle's minimal essential medium (EMEM) containing 10% fetal calf serum, 2% penicillin/streptomycin, 2 mM L-Glutamine, 1% non-essential amino acids and 1 mM sodium-pyruvate. Cultivation was at 37°C and 5% CO2. Treatment was performed on subconfluent plates (ca. 2 × 10⁶ cells per 100 mm tissue culture plate). Medium change was done 24 h before treatment. Cells were treated with TNF-α (Alexis Biochemicals, Grünberg, Germany) at a final concentration of 10 ng/ml for 1 h, 2 h, 4 h, 8 h, 24 h, or left untreated. 24 h before stimulation medium was changed. Pyrrolidine-dithiocarbamate (PDTC, Sigma, Deisenhofen, Germany) was added at a concentration of 0.5 mM 15 min before TNF treatment. Control cultures were treated only with PDTC. RNA was prepared using the Qiagen RNeasy system (Qiagen, Hilden, Germany) according to the manufacturer's protocols. Experimental set-up was as described in [35].
Microarray Procedures
DNA microarray production and analysis of gene expression was performed as established by Pat Brown and co-workers ([38] and [39]). Sequence verified human cDNA clones were annotated using SOURCE [40], and are available from the resource center [41]. The linking of the gene bank accession number to hugo gene names for further annotation was done using the Dragon database [42,43]. Purified PCR products were generated from cDNA clones and spotted onto poly-L-lysine-coated microscopic slides using a custom-made robotic arrayer [44]. The arrayer was equipped with a print head holding 16 quill-type pins (Majer Precision, Tempe, AZ). Printing and post-processing were done as described in the public domain [38]. Briefly, RNA was isolated using the Qiagen RNeasy system (Qiagen, Hilden, Germany). After digestion with DNAse I (RNAse free, Pharmacia, Freiburg, Germany) RNA was converted to cDNA in 25 μl with 3 μl oligo-dT primer (0.5 μg/μl) and 1 μl of a mix of 10 mM aadUTP, 15 mM dTTP, 26 mM dCTP, 25 mM dGTP, 25 mM dATP. Dye coupling and hybridization were done as described [38].
Data Analysis
Data from scanned arrays were obtained using the GenePix software package (Axon Instruments, Union City, CA). The ratios of medians generated by the GenePix software for each gene (spot) were intensity dependent normalized. We used the following criteria to filter the data: spot size ≥ 60 μm, Flag (as in GenePix) = 0, signal to noise ratio in at least one channel ≥ 2.5. The filtered data are provided as a table for further analysis on the author's web page: http://notesweb.uni-wh.de/wg/biowiss/wgbiowiss.nsf/name/kaltschmidt_home-EN.
The gene expression matrix for hierarchical clustering were generated by using a custom database [45,46] (filter: more than two-fold changes in at least one of the tested time points). Prior to clustering, the filtered data were log base 10 transformed. Average linkage hierarchical clustering was applied using the algorithm Cluster, and the results were visualized using a TreeView algorithm [14].
Microarray studies are confronted with issues of multiple statistical testing of large numbers of genes (in the 1000s) in much smaller number of samples (e.g. three per time point). We used two ways to analyze our data set: 1.) An empirically setting of statistical thresholds for fold changes between samples, which is most widely used in published studies (we assumed more than two fold up- or downregulation as significant). 2.) We used as the Null hypothesis the assumption that all genes are not differentially expressed. Thus a normal distribution of log ratios is assumed. After calculation of the mean and standard deviation of ratios a p-value was computed for each ratio. Calculations were performed using Microsoft Excel. P-values are included in the tables.
Immunocytochemistry
U373 cells were cultivated on coverslips. After fixation in 3.7% formaldehyde for 5 min, cells were blocked in 5% goat serum. For immunofluorescence cells were incubated with the primary antibody diluted 1:50 (α-human-MCP-1, Chemicon, Hofheim, Germany). Bound antibodies were detected with an anti-rabbit IgG antibody coupled with FITC (1:1000, Dianova, Hamburg, Germany). Nuclei were stained with DAPI (4',6-Diamidine-2'phenylindole dihydrochloride, Roche, Germany). Microphotographs were taken with a Zeiss Axioskop equipped with epifluorescence. Mounting of colour plates was done on an Apple PowerPC with Adobe Photoshop.
ELISA
MCP-1 was dected by ELISA (Chemicon, Hofheim, Germany). These ELISAs could detect concentrations of MCP-1 as low as 15 pg/ml. Protein concentration was determined by comparison to a standard curve, run in duplicate with each assay.
Authors' contributions
JS, AL, ME, VH, MK, MR, JP, MP, and BK performed the experiments. BK supervised the cell biology work. CK conceived the study and participated in its design and coordination. All authors read and approved the final manuscript.
Supplementary Material
Expression values of U373 cells treated with TNF. Genes with-fold change values greater or equal to 2 or 0.5 were included in the table. Data (medians of biological replicas) used for hierachical clustering (see Fig. 2) and annotated clusters (see Fig. 2) are provided.
Expression values of U373 cells treated with TNF or TNF/PDTC. Normalized ratios of genes for all analyzed arrays were included.
Genes induced by TNF and repressed by co-treatment with PDTC. Genes with-fold change values greater or equal to 4 and repressed by PDTC are shown. '*' p ≤0.05; '**' p ≤0.01
Acknowledgments
Acknowledgement
This work was supported in part by grants from the Deutsche Forschungsgemeinschaft, Fonds der Chemischen Industrie and the Volkswagen-Stiftung.
We thank T. Drell for critical reading of the manuscript.
Contributor Information
Jens Schwamborn, Email: JSchwamborn@yahoo.de.
Antje Lindecke, Email: a_lindecke@uni-wh.de.
Margitta Elvers, Email: m.elvers@uni-wh.de.
Volker Horejschi, Email: horejsch@uni-wh.de.
Martin Kerick, Email: martin.kerick@gmx.net.
Mehran Rafigh, Email: rafigh@gmx.net.
Julia Pfeiffer, Email: juliapf@uni-wh.de.
Maria Prüllage, Email: pruellage@uni-wh.de.
Barbara Kaltschmidt, Email: b.kaltschmidt@uni-wh.de.
Christian Kaltschmidt, Email: c.kaltschmidt@uni-wh.de.
References
- Chen G, Goeddel DV. TNF-R1 signaling: a beautiful pathway. Science. 2002;296:1634–1635. doi: 10.1126/science.1071924. [DOI] [PubMed] [Google Scholar]
- Benveniste EN, Benos DJ. TNF-alpha- and IFN-gamma-mediated signal transduction pathways: effects on glial cell gene expression and function. Faseb J. 1995;9:1577–1584. doi: 10.1096/fasebj.9.15.8529837. [DOI] [PubMed] [Google Scholar]
- Chung IY, Benveniste EN. Tumor necrosis factor-alpha production by astrocytes. Induction by lipopolysaccharide, IFN-gamma, and IL-1 beta. J Immunol. 1990;144:2999–3007. [PubMed] [Google Scholar]
- Mattson MP, Camandola S. NF-kappaB in neuronal plasticity and neurodegenerative disorders. J Clin Invest. 2001;107:247–254. doi: 10.1172/JCI11916. [DOI] [PMC free article] [PubMed] [Google Scholar]
- O'Neill LAJ, Kaltschmidt C. NF-κB: a crucial transcription factor for glial and neuronal cell function. Trends Neurosci. 1997;20:252–258. doi: 10.1016/S0166-2236(96)01035-1. [DOI] [PubMed] [Google Scholar]
- Baldwin AS. Control of oncogenesis and cancer therapy resistance by the transcription factor NF-kappaB. J Clin Invest. 2001;107:241–246. doi: 10.1172/JCI11991. [DOI] [PMC free article] [PubMed] [Google Scholar]
- Ghosh S, Karin M. Missing pieces in the NF-kappaB puzzle. Cell. 2002;109 Suppl:S81–96. doi: 10.1016/s0092-8674(02)00703-1. [DOI] [PubMed] [Google Scholar]
- Kaltschmidt B, Uherek M, Wellmann H, Volk B, Kaltschmidt C. Inhibition of NF-kappaB potentiates amyloid beta-mediated neuronal apoptosis. Proc Natl Acad Sci U S A. 1999;96:9409–9414. doi: 10.1073/pnas.96.16.9409. [DOI] [PMC free article] [PubMed] [Google Scholar]
- Kaltschmidt B, Heinrich M, Kaltschmidt C. Stimulus-dependent activation of NF-kappaB specifies apoptosis or neuroprotection in cerebellar granule cells. Neuromolecular Med. 2002;2:299–309. doi: 10.1385/NMM:2:3:299. [DOI] [PubMed] [Google Scholar]
- Lieb K, Fiebich BL, Schaller H, Berger M, Bauer J. Interleukin-1 beta and tumor necrosis factor-alpha induce expression of alpha 1-antichymotrypsin in human astrocytoma cells by activation of nuclear factor-kappa B. J Neurochem. 1996;67:2039–2044. doi: 10.1046/j.1471-4159.1996.67052039.x. [DOI] [PubMed] [Google Scholar]
- Mattson MP, Culmsee C, Yu Z, Camandola S. Roles of nuclear factor kappaB in neuronal survival and plasticity. J Neurochem. 2000;74:443–456. doi: 10.1046/j.1471-4159.2000.740443.x. [DOI] [PubMed] [Google Scholar]
- Kaltschmidt B, Linker RA, Deng J, Kaltschmidt C. Cyclooxygenase-2 is a neuronal target gene of NF-κB. BMC Mol Biol. 2002;3:16. doi: 10.1186/1471-2199-3-16. [DOI] [PMC free article] [PubMed] [Google Scholar]
- Le Bail O, Schmidt-Ullrich R, Israel A. Promoter analysis of the gene encoding the I kappa B-alpha/MAD3 inhibitor of NF-kappa B: positive regulation by members of the rel/NF-kappa B family. Embo J. 1993;12:5043–5049. doi: 10.1002/j.1460-2075.1993.tb06197.x. [DOI] [PMC free article] [PubMed] [Google Scholar]
- Eisen MB, Spellman PT, Brown PO, Botstein D. Cluster analysis and display of genome-wide expression patterns. Proc Natl Acad Sci U S A. 1998;95:14863–14868. doi: 10.1073/pnas.95.25.14863. [DOI] [PMC free article] [PubMed] [Google Scholar]
- Ivanova NB, Dimos JT, Schaniel C, Hackney JA, Moore KA, Lemischka IR. A stem cell molecular signature. Science. 2002;298:601–604. doi: 10.1126/science.1073823. [DOI] [PubMed] [Google Scholar]
- Lieb K, Kaltschmidt C, Kaltschmidt B, Baeuerle PA, Berger M, Bauer J, Fiebich BL. Interleukin-1 beta uses common and distinct signaling pathways for induction of the interleukin-6 and tumor necrosis factor alpha genes in the human astrocytoma cell line U373. Journal of Neurochemistry. 1996;66:1496–1503. doi: 10.1046/j.1471-4159.1996.66041496.x. [DOI] [PubMed] [Google Scholar]
- Sarma V, Wolf FW, Marks RM, Shows TB, Dixit VM. Cloning of a novel tumor necrosis factor-alpha-inducible primary response gene that is differentially expressed in development and capillary tube-like formation in vitro. J Immunol. 1992;148:3302–3312. [PubMed] [Google Scholar]
- Valentin H, Lemasson I, Hamaia S, Casse H, Konig S, Devaux C, Gazzolo L. Transcriptional activation of the vascular cell adhesion molecule-1 gene in T lymphocytes expressing human T-cell leukemia virus type 1 Tax protein. J Virol. 1997;71:8522–8530. doi: 10.1128/jvi.71.11.8522-8530.1997. [DOI] [PMC free article] [PubMed] [Google Scholar]
- Kaltschmidt B, Kaltschmidt C. NF-κB in the nervous system. In: Beyaert R, editor. Nucelar factor κB. Regulation and Role in Disease. Kluwer Academic Publishers; 2003. pp. 375–394. [Google Scholar]
- Ruan H, Hacohen N, Golub TR, Van Parijs L, Lodish HF. Tumor necrosis factor-alpha suppresses adipocyte-specific genes and activates expression of preadipocyte genes in 3T3-L1 adipocytes: nuclear factor-kappaB activation by TNF-alpha is obligatory. Diabetes. 2002;51:1319–1336. doi: 10.2337/diabetes.51.5.1319. [DOI] [PubMed] [Google Scholar]
- Zhou A, Scoggin S, Gaynor RB, Williams NS. Identification of NF-kappa B-regulated genes induced by TNFalpha utilizing expression profiling and RNA interference. Oncogene. 2003;22:2054–2064. doi: 10.1038/sj.onc.1206262. [DOI] [PubMed] [Google Scholar]
- Jenssen TK, Laegreid A, Komorowski J, Hovig E. A literature network of human genes for high-throughput analysis of gene expression. Nat Genet. 2001;28:21–28. doi: 10.1038/88213. [DOI] [PubMed] [Google Scholar]
- Ueda A, Ishigatsubo Y, Okubo T, Yoshimura T. Transcriptional regulation of the human monocyte chemoattractant protein-1 gene. Cooperation of two NF-kappaB sites and NF-kappaB/Rel subunit specificity. J Biol Chem. 1997;272:31092–31099. doi: 10.1074/jbc.272.49.31092. [DOI] [PubMed] [Google Scholar]
- Banisadr G, Queraud-Lesaux F, Boutterin MC, Pelaprat D, Zalc B, Rostene W, Haour F, Parsadaniantz SM. Distribution, cellular localization and functional role of CCR2 chemokine receptors in adult rat brain. J Neurochem. 2002;81:257–269. doi: 10.1046/j.1471-4159.2002.00809.x. [DOI] [PubMed] [Google Scholar]
- Croitoru-Lamoury J, Guillemin GJ, Boussin FD, Mognetti B, Gigout LI, Cheret A, Vaslin B, Le Grand R, Brew BJ, Dormont D. Expression of chemokines and their receptors in human and simian astrocytes: Evidence for a central role of TNFalpha and IFNgamma in CXCR4 and CCR5 modulation. Glia. 2003;41:354–370. doi: 10.1002/glia.10181. [DOI] [PubMed] [Google Scholar]
- Kaltschmidt C, Kaltschmidt B, Lannes-Vieira J, Kreutzberg GW, Wekerle H, Baeuerle PA, Gehrmann J. Transcription factor NF-kappa B is activated in microglia during experimental autoimmune encephalomyelitis. J Neuroimmunol. 1994;55:99–106. doi: 10.1016/0165-5728(94)90151-1. [DOI] [PubMed] [Google Scholar]
- Bonetti B, Stegagno C, Cannella B, Rizzuto N, Moretto G, Raine CS. Activation of NF-kappaB and c-jun transcription factors in multiple sclerosis lesions. Implications for oligodendrocyte pathology. Am J Pathol. 1999;155:1433–1438. doi: 10.1016/s0002-9440(10)65456-9. [DOI] [PMC free article] [PubMed] [Google Scholar]
- Gveric D, Kaltschmidt C, Cuzner ML, Newcombe J. Transcription factor NF-kappaB and inhibitor I kappaBalpha are localized in macrophages in active multiple sclerosis lesions. J Neuropathol Exp Neurol. 1998;57:168–178. doi: 10.1097/00005072-199802000-00008. [DOI] [PubMed] [Google Scholar]
- Pahan K, Schmid M. Activation of nuclear factor-kB in the spinal cord of experimental allergic encephalomyelitis. Neurosci Lett. 2000;287:17–20. doi: 10.1016/S0304-3940(00)01167-8. [DOI] [PubMed] [Google Scholar]
- McManus C, Berman JW, Brett FM, Staunton H, Farrell M, Brosnan CF. MCP-1, MCP-2 and MCP-3 expression in multiple sclerosis lesions: an immunohistochemical and in situ hybridization study. J Neuroimmunol. 1998;86:20–29. doi: 10.1016/S0165-5728(98)00002-2. [DOI] [PubMed] [Google Scholar]
- Schneider A, Martin-Villalba A, Weih F, Vogel J, Wirth T, Schwaninger M. NF-kappaB is activated and promotes cell death in focal cerebral ischemia. Nat Med. 1999;5:554–559. doi: 10.1038/6458. [DOI] [PubMed] [Google Scholar]
- Wang X, Yue TL, Barone FC, Feuerstein GZ. Monocyte chemoattractant protein-1 messenger RNA expression in rat ischemic cortex. Stroke. 1995;26:661–665. doi: 10.1161/01.str.26.4.661. [DOI] [PubMed] [Google Scholar]
- Hughes PM, Allegrini PR, Rudin M, Perry VH, Mir AK, Wiessner C. Monocyte chemoattractant protein-1 deficiency is protective in a murine stroke model. J Cereb Blood Flow Metab. 2002;22:308–317. doi: 10.1097/00004647-200203000-00008. [DOI] [PubMed] [Google Scholar]
- Hu Y, Baud V, Oga T, Kim KI, Yoshida K, Karin M. IKKalpha controls formation of the epidermis independently of NF-kappaB. Nature. 2001;410:710–714. doi: 10.1038/35070605. [DOI] [PubMed] [Google Scholar]
- Kumar-Sinha C, Varambally S, Sreekumar A, Chinnaiyan AM. Molecular cross-talk between the TRAIL and interferon signaling pathways. J Biol Chem. 2002;277:575–585. doi: 10.1074/jbc.M107795200. [DOI] [PubMed] [Google Scholar]
- Li X, Massa PE, Hanidu A, Peet GW, Aro P, Savitt A, Mische S, Li J, Marcu KB. IKKalpha, IKKbeta, and NEMO/IKKgamma are each required for the NF-kappa B-mediated inflammatory response program. J Biol Chem. 2002;277:45129–45140. doi: 10.1074/jbc.M205165200. [DOI] [PMC free article] [PubMed] [Google Scholar]
- Tracey KJ. Lethal weight loss: the focus shifts to signal transduction. Sci STKE. 2002;2002:PE21. doi: 10.1126/stke.2002.130.pe21. [DOI] [PubMed] [Google Scholar]
- http://www.microarrays.org
- Eisen MB, Brown PO. DNA arrays for analysis of gene expression. Methods Enzymol. 1999;303:179–205. doi: 10.1016/s0076-6879(99)03014-1. [DOI] [PubMed] [Google Scholar]
- Diehn M, Sherlock G, Binkley G, Jin H, Matese JC, Hernandez-Boussard T, Rees CA, Cherry JM, Botstein D, Brown PO, Alizadeh AA. SOURCE: a unified genomic resource of functional annotations, ontologies, and gene expression data. Nucleic Acids Res. 2003;31:219–223. doi: 10.1093/nar/gkg014. [DOI] [PMC free article] [PubMed] [Google Scholar]
- RZP resource center http://www.rzpd.de
- Bouton CM, Pevsner J. DRAGON: Database Referencing of Array Genes Online. Bioinformatics. 2000;16:1038–1039. doi: 10.1093/bioinformatics/16.11.1038. [DOI] [PubMed] [Google Scholar]
- Dragon Database http://pevsnerlab.kennedykrieger.org/dragon.htm
- Mguide http://cmgm.stanford.edu/pbrown/mguide/
- Lehnen D, Blumer C, Polen T, Wackwitz B, Wendisch VF, Unden G. LrhA as a new transcriptional key regulator of flagella, motility and chemotaxis genes in Escherichia coli. Mol Microbiol. 2002;45:521–532. doi: 10.1046/j.1365-2958.2002.03032.x. [DOI] [PubMed] [Google Scholar]
- Polen T, Rittmann D, Wendisch VF, Sahm H. DNA Microarray Analyses of the Long-Term Adaptive Response of Escherichia coli to Acetate and Propionate. Appl Environ Microbiol. 2003;69:1759–1774. doi: 10.1128/AEM.69.3.1759-1774.2003. [DOI] [PMC free article] [PubMed] [Google Scholar]
Associated Data
This section collects any data citations, data availability statements, or supplementary materials included in this article.
Supplementary Materials
Expression values of U373 cells treated with TNF. Genes with-fold change values greater or equal to 2 or 0.5 were included in the table. Data (medians of biological replicas) used for hierachical clustering (see Fig. 2) and annotated clusters (see Fig. 2) are provided.
Expression values of U373 cells treated with TNF or TNF/PDTC. Normalized ratios of genes for all analyzed arrays were included.
Genes induced by TNF and repressed by co-treatment with PDTC. Genes with-fold change values greater or equal to 4 and repressed by PDTC are shown. '*' p ≤0.05; '**' p ≤0.01


