

Abstract
Many epidemiological studies have shown that parents, siblings and offspring of long-lived subjects have a significant survival advantage when compared with the general population. However, how much of this reported advantage is due to common genetic factors or to a shared environment remains to be resolved.
We reconstructed 202 families of nonagenarians from a population of southern Italy. To estimate the familiarity of human longevity, we compared survival data of parents and siblings of long-lived subjects to that of appropriate Italian birth cohorts. Then, to estimate the genetic component of longevity while minimizing the variability due to environment factors, we compared the survival functions of nonagenarians' siblings with those of their spouses (intrafamily control group).
We found that both parents and siblings of the probands had a significant survival advantage over their Italian birth cohort counterparts. On the other hand, although a substantial survival advantage was observed in male siblings of probands with respect to the male intrafamily control group, female siblings did not show a similar advantage. In addition, we observed that the presence of a male nonagenarians in a family significantly decreased the instant mortality rate throughout lifetime for all the siblings; in the case of a female nonagenarians such an advantage persisted only for her male siblings.
The methodological approach used here allowed us to distinguish the effects of environmental and genetic factors on human longevity. Our results suggest that genetic factors in males have a higher impact than in females on attaining longevity.
Keywords: human longevity, genetic component, inheritance, familial determinants
Introduction
In the last decade many epidemiological studies on human longevity have shown that parents, siblings and offspring of long-lived subjects have a significant survival advantage compared with the general population in attaining longevity.1, 2, 3, 4, 5, 6, 7, 8, 9, 10, 11 Although these studies do not distinguish between shared environmental and genetic factors, twin data suggest that genes may have a modest role in achieving longevity.12, 13 In order to better distinguish the effect of genes from the effect of shared familial environment, Schoenmaker et al3 analyzed the survival data of the spouses of long-lived subjects as an additional control group. They found that members of this control group, who shared most of their adult life with the long-lived partner, did not show any advantage/benefit in terms of survival, suggesting that a substantial contribution in the familiarity of human longevity is attributable to genetic factors. However, as a complex trait, the heritability of ‘lifespan' may be influenced by an interplay of genetic, environmental and stochastic factors.14, 15 In addition, the influence of the genetic component on lifespan is expected to be stronger in populations of areas where environmental factors are harsher16 as demonstrated in different studies.9, 17, 18
Calabria is one of the poorest Italian regions located in the southern part of the peninsula. In the present study we aimed (i) to estimate the familial component of human longevity in Calabrian population; (ii) to uncouple within such a familial component the genetic from the environmental component. For these purposes, we reconstructed 202 pedigrees of Calabrian families where at least one nonagenarian individual was present. In order to estimate the presence of a familial component of longevity, we compared the survival data of parents and siblings of long-lived subjects with appropriate Italian birth cohorts. Then, to minimize the variability of familial environmental factors, we compared the survival functions of long-lived siblings with those of their spouses (intrafamily control group). This approach allowed us to estimate how much of the familiarity of the analyzed phenotype is due to genetics.
Materials and methods
Our sample consisted of the members of 202 families identified in seven municipalities (Bisignano, Cariati, Cosenza, Luzzi, Montalto Uffugo, Rende, and Rose) of Calabria (southern Italy). Each municipality was contacted in 2006 and invited to send a list of subjects living in their territory born in 1916 or before (probands). In total, 1475 eligible probands were identified. In the present study, which started in October 2008, we reconstructed the family pedigree of 202 probands.
Age validation
For complete age validation of long-lived individuals, their parents, siblings and the long-lived spouses of siblings, the following documents were examined: the birth certificate, marriage certificate(s), the population registry (Anagrafe) personal sheet, the birth certificate of both parents (except for non-related parents) and death certificates. In addition, in order to further confirm the completeness of the reconstructed pedigrees, specialized personnel contacted a relative (usually a child or nephew/niece) for each proband whose genealogical tree had been reconstructed to verify information regarding the name(s), places and dates of birth, marriage, death, and emigration of the parents, all siblings and their spouses of the long-living probands.
Statistical analyses
As we focused on the mortality and survivorship of their parents and siblings, the probands were not included in the analysis described here. Because of our interest in longevity, we examined the survival patterns of the parents and siblings of the probands conditional on survival to age 30. We chose age 30 as a cutoff because siblings who died at younger ages probably did so because of stochastic, non-heritable factors (eg, infectious diseases, accidents, violence).4, 9 This minimizes the effect of such errors on cumulative survival probability.
In order to verify whether parents of probands lived longer than expected, we compared their life span with that of their respective Italian birth cohort. We first estimated the mean age at death of proband's parents conditional on survival to age 30. All parents had died, and thus their survival experience was complete. Following Perls et al,19 we then matched each participant by year of birth and sex with their respective Italian cohort to obtain life expectancies conditional on survival to age 30. For the Italian population, sex-specific life tables are available from the Human Mortality Database (HMD) with the percentages of death for each year of age in the range of 0–100 years and each birth year since 1872 (http://www.mortality.org). The weighted average of these cohort-specific estimates was then compared with the corresponding estimates obtained for the parents of the probands.
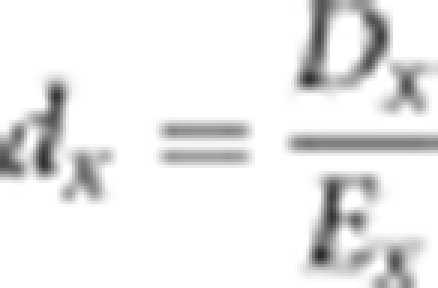
Death rates for siblings and their spouses were computed, separately, from tabulations by age of sibling deaths and censored observations. Both the death counts and exposure estimates were aggregated in 5-year age groups. Standard demographic methods were used to calculate the mortality rate and its variance. Death rates, dx, were computed as the ratio of deaths, Dx, over the exposure-to-risk Ex in a given age group:
 |
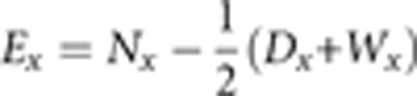
Ex was calculated as the number of sibling survivors at the beginning of an age interval, Nx, minus half of the deaths, Dx, and censorings, Wx, during the interval:
 |
The variance of the estimated mortality rate was calculated according to Poisson distribution.20
The survival rate for interval x was computed as following:
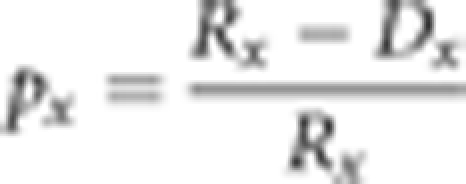 |
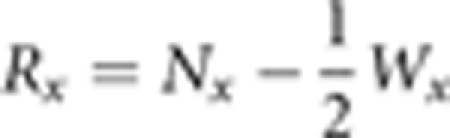
The risk-set Rx equaled the number of sibling survivors at the beginning of an age interval, minus half of the censorings over that interval:
 |
The survival curves, Sx, were computed as Sx=p0p1…px−1.
Standard errors for sibling survival probabilities were calculated based on an assumption of binomial variability (conditional on the observed collection of Rx values) using Greenwood's formula.21 The obtained survival curves were then compared by log-rank test.
In order to investigate whether proband siblings had lower mortality and higher probability of surviving at advanced ages, siblings survival curves were compared with (i) the corresponding survival curves of the 1910 birth cohort for the general Italian population (the average year of birth for siblings was 1911) and (ii) the survival curves of their spouses (intrafamily control group). In this case, as survival experiences of proband siblings were not complete (some were still alive at the time of the study) the approach used for the parents of the probands was not applicable. To bypass this problem, we used an approach widely applied in other studies1, 9 that is, to define a ‘control group' by determining the mean year of birth of the siblings of the probands. Then, we compared their survival experience with respect to those of the Italian birth cohort of such year. Survival data from the 1910 cohort were derived from the HMD. As in the previous case, survival probabilities were conditional on survival to age 30. The siblings of the probands and their respective spouses who emigrated from Italy were excluded from the study and their immigration periods were used as censoring dates. The exclusion circumvented the introduction of a bias due to the effect exerted on the phenotype by the ‘new' environment in which they went to live.
In order to quantify the survival advantage due to a presence of a long-lived individual in the reconstructed family, the siblings' hazard function was compared with those of their spouses using a Cox regression model.22 In this model ‘relationship to the proband', ‘gender of the sibling/spouse' and their interaction were used as explanatory covariates.
Results
Table 1 reports a descriptive analysis of the subjects analyzed for this study. Of the 202 probands (126 women and 76 men), 129 were deceased (63.9%) at the time of this analysis and 73 (36.1%) were alive. The probands had a median of six siblings with a range of 1–13. A total of 1160 siblings, 593 men and 567 women, were identified for the analysis. Of these, 90 (15.2%) males and 105 (18.5%) females died in childhood (0–10 years of age). Of the remaining, at the time of data collection 63 (12.5%) male and 68 (14.7%) female siblings were still alive. These and siblings who migrated produced a total of 179 (18.5%) censored observations. In addition, a total of 669 non-related individuals (spouses of siblings, 298 men and 371 women) were identified for the same analysis. At the time of data collection, 18 (6.0%) male spouses and 90 (24.3%) female spouses were still alive. These and siblings' spouses who migrated outside of Italy gave a total of 128 (19.1%) censored observations. In the case of the siblings, early childhood mortality was included, hence the relatively large difference in number of deceased vs deceased ≥30.
Table 1. Characteristics of the subjects (belonging to 202 families) analyzed in the study. Median age and interquartile range are displayed.
| Men | Women | |||
|---|---|---|---|---|
| N | Age | N | Age | |
| Parents of proband | ||||
| Deceased | 167a | 77.5 (68–85) | 157b | 79 (70–86) |
| Deceased (≥30 years) | 166 | 78 (68–85) | 157 | 79 (70–86) |
| Sibling | ||||
| Alive | 63c | 85 (81–89) | 68c | 86 (81–90) |
| Deceased | 450 | 73 (33.75–82) | 481 | 74 (22.5–85) |
| Deceased (≥30 years) | 384 | 78 (68–84) | 355 | 81 (71–86) |
| Proband sibling's spousesd | ||||
| Alive | 18c | 84 (82–87.5) | 90c | 82.5 (77–87) |
| Deceased | 272 | 75 (64–82) | 269 | 79 (71–85) |
| Deceased (≥30 years) | 270 | 75 (64.75–82) | 267 | 79 (71–85) |
| 1910 Italian birth cohort | ||||
| Life expectancy at birth | 49.33 | 54.52 | ||
| Life expectancy conditional on survival to age 30 years | 71.12 | 78.15 | ||
33 fathers had unknown age at death.
43 mothers had unknown age at death.
Censored for immigration not included.
Calculations include only the first spouse.
The average year of birth of the probands was 1910 and for their siblings the average was 1911. With regard to parent's data, for 43 mothers and 33 fathers information on age at death were unknown. The average year of birth for fathers was 1876 and for mothers 1882.
Median ages at death for fathers and mothers of the probands were 77.5 and 79 years, respectively. Excluding deaths which occurred before age 30, the median age at death of the siblings of probands was higher than those observed in the relevant spouses (78 years in male siblings of probands vs 75 of the male spouses; 81 years in female siblings of probands vs 79 of the female spouses).
Table 2 shows the results for comparisons of mean ages at death of the proband's parents with the corresponding estimates for Italian birth cohort conditioned on survival to the age of 30 years. The mean age at death of the father's of probands was about 75 years. These estimates were substantially higher than the corresponding estimates for the respective Italian birth cohorts. In fact, the mean age at death was about 11% higher (8.05 years, P<0.001) when compared with the relevant Italian birth cohorts.
Table 2. Comparisons of mean ages at death (SE in parenthesis) conditioned on survival to age 30 of parents of probands with the respective Italian birth cohort, birth years 1876 for fathers, 1882 for mothers.
| Parents of probands | Mean age at death by sex conditional on survival to age 30 | Italian cohort life tablesa | Excess years | P-valueb |
|---|---|---|---|---|
| Men (N=166) | 75.49 (0.98) | 67.44 | 8.05 | <0.001 |
| Women (N=157) | 76.06 (1.10) | 70.78 | 5.28 | <0.001 |
Note: source, Human Mortality Database: http://www.mortality.org; calculations by the authors.
Life expectancy at birth conditioned on survival to age 30 for the Italian birth cohort. Cohort life table estimates were assumed to have zero variance.
P-value refers to t-Student's test.
Figure 1 shows the survival curves obtained for the siblings of the probands and the 1910 Italian birth cohort. Both curves are conditioned for survival to the age of 30 years, as reported in Materials and Methods. Although the 1910 Italian birth cohort is not totally extinguished, Figure 1 shows the presence of a substantial survival advantage, which is more evident in male siblings (P<0.001) than in females (P=0.01).
Figure 1.

Survival probabilities from age 30 for siblings of probands with respect to the Italian 1910 cohort by gender.
Figure 2 compares the survival curves of the siblings of probands with those of their spouses. A substantial survival advantage is observed in male siblings of probands with respect to the male spouses (P<0.001). This is not true for women (P=0.950). In both genders the chances of survival for the two groups does not differ substantially during early adulthood. However, after the age of 50, the survival patterns begin to diverge in favor of male siblings with respect to the intrafamily control group, revealing a significant gap, which becomes more evident at very old ages.
Figure 2.

Survival probabilities from age 30 for siblings of probands with respect to the relevant intrafamily control group.
In order to quantify the survival advantage due to a presence of a long-lived subject in the family, the siblings' hazard function was compared with those of their spouses by means of a Cox regression model. In this model, ‘relationship to the proband', ‘gender of the sibling/spouse' and their interaction were used as explanatory covariates. In Table 3, the maximum likelihood estimation of the parameters of this model and the hazard ratio (HR) for mortality risk are reported. From this model, a significant survival advantage for male siblings of probands is shown. In fact, they have a substantial mortality reduction of about 28% (e−0.005−0.325) when compared with the spouses of female siblings (HR=0.719). Also adjusting for cohort effect (by inserting the year of birth of siblings/spouses as adjunctive covariate in the model) this reduction remained almost constant (data not shown).
Table 3. Maximum likelihood estimation of the parameters of the fitted Cox proportional hazards model.
| 95% CI for HR | |||||||
|---|---|---|---|---|---|---|---|
| Variables | Coefficient (β) | SE | Wald | P-value* | HR | Lower | Upper |
| Relation to the proband=sibling | −0.005 | 0.081 | 0.003 | 0.953 | 0.995 | 0.849 | 1.167 |
| Gender of the sibling/spouse=female | 0.521 | 0.087 | 36.260 | 0.000 | 1.684 | 1.422 | 1.996 |
| Relation to the proband*, gender of the sibling/spouse | −0.325 | 0.114 | 8.182 | 0.004 | 0.723 | 0.578 | 0.903 |
Abbreviations: CI, confidence interval; HR, hazard ratio.
SE of the estimated coefficients with the relevant HR and CI of the model are reported.
*P-values refer to the Wald tests.
In order to further investigate whether the sex of the proband had an effect on the survival probabilities of their siblings, we split the data set according to the sex of the proband. In 76 out of 202 families the sex of the proband was male. Figures 1 and 2 of the Supplementary Material show the survival curves of the siblings of probands and those of their spouses according to the sex of the proband. When the sex of the proband was male (Supplementary Figure 1), both male and female siblings had a survival advantage with respect to their spouses (P=0.029 for males; P=0.037 for females). When only families with a female proband were analyzed (Supplementary Figure 2), only male siblings showed a survival advantage with respect to the intrafamily control group (P=0.007). Parallel results were obtained by Cox regression analysis (see Table 4). In fact, siblings of male probands had a mortality reduction of about 23% with respect to their spouses (HR=0.772; P=0.004). On the contrary, when the sex of the proband was female, only male siblings showed such a survival advantage. In fact the interaction term of the correspondent model indicated that male siblings had a significant mortality reduction of about 30% (e0.144−0.494).
Table 4. Maximum likelihood estimation of the parameters for the Cox regression models with respect to the sex of the proband.
| Variables | Coefficient (β) | SE | Wald | P-value* | HR | 95% CI for HR |
|---|---|---|---|---|---|---|
| (a) Sex of the proband=female | ||||||
| Relation to the proband=sibling | 0.144 | 0.104 | 1.902 | 0.168 | 1.155 | 0.941–1.417 |
| Gender of the sibling/spouse=female | 0.691 | 0.113 | 37.178 | <0.001 | 1.996 | 1.598–2.492 |
| Relation to the proband *, gender of the sibling/spouse | −0.494 | 0.147 | 11.305 | 0.001 | 0.610 | 0.458–0.814 |
| (b) Sex of the proband=malea | ||||||
| Relation to the proband=sibling | −0.258 | 0.090 | 8.165 | 0.004 | 0.772 | 0.647–0.922 |
| Gender of the sibling/spouse=female | 0.254 | 0.090 | 8.035 | 0.005 | 1.289 | 1.082–1.537 |
Abbreviations: CI, confidence interval; HR, hazard ratio.
SE of the estimated coefficients with the relevant HR and CI of the model are reported.
The interaction term was not significant (β=−0.092; P=0.607; HR=0.912 with a CI=0.641–1.297).
*P-values refer to the Wald tests.
It is of note that, although life tables show that women live longer than males (about 5 years), none of the results obtained here differed if we considered different cut offs (between 91 and 99) to define female probands.
Discussion
For years, the reduced mortality of family members of centenarians has suggested the presence of a genetic component in the longevity trait. However it has always been very clear to scientists studying this issue that environmental and familiar factors (such as economic and social status) could influence the probability of attaining longevity together with genetics. In addition, it is well known that the heritability of a trait is population specific, as it may be influenced by different factors acting differently on certain traits in different populations. This is probably particularly true for longevity, which is increasing due to environmental factors (better food, better medical assistance and so on) across western countries but at different speeds. It is then likely that the importance of genetics on longevity may be higher in areas with slower yet more recent progress (such as Calabria and Sardinia) than in other areas of Western Countries.17, 18 Finally, many cues support the hypothesis that the heritability of longevity might be higher in males than in females.
The present study has confirmed the presence of a strong familiar component on longevity. In fact both the parents and the siblings (either females and males) of long-lived probands were found to live longer than the general contemporary population. On the other hand, the comparison of survival curves of the siblings of nonagenarians with those of their spouses (which are genetically unrelated but share a great part of their environment) shows a slightly different picture. In fact, we found that brothers of nonagenarians lived significantly longer than the husbands of their sisters. By contrast, no difference could be detected between survival curves of sisters of nonagenarians and the survival curves of the wives of their brothers, suggesting that the heritability of longevity is higher in males than in females. This is further reinforced by the subsequent observation that the siblings of male probands (either males or females) show a reduced mortality than their spouses. By contrast, when we analyzed the siblings of female probands we found that only their brothers had a lower mortality when compared with the male spouses. This result suggests that, independently of gender, family members with a male proband share, on average, a significant genetic advantage. On the other hand, in the sibships with a female proband, the genetic share of the familial advantage is on average lower, and the female spouses of brothers of nonagenarians benefit most from the familial advantage. These results confirm that longevity has a genetic component, and suggest that such a component is stronger in males than in females. On the other hand, they also suggest that females can take advantage of a favorable environment more than males. In fact, we may state that, according to our data, being the sister of a long-lived subject or marrying one of the brothers of this subject provides a woman almost with the same survival advantage.
It is certainly important to outline some limitations of the study. First of all it is important to point out that our results may be in part specific to a largely rural and underdeveloped society where social differences are very strong, especially until a few decades ago.23 In fact, in contrast to the study of Shoenmaker et al,3 spouses of proband's siblings also live longer than the corresponding birth cohort. It is also worth mentioning that males in these cohorts may have taken advantages of their families more than their sisters in terms of wealth and social benefits. Indeed, we previously showed that only a very small percentage of women born around the beginning of the XX century were properly scholarized.23 This may partly explain the small excess in survival of sisters over the wives of the brothers or over the birth cohort as compared with the same groups in men.
In addition we need to point out that we used life tables referring to the 1910 Italian birth cohort as for that period they are not available for the Calabrian population alone. Calabrian life tables from 1940s onward do not show significant differences with respect to the average Italian mortality data. However, we may suppose that, based on its socio economic conditions,24 life expectancy in Calabria at the beginning of the XX century was lower than in the rest of Italy, where, on turn, it was lower than in northern European countries.25 Therefore we can expect that this point does not affect our results or led to an underestimate of survival advantage with respect to the general population cohorts. On the other hand, our results are in agreement with numerous demographic reports showing that in the last decades, where medical and social conditions have greatly improved, the increase in the number of female centenarians in Europe has been by far faster than the increase of male centenarians.26
Acknowledgments
The study was supported by Fondi di ateneo (ex 60%). The support of the municipalities (Bisignano, Cariati, Cosenza, Luzzi, Montalto Uffugo, Rende, and Rose) and of their officers is warmly acknowledged.
The authors declare no conflict of interest.
Footnotes
Supplementary Information accompanies the paper on European Journal of Human Genetics website (http://www.nature.com/ejhg)
Supplementary Material
References
- Perls TT, Bubrick E, Wager CG, Vijg J, Kruglyak L. Siblings of centenarians live longer. Lancet. 1998;351:1560. doi: 10.1016/S0140-6736(05)61126-9. [DOI] [PubMed] [Google Scholar]
- Atzmon G, Rincon M, Rabizadeh P, Barzilai N. Biological evidence for inheritance of exceptional longevity. Mech Ageing Dev. 2005;126:341–345. doi: 10.1016/j.mad.2004.08.026. [DOI] [PubMed] [Google Scholar]
- Schoenmaker M, de Craen AJ, de Meijer PH, et al. Evidence of genetic enrichment for exceptional survival using a family approach: the Leiden Longevity Study. Eur J Hum Genet. 2006;14:79–84. doi: 10.1038/sj.ejhg.5201508. [DOI] [PubMed] [Google Scholar]
- Perls TT, Wilmoth J, Levenson R, et al. Life-long sustained mortality advantage of siblings of centenarians. Proc Natl Acad Sci USA. 2002;99:8442–8447. doi: 10.1073/pnas.122587599. [DOI] [PMC free article] [PubMed] [Google Scholar]
- Gudmundsson H, Gudbjartsson DF, Frigge M, Gulcher JR, Stefansson K. Inheritance of human longevity in Iceland. Eur J Hum Genet. 2000;8:743–749. doi: 10.1038/sj.ejhg.5200527. [DOI] [PubMed] [Google Scholar]
- Kerber RA, O'Brien E, Smith KR, Cawthon RM. Familial excess longevity in Utah genealogies. J Gerontol A Biol Sci Med Sci. 2001;56:B130–B139. doi: 10.1093/gerona/56.3.b130. [DOI] [PubMed] [Google Scholar]
- Terry DF, Wilcox M, McCormick MA, Lawler E, Perls TT. Cardiovascular advantages among the offspring of centenarians. J Gerontol A Biol Sci Med Sci. 2003;58:M425–M431. doi: 10.1093/gerona/58.5.m425. [DOI] [PubMed] [Google Scholar]
- Terry DF, Wilcox MA, McCormick MA, et al. Lower all-cause, cardiovascular, and cancer mortality in centenarians' offspring. J Am Geriatr Soc. 2004;52:2074–2076. doi: 10.1111/j.1532-5415.2004.52561.x. [DOI] [PubMed] [Google Scholar]
- Willcox BJ, Willcox DC, He Q, Curb JD, Suzuki M. Siblings of Okinawan centenarians share lifelong mortality advantages. J Gerontol A Biol Sci Med Sci. 2006;61:345–354. doi: 10.1093/gerona/61.4.345. [DOI] [PubMed] [Google Scholar]
- Atzmon G, Schechter C, Greiner W, Davidson D, Rennert G, Barzilai N. Clinical phenotype of families with longevity. J Am Geriatr Soc. 2004;52:274–277. doi: 10.1111/j.1532-5415.2004.52068.x. [DOI] [PubMed] [Google Scholar]
- Cournil A, Legay JM, Schachter F. Evidence of sex-linked effects on the inheritance of human longevity: a population-based study in the Valserine valley (French Jura), 18–20th centuries. Proc Biol Sci. 2000;267:1021–1025. doi: 10.1098/rspb.2000.1105. [DOI] [PMC free article] [PubMed] [Google Scholar]
- Herskind AM, McGue M, Holm NV, Sorensen TI, Harvald B, Vaupel JW. The heritability of human longevity: a population-based study of 2872 Danish twin pairs born 1870–1900. Hum Genet. 1996;97:319–323. doi: 10.1007/BF02185763. [DOI] [PubMed] [Google Scholar]
- Ljungquist B, Berg S, Lanke J, McClearn GE, Pedersen NL. The effect of genetic factors for longevity: a comparison of identical and fraternal twins in the Swedish Twin Registry. J Gerontol A Biol Sci Med Sci. 1998;53:M441–M446. doi: 10.1093/gerona/53a.6.m441. [DOI] [PubMed] [Google Scholar]
- Vaupel JW, Carey JR, Christensen K, et al. Biodemographic trajectories of longevity. Science. 1998;280:855–860. doi: 10.1126/science.280.5365.855. [DOI] [PubMed] [Google Scholar]
- Kirkwood TB.Time of our lives. What controls the length of life EMBO Rep 20056Spec no:S4–S8. [DOI] [PMC free article] [PubMed] [Google Scholar]
- Yashin AI, Ukraintseva SV, De Benedictis G, et al. Have the oldest old adults ever been frail in the past? A hypothesis that explains modern trends in survival. J Gerontol A Biol Sci Med Sci. 2001;56:B432–B442. doi: 10.1093/gerona/56.10.b432. [DOI] [PubMed] [Google Scholar]
- Montesanto A, Passarino G, Senatore A, Carotenuto L, De Benedictis G. Spatial analysis and surname analysis: complementary tools for shedding light on human longevity patterns. Ann Hum Genet. 2008;72:253–260. doi: 10.1111/j.1469-1809.2007.00405.x. [DOI] [PubMed] [Google Scholar]
- Poulain M, Pes GM, Grasland C, et al. Identification of a geographic area characterized by extreme longevity in the Sardinia island: the AKEA study. Exp Gerontol. 2004;39:1423–1429. doi: 10.1016/j.exger.2004.06.016. [DOI] [PubMed] [Google Scholar]
- Perls T, Kohler IV, Andersen S, et al. Survival of parents and siblings of supercentenarians. J Gerontol A Biol Sci Med Sci. 2007;62:1028–1034. doi: 10.1093/gerona/62.9.1028. [DOI] [PMC free article] [PubMed] [Google Scholar]
- Brillinger DR. The natural variability of vital rates and associated statistics. Biometrics. 1986;42:693–734. [PubMed] [Google Scholar]
- Elandt-Johnson RC, Johnson NL. Survival models and data analysis. Wiley: New York; 1980. [Google Scholar]
- Cox DR. Regression Models and Life-Tables. J R Stat Soc Series B (Methodol) 1972;34:187–220. [Google Scholar]
- De Rango F, Montesanto A, Berardelli M, et al. To grow old in southern Italy: a comprehensive description of the old and oldest old in Calabria Gerontology 2010. in press. [DOI] [PubMed]
- Tagarelli A, Piro A, Tagarelli G, Zinno F. Color-blindness in Calabria (Southern Italy): a north-south decreasing trend. Am J Hum Biol. 2000;12:17–24. doi: 10.1002/(SICI)1520-6300(200001/02)12:1<17::AID-AJHB3>3.0.CO;2-D. [DOI] [PubMed] [Google Scholar]
- Jeune B, Skytthe A, Cournil A, et al. Handgrip strength among nonagenarians and centenarians in three European regions. J Gerontol A Biol Sci Med Sci. 2006;61:707–712. doi: 10.1093/gerona/61.7.707. [DOI] [PubMed] [Google Scholar]
- Robine JM, Paccaud F. Nonagenarians and centenarians in Switzerland, 1860–2001: a demographic analysis. J Epidemiol Community Health. 2005;59:31–37. doi: 10.1136/jech.2003.018663. [DOI] [PMC free article] [PubMed] [Google Scholar]
Associated Data
This section collects any data citations, data availability statements, or supplementary materials included in this article.