Abstract
Objective
To determine the efficacy of clinical computed tomography (CT) imaging to verify post-operative electrode array placement in cochlear implant (CI) patients.
Study Design
Nine fresh cadaver heads underwent clinical CT scanning, followed by bilateral cochlear implant insertion and post-operative clinical CT scanning. Temporal bones were removed, trimmed, and scanned using microCT. Specimens were then dehydrated, embedded in either methyl methacrylate or LR White resin, and sectioned with a diamond wafering saw. Histology sections were examined by three blinded observers to determine the position of individual electrodes relative to soft tissue structures within the cochlea. Electrodes were judged to be within the scala tympani, scala vestibuli, or in an intermediate position between scalae.
Results
The position of the array could be estimated accurately from clinical CT scans in all specimens using microCT and histology as a gold standard. Verification utilizing microCT yielded 97% agreement, and histological analysis revealed 95% agreement with clinical CT results.
Conclusions
A composite, three-dimensional image derived from a patient’s pre- and post-operative CT images using a clinical scanner accurately estimates the position of the electrode array as determined by microCT imaging and histological analyses. Information obtained using the CT method provides valuable insight into numerous variables of interest to patient performance such as surgical technique, array design, and processor programming and trouble-shooting.
INTRODUCTION
Visualization of the position of cochlear implant (CI) electrode arrays in patients has allowed investigators and clinicians to examine the relationships between the precise array position and clinical outcomes. Results of these analyses have precipitated modifications to the CI surgical approach and insertion to minimize damage to delicate intra-cochlear structures and to improve functional outcomes(1-5). Recent studies describing the synergistic merits of electrical and acoustic stimulation (EAS underline the importance of surgical insertion of the electrode array in the role of residual hearing conservation(6). Furthermore, CI recipients who have the greatest number of electrodes residing in the ST often obtain greater benefit from electrical stimulation as evidenced by their higher word recognition scores(7,8). Objective analysis of CI outcomes and continued progress in surgical techniques, as well as array design, are therefore dependent on the ability to ascertain the exact in vivo position of the electrode array.
Accurate visualization of the electrode array in vivo has allowed comparison of electrode position to patient outcomes (5,9,-13).
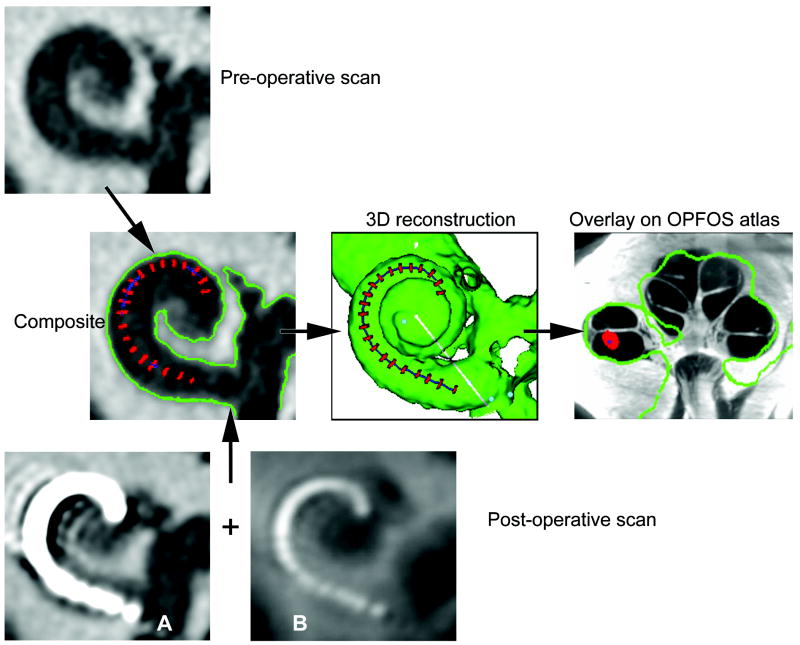
High resolution, clinical, computed tomography (CT) scanning is the established method for determining electrode array position in patients, yet metallic “bloom” artifact can obscure precise electrode array location and cochlear anatomy in post-operative scans(14-16). In 2007, Skinner and colleagues developed a technique utilizing spatial registration of a CI patient’s pre- and post-operative CT scans in which the location of an individual’s electrode array can be identified using thresholding, summed voxel rendering, and manufacturer’s array dimensional specifications(17). The resulting composite CT volume is a hybrid of the un-obscured pre-operative cochlear anatomy and the implanted array, without “bloom” artifact. The 3D image that is derived from the CT volume registration may be used to determine the insertion angle and depth of the electrode, as well as the medio-lateral canal position (Fig. 1).
FIG. 1.
Clinical CT method. Our clinical method to determine the position of electrodes is illustrated. A preoperative CT scan is combined with the postoperative scan with the electrode array in place, allowing accurate registration without interference from blooming artifact. A 3-dimensional reconstruction is made, referencing to an atlas made from a cochlea sectioned by OPFOS, allowing the scalar position of each electrode to be determined.
Historically, the ability to identify cochlear scalar boundaries has been restricted due to the limited spatial resolution and soft tissue detail available with clinical CT. To better visualize the scalar position of the array, the composite CT volume is then aligned with a high resolution (16 μm voxels) cochlear atlas to infer the location of intra-cochlear structures not resolved by CT, such as the basilar membrane. The atlas is based on an orthogonal-plane, fluorescence optical sectioning (OPFOS) microscopy scan of a single male donor with normal cochlear anatomy and illustrates details of both the soft and hard tissue anatomy of the cochlea (18). The addition of the cochlear atlas overlay to the composite CT volume allows for highly accurate estimates of scalar location for each individual electrode of the array.
While the use of the cochlear atlas based on a single donor has been found to be useful in the clinical CT registration process, direct histological correlation between clinical CT scans and corresponding histology is lacking(7,8). Numerous ex vivo studies examining surgical variables and alternate methods of CI placement verification have either depended solely on microCT analysis, assessment of the array en masse, or with the array removed from the decalcified cochlea(19-24). While microCT produces 3D volumes with excellent spatial resolution (18 μm vs. 100 μm for clinical CT), greatly reduces metal artifact “bloom”, it still has limited soft tissue detail and can only image small (max sample size 36 mm × 80 mm), post-mortem samples. Definitive assessment of array 2D position is most accurately obtained from inspection of sequential histology sections of post-mortem specimens with the array in situ(20,21,25-27). This technique may be advantageous for determining CI placement in that it yields detailed information regarding basilar membrane interaction with the array and a high resolution, unobstructed view of intracochlear anatomy. Replicating the surgical process in fresh, unfixed cadavers and affirming the position of the arrays using both microCT, for high resolution 3D images, and histological analysis, for detailed soft tissue images, enables quantification of the degree of accuracy with which the clinical CT analysis predicts the in vivo position of the electrode array.
MATERIALS AND METHODS
Experimental Design
Human cadaver heads underwent clinical CT scanning. Each cochlea was implanted with one of two commercially available electrode arrays and the heads rescanned in a clinical CT scanner. The temporal bones were then removed and trimmed to fit into an ultra high-resolution CT scanner (MicroCT) that can scan specimens less than 36 mm in diameter. The specimens were then embedded I clear resin and sectioned (wafered) with a diamond saw. The clinical CT scan reconstructions were analyzed using our established methodology (8) and the microCT and histological images analyzed in a blinded manner. The estimation of electrode position using our clinical technique and experimental assessments were compared.
Clinical CT Scanning and Implantation
Nine fresh cadaver heads underwent CT scanning with the Volume Zoom® and Sensation® 64 scanners (Siemens Medical Solutions, Forchheim, Germany) using a custom cochlear implant protocol with the following parameters: 120 KVp, 315 mA, 0.5 mm collimation and 120 KVp, 360 mA, 0.6 collimation respectively. The scans were obtained in spiral mode with a 0.9 pitch and then reconstructed using a U70u kernel, a 51 mm field of view and a slice thickness of 0.1 mm resulting in 0.1 mm isotropic voxels. In the pre-operative condition heads were positioned as they would be clinically, with chins tilted backwards to obtain images in a modified Stenver’s angle. Heads were situated such that the scan plane was parallel to a line that traversed the inferior orbital rim and petrous apex, and were secured in place using surgical tape. CTs were obtain with both scanners in order validate previous work acquired with the Volume Zoom® and support current data acquired with the Sensation 64®. The use of donated cadaver material was exempt from review by our institutional review board.
Bilateral cochlear implant surgeries were performed by two experienced otologists (TEH and RAC). A standard transmastoid facial recess approach under microscopic guidance was employed for all surgeries. While “soft surgeries” were performed in some specimens, intentional trauma was introduced during array insertion in others to produce a variety of outcomes. For example, in some specimens the array was inserted beyond the point of first resistance. The 18 cochleae were implanted in approximate equal numbers with the Advanced Bionics HIfocus® 1J and Cochlear Nucleus® 24 Contour Advance electrode arrays which account for the majority of the devices in our CI patient population. Arrays were fixed in place with cyanoacrylate glue and cut approximately one centimeter outside the cochleostomy. Incision flaps were sutured and heads underwent post-operative CT scanning. During post-operative scanning heads were positioned with chins tilted downward, mimicking the clinical positioning that avoids having the receiver-stimulator in the scan plane. The same scanning protocol used for the pre-operative CT was used for the post-operative CT with the addition of enabling extended data range so that the higher Hounsfield values of the electrode array would not be truncated. Air trapped within the calvarium was flushed with a large-bore saline syringe prior to scanning.
For each ear, the pre and post-operative clinical CT data sets were then analyzed using the 2007 Skinner volume registration method and the resulting composite volume used to create a 3D reconstruction of the implanted cochlea and array (Fig. 1)(17). The post-operative scan image A in Fig 1 exemplifies the large metallic bloom artifact of the electrode array which must be eroded by intensity thresholding to identify only the higher Hounsfield values at the center of the bloom corresponding to the metallic center of the mass of the lead wires and electrode contacts of the array. The intensity threshold value is adjusted to erode the bloom to a size approximately equal to the array diameter specified by the manufacturer. For arrays in which the electrode contacts are far enough apart, it’s possible to erode the bloom to individual objects such as the red spheres in Fig 2. When individual contacts are too close to be resolved by intensity thresholding alone, a summed voxel projection of the CT volume (Fig 1 Post-operative scan image B) is used in conjunction with manufacturer specifications of contact location to segment the eroded bloom into individual contact objects such as the red discs in Fig 1. To determine the scalar position for each electrode contact of the array, the 3D reconstruction volume was then manually registered and scaled to a best fit to the cochlear atlas and a series of mid-modiolar images of the combined volume were generated (Fig 1 overlay on OPFOS atlas image). The cochlear canal was divided by a line projecting along the osseous spiral lamina of the cochlear atlas and if 75% or greater of the electrode contact object was below or above that line it was assigned a positron of ST or SV respectively. For all other intermediate positions, the contact was assigned an M designation. A single observer (TAH) performed this analysis and was blinded to the histology analysis. Analyze™ software (Robb, 2001), a Windows-based 3D biomedical image visualization and analysis program, was used to import the 2D image series from each of the imaging modalities used in this study, create 3D volumes reformatted to a mid-modiolar orientation, and perform the image manipulation and analysis(28).
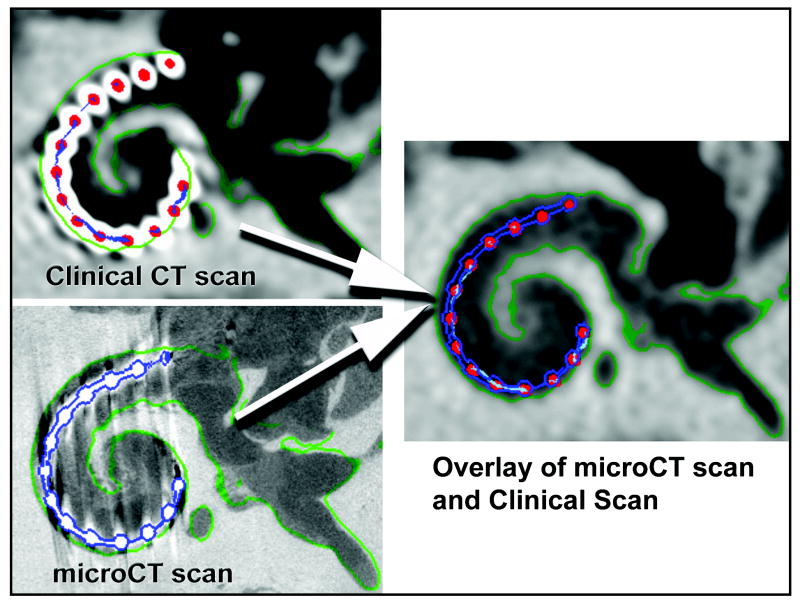
FIG. 2.
Verification methods. Clinical CT (top) and micro-CT (bottom) through the same section of the temporal bone with the implant in place.
Temporal Bone Removal and MicroCT Scanning
The individual temporal bones were subsequently removed from the heads and trimmed for microCT scanning using an otologic drill (Anspach Effort®, Palm Beach Gardens, FL) to a core of approximately three centimeters in diameter and four centimeters in length. One array became dislodged and was excluded from further analysis. The remaining seventeen specimens were fixed in 10% neutral buffered formalin.
MicroCT scanning of all temporal bones was performed with a Scanco μCT 40 (Scanco Medical AG, Basserdorf, Switzerland) set in high-resolution mode: 70 kVp tube potential, 114 μA tube current, 200 ms integration time, and 18 μm isotropic voxels. Although samples were scanned in a plane perpendicular to the electrode array within the basal turn, this scanner produces isotropic voxels which can be reformatted in any plane without loss of resolution. Concordance between the clinical CT scan and the microCT scan was performed by first volume registering the two scans, outlining the location of the electrode array in the microCT volume (blue outline Fig 2), and then transferring that outline to the composite volume of the clinical CT analysis (Fig. 2). A series of images of this resulting combined volume (clinical CT analysis and microCT array outline), perpendicular to the plane of the electrode array within the basal turn of the cochlea, was then examined to determine if at least 50% of each electrode contact object (red dots in Fig 2) as identified by the clinical CT analysis was within the microCT outline for the corresponding electrode contact. A count of the number of electrode contacts that met this criteria was recorded for sample.
Histology
Specimens were further trimmed to include the cochlear otic capsule and prepared for histologic analysis utilizing a protocol similar to that described by Plenk(29). Labyrinths were dehydrated in a graded series of alcohols (50, 70, and 100% ethanol). Seven specimens were embedded with methyl methacrylate (Osteo-Bed; Polysciences, Inc.) and ten were embedded with LR White Hard Resin (London Resin Co; London, England). For the methyl methacrylate embedding, specimens were infiltrated with uncatalyzed methacrylate in increasing concentrations over two weeks at 4° C with gentle orbital agitation (Junior Orbital Shaker, Lab-Line Instruments, Melrose Park, IL, USA). They were then placed into catalyzed methacrylate containing 1.4 grams of benzoyl peroxide per 100 ml of methacrylate for one week with agitation and finally they were in methacrylate with 3.5 grams of benzoyl peroxide per100 ml at 37° C to harden.
Similarly, dehydrated specimens were embedded in LR White resin. The specimens were placed into increasing concentrations of resin over one week and degassed under vacuum. Finally, the specimens were placed into resin and cured under ultraviolet light for 24 hours.
Following embedding, labyrinths were further trimmed for sectioning with a low speed diamond circular saw with a wafering blade (Buehler IsoMet, Beuhler; Lake Bluff, IL, USA). Blocks were aligned perpendicular to the array so that the modiolus was parallel to the plane of the saw blade. The thickness of the slices was approximately 200μm. Sections were mounted onto glass slides with Permount® (Thermo Fisher Sci. Inc., USA). Slides were viewed using an Olympus BH2-RFCA (1.25x) microscope (Olympus America, Inc; Center Valley, PA, USA). Images were obtained with a Sony DKC-5000 (Sony Electronics, Inc; San Diego, CA) digital camera. Images used for illustration purposes were aesthetically retouched using Photoshop CS5 (Adobe Systems Inc., USA).
Slides were analyzed independently by three of the authors (JT, TEH and RAC) to ascertain the scalar location of the electrode array. Electrodes beneath the cochlear partition were designated as in the scala tympani (ST), those above Reissner’s membrane were designated as in the scala vestibuli (SV), and those in the region of the scala media were designated as intermediate. The term intermediate was chosen since some arrays displaced the cochlear partition upward while still in the scala tympani space and others actually penetrated the cochlear partition. Data collection forms were used to record the location of each electrode of the array. Evaluators (JT, TEH and RAC) were blinded to the images of the clinical and microCT scans. The evaluator who rendered the clinical CT images (TAH) was blinded to the histologic analysis and judged scalar placement using the 3-D CT composite technique alone. We followed the recently adopted coordinate terminology: “the zero reference angle was chosen at the center of the round window.”(13)
The correlation among the three methods of electrode position; histology, clinical CT scanning and microCT, were made for each electrode in the array and expressed as a percent of correlation.
RESULTS
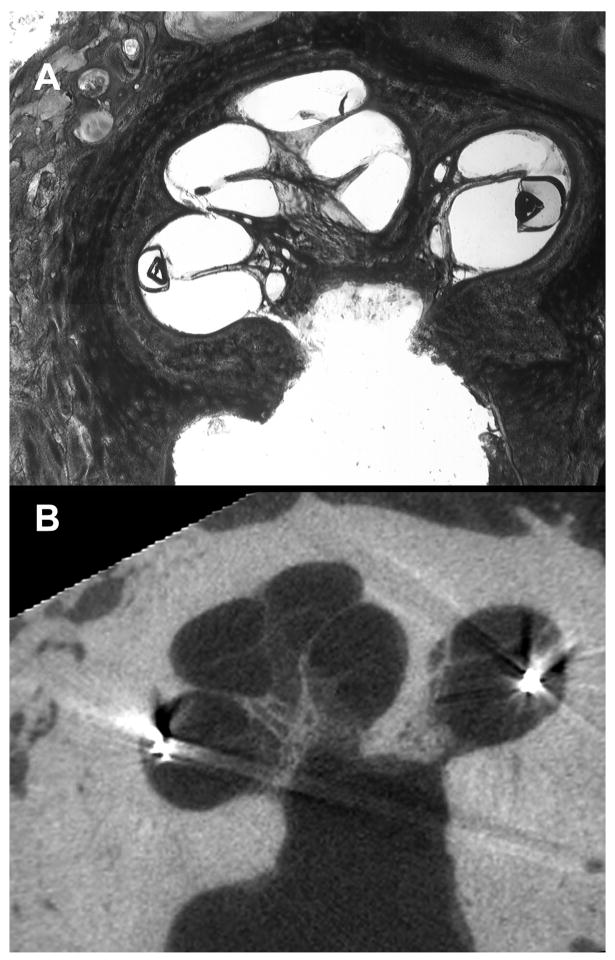
Verification of the clinical technique was performed using twofold approach: microCT and histologic correlation (Fig 3).
FIG. 3.
Verification methods. Histologic section (top) and micro-CT image (bottom) through the same section of the temporal bone. Micro-CT scan reformatted to match the section of the histologic slice.
When comparing the measured electrode position with the clinical CT method to the microCT scans, we found that 302 of 310 (97.0%) of the electrodes examined met the concordance criterion, with most instances of disagreement confined to apical electrodes. Sixteen of seventeen electrode arrays were suitable for this analysis. The degree of movement during dissection rendered one array unusable. Migration of this array likely happened after the head underwent clinical CT scanning, during the temporal bone removal and drill down process to allow the bone to fit into the microCT specimen holder.
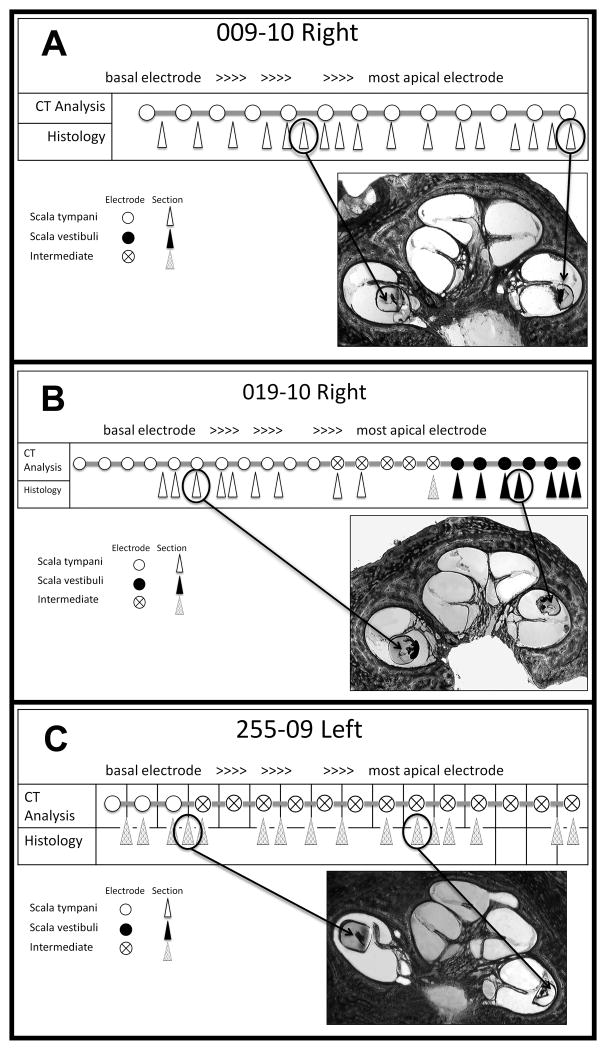
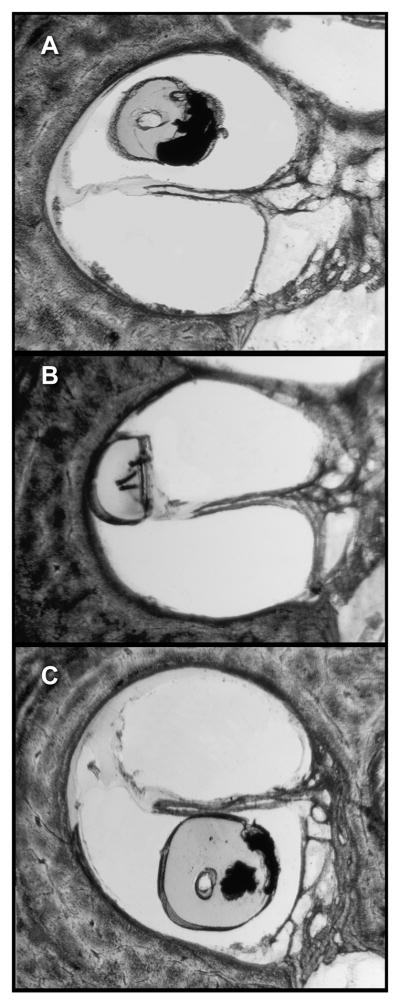
Sixteen electrode arrays were suitable for histological analysis for verification of array position on a two-dimensional level. Histology provided access to the greatest level of detail enabling the investigators to view electrodes interacting with the basilar membrane in regions of transition, such that they did not reside solely in one scala. Therefore, each electrode location, as identified by the clinical CT analysis, was compared to its corresponding histology image and was judged as residing in the ST, SV, or in an intermediate position between the ST and SV (Fig 4). In most instances, when the electrode array was in the intermediate position, it had displaced the basilar membrane upward and actually remained within the scala tympani.(Fig 5). Since the methacrylate embedded electrode arrays swelled during histologic preparation, their precise pre-embedding location could not be determined. However, we counted the array as being in the ST if it displaced the basilar membrane upward (apically) and in the SV if it displaced the basilar membrane downward (toward RW). Specimens embedded with resin were free from swelling artifact and allowed a more precise position analysis.
FIG. 4.
Correlation of micro-CT, histology, and clinical CT. We tabulated the position of each part of the electrode array in the histologic sections and depicted them with arrowheads in this figure. The position of each electrode was determined by clinical CT scanning and depicted them with circles. The position of each is shown as depicted in the figure.
FIG. 5.
The 3 possible positions of the electrode array are depicted: within the SV (A), in an intermediate position (in this instance, displacing the basilar membrane apically) (B), and within the ST (C).
We determined that 150 of the 158 (94.9%) of electrode locations analyzed via histology were concordant with the clinical CT analysis. We consistently found 100% agreement between clinical CT analysis and histology for arrays with all electrodes in scala tympani or the scala vestibuli. Deviations from the clinical CT technique and histology were confined to regions of transition from ST to intermediary, or intermediary to SV.
DISCUSSION
The surgical technique and the resulting position of the electrode array are principal factors in the avoidance of intracochlear trauma, preservation of residual hearing, and optimization of clinical outcomes for CI patients (4,8,17,30,31). CT scanning has been used to evaluate the position of an electrode array within the cochlea after implantation. Clinical CT scanning has limitations: 1. the resolution of clinical CT scanning is approximately 0.33 mm(32) and 2. the bloom artifact caused by the metallic electrodes distorts not only the size and shape of the electrode but the surrounding calcified tissues as well (14-16). Therefore, assessment of an electrode array’s scalar position in a patient post-operatively is an estimate based on the pre-operative scan, the post operative scan and assumptions on the position of the cochlear partition. Postoperative CT scanning alone has been used to estimate the position of electrode arrays but the bloom artifact limits it’s accuracy to the basal turn of the cochlea(19). Similarly, van Wermeskerken and colleagues were unable to reliably evaluate electrode position in more apical locations on a single post-operative CT scan(9). The purpose of this study was to determine the degree of accuracy with which a patient’s CI electrode image, based on pre-operative and post-operative clinical CT scans, predicts the in vivo position of the array. We found that histological analyses and microCT comparisons correlated well with clinical CT imaging in identification of scalar placement and in distinguishing where the array transitioned from ST to SV.
Previous studies from our institution using pre- and post-operative clinical scanning have relied on registration with an OPFOS image from a single normal cochlea to register the position of the electrode array in relationship to the basilar membrane(7,8,17). In those studies, the electrode array was considered to be in the ST if it were below the cochlear partition and in the SV if it were above the cochlear partition. This study confirms the validity of the previously used method and suggests some modifications based upon histological and microCT analysis of specimens which used our clinical CT imaging techniques.
We suggest that the position of the electrode array should be considered in the ST if it is below the cochlear partition on clinical CT scanning but that a judgment be made about the location of the array when it is above the cochlear partition: if the array is in the anatomic region of the scala media (SM), it should be considered in an “intermediate” location; if it is above the region of Reissner’s membrane, it should be considered in the SV. Because, on histological analysis, an electrode array in the intermediate position was seen to be displacing the basilar membrane upward in some cases, it is not actually in the scala media but within the fluid space of the scala tympani. Similarly, if an electrode array were in the SV and displacing the structures of the scala media downward, it would be within the fluid space of the SV but would appear on clinical CT scanning to be in the region of the SM. Therefore, we suggest the term “intermediate” be used to more accurately describe the position of such electrodes on clinical CT scanning. The term, “SM” is imprecise and should not be used to describe the intermediate position on CT scanning since its definite position within one of the fluid spaces of the cochlea cannot be determined from clinical CT scanning alone.
CONCLUSION
The results of this study support the hypothesis that a composite, 3-D image using a patient’s pre and post-operative CT scan images, aligned with a cochlear atlas, accurately defines the in vivo position of the electrode array needed for objective analyses of CI outcomes. We suggest when scalar position is determined using clinical CT scanning, three positions should be noted, ST, SV and intermediate.
Acknowledgments
Funding sources: Department of Otolaryngology Washington University School of Medicine P30 DC004665-11 Chole K08 DC006869 Hullar
Footnotes
Presented at the 6th International Symposium on Objective Measures in Auditory Implants, September 24, 2010.
References
- 1.Balkany TJ, Connell SS, Hodges AV, et al. Conservation of residual acoustic hearing after cochlear implantation. Otol Neurotol. 2006;27:1083–8. doi: 10.1097/01.mao.0000244355.34577.85. [DOI] [PubMed] [Google Scholar]
- 2.Fraysse B, Macias AR, Sterkers O, et al. Residual hearing conservation and electroacoustic stimulation with the nucleus 24 contour advance cochlear implant. Otol Neurotol. 2006;27:624–33. doi: 10.1097/01.mao.0000226289.04048.0f. [DOI] [PubMed] [Google Scholar]
- 3.Gantz BJ, Turner C, Gfeller KE, et al. Preservation of hearing in cochlear implant surgery: advantages of combined electrical and acoustical speech processing. Laryngoscope. 2005;115:796–802. doi: 10.1097/01.MLG.0000157695.07536.D2. [DOI] [PubMed] [Google Scholar]
- 4.James CJ, Fraysse B, Deguine O, et al. Combined electroacoustic stimulation in conventional candidates for cochlear implantation. Audiol Neurootol. 2006;11(Suppl 1):57–62. doi: 10.1159/000095615. [DOI] [PubMed] [Google Scholar]
- 5.Brown CJ, Abbas PJ, Etlert CP, et al. Effects of long-term use of a cochlear implant on the electrically evoked compound action potential. J Am Acad Audiol. 2010;21:5–15. doi: 10.3766/jaaa.21.1.2. [DOI] [PMC free article] [PubMed] [Google Scholar]
- 6.Gifford RH, Dorman MF, Shallop JK, et al. Evidence for the expansion of adult cochlear implant candidacy. Ear Hear. 31:186–94. doi: 10.1097/AUD.0b013e3181c6b831. [DOI] [PMC free article] [PubMed] [Google Scholar]
- 7.Finley CC, Holden TA, Holden LK, et al. Role of electrode placement as a contributor to variability in cochlear implant outcomes. Otol Neurotol. 2008;29:920–8. doi: 10.1097/MAO.0b013e318184f492. [DOI] [PMC free article] [PubMed] [Google Scholar]
- 8.Skinner MW, Ketten DR, Holden LK, et al. CT-derived estimation of cochlear morphology and electrode array position in relation to word recognition in Nucleus-22 recipients. J Assoc Res Otolaryngol. 2002;3:332–50. doi: 10.1007/s101620020013. [DOI] [PMC free article] [PubMed] [Google Scholar]
- 9.van Wermeskerken GK, van Olphen AF, Graamans K. Imaging of electrode position in relation to electrode functioning after cochlear implantation. Eur Arch Otorhinolaryngol. 2009;266:1527–31. doi: 10.1007/s00405-009-0939-2. [DOI] [PMC free article] [PubMed] [Google Scholar]
- 10.Wackym PA, Firszt JB, Gaggl W, et al. Electrophysiologic effects of placing cochlear implant electrodes in a perimodiolar position in young children. Laryngoscope. 2004;114:71–6. doi: 10.1097/00005537-200401000-00012. [DOI] [PubMed] [Google Scholar]
- 11.Whiting BR, Holden TA, Brunsden BS, et al. Use of computed tomography scans for cochlear implants. J Digit Imaging. 2008;21:323–8. doi: 10.1007/s10278-007-9045-4. [DOI] [PMC free article] [PubMed] [Google Scholar]
- 12.Verbist BM, Joemai RM, Briaire JJ, et al. Cochlear coordinates in regard to cochlear implantation: a clinically individually applicable 3 dimensional CT-based method. Otol Neurotol. 2010;31:738–44. doi: 10.1097/MAO.0b013e3181d8d3c4. [DOI] [PubMed] [Google Scholar]
- 13.Verbist BM, Skinner MW, Cohen LT, et al. Consensus panel on a cochlear coordinate system applicable in histologic, physiologic, and radiologic studies of the human cochlea. Otol Neurotol. 2010;31:722–30. doi: 10.1097/MAO.0b013e3181d279e0. [DOI] [PMC free article] [PubMed] [Google Scholar]
- 14.Ketten DR, Skinner MW, Wang G, et al. In vivo measures of cochlear length and insertion depth of nucleus cochlear implant electrode arrays. Ann Otol Rhinol Laryngol Suppl. 1998;175:1–16. [PubMed] [Google Scholar]
- 15.Whiting BR, Bae KT, Skinner MW. Cochlear implants: three-dimensional localization by means of coregistration of CT and conventional radiographs. Radiology. 2001;221:543–9. doi: 10.1148/radiol.2212010275. [DOI] [PubMed] [Google Scholar]
- 16.Xu J, Xu SA, Cohen LT, et al. Cochlear view: postoperative radiography for cochlear implantation. Am J Otol. 2000;21:49–56. [PubMed] [Google Scholar]
- 17.Skinner MW, Holden TA, Whiting BR, et al. In vivo estimates of the position of advanced bionics electrode arrays in the human cochlea. Ann Otol Rhinol Laryngol Suppl. 2007;197:2–24. [PubMed] [Google Scholar]
- 18.Voie AH. Imaging the intact guinea pig tympanic bulla by orthogonal-plane fluorescence optical sectioning microscopy. Hear Res. 2002;171:119–28. doi: 10.1016/s0378-5955(02)00493-8. [DOI] [PubMed] [Google Scholar]
- 19.Lane JI, Driscoll CL, Witte RJ, et al. Scalar localization of the electrode array after cochlear implantation: a cadaveric validation study comparing 64-slice multidetector computed tomography with microcomputed tomography. Otol Neurotol. 2007;28:191–4. doi: 10.1097/01.mao.0000247817.31572.ed. [DOI] [PubMed] [Google Scholar]
- 20.Lee J, Nadol JB, Jr, Eddington DK. Factors associated with incomplete insertion of electrodes in cochlear implant surgery: a histopathologic study. Audiol Neurootol. 16:69–81. doi: 10.1159/000316445. [DOI] [PMC free article] [PubMed] [Google Scholar]
- 21.Lee J, Nadol JB, Jr, Eddington DK. Depth of electrode insertion and postoperative performance in humans with cochlear implants: a histopathologic study. Audiol Neurootol. 15:323–31. doi: 10.1159/000289571. [DOI] [PMC free article] [PubMed] [Google Scholar]
- 22.Roland JT., Jr A model for cochlear implant electrode insertion and force evaluation: results with a new electrode design and insertion technique. Laryngoscope. 2005;115:1325–39. doi: 10.1097/01.mlg.0000167993.05007.35. [DOI] [PubMed] [Google Scholar]
- 23.Roland PS, Wright CG, Isaacson B. Cochlear implant electrode insertion: the round window revisited. Laryngoscope. 2007;117:1397–402. doi: 10.1097/MLG.0b013e318064e891. [DOI] [PubMed] [Google Scholar]
- 24.Schuman TA, Noble JH, Wright CG, et al. Anatomic verification of a novel method for precise intrascalar localization of cochlear implant electrodes in adult temporal bones using clinically available computed tomography. Laryngoscope. 120:2277–83. doi: 10.1002/lary.21104. [DOI] [PMC free article] [PubMed] [Google Scholar]
- 25.Adunka OF, Buchman CA. Scala tympani cochleostomy I: results of a survey. Laryngoscope. 2007;117:2187–94. doi: 10.1097/MLG.0b013e3181453a6c. [DOI] [PubMed] [Google Scholar]
- 26.Adunka OF, Radeloff A, Gstoettner WK, et al. Scala tympani cochleostomy II: topography and histology. Laryngoscope. 2007;117:2195–200. doi: 10.1097/MLG.0b013e3181453a53. [DOI] [PubMed] [Google Scholar]
- 27.Wardrop P, Whinney D, Rebscher SJ, et al. A temporal bone study of insertion trauma and intracochlear position of cochlear implant electrodes. I: Comparison of Nucleus banded and Nucleus Contour electrodes. Hear Res. 2005;203:54–67. doi: 10.1016/j.heares.2004.11.006. [DOI] [PubMed] [Google Scholar]
- 28.Robb RA. The biomedical imaging resource at Mayo Clinic. IEEE Trans Med Imaging. 2001;20:854–67. doi: 10.1109/42.952724. [DOI] [PubMed] [Google Scholar]
- 29.Plenk H. The microscopic evaluation of hard tissue implants. In: Williams DF, editor. Techniques of Biocompatibility Testing. Boca Raton, FL: CRC Press; 1986. pp. 35–81. [Google Scholar]
- 30.Friedland DR, Runge-Samuelson C. Soft cochlear implantation: rationale for the surgical approach. Trends Amplif. 2009;13:124–38. doi: 10.1177/1084713809336422. [DOI] [PMC free article] [PubMed] [Google Scholar]
- 31.Kiefer J, Gstoettner W, Baumgartner W, et al. Conservation of low-frequency hearing in cochlear implantation. Acta Otolaryngol. 2004;124:272–80. doi: 10.1080/00016480310000755a. [DOI] [PubMed] [Google Scholar]
- 32.Siemens. SOMATOM Sensation - Technical Specifications. 2011 http://www.medical.siemens.com/webapp/wcs/stores/servlet/ProductDisplay~q_catalogId~e_-1~a_catTree~e_12781~a_langId~e_-1~a_productId~e_143945~a_storeId~e_10001~a_view~e_38.htm.


