Abstract
In inflammatory bowel diseases (IBD), intestinal barrier function is impaired as a result of deteriorations in epithelial tight junction (TJ) structure. IL-6, a pleiotropic cytokine, is elevated in IBD patients, although the role of IL-6 in barrier function remains unknown. We present evidence that IL-6 increases TJ permeability by stimulating the expression of channel-forming claudin-2, which is required for increased caudal-related homeobox (Cdx) 2 through the MEK/ERK and PI3K pathways in intestinal epithelial cells. IL-6 increases the cation-selective TJ permeability without any changes to uncharged dextran flux or cell viability in Caco-2 cells. IL-6 markedly induces claudin-2 expression, which is associated with increased TJ permeability. The colonic mucosa of mice injected with IL-6 also exhibits an increase in claudin-2 expression. The claudin-2 expression and TJ permeability induced by IL-6 are sensitive to the inhibition of gp130, MEK, and PI3K. Furthermore, expression of WT-MEK1 induces claudin-2 expression in Caco-2 cells. Claudin-2 promoter activity is increased by IL-6 in a MEK/ERK and PI3K-dependent manner, and deletion of Cdx binding sites in the promoter sequence results in a loss of IL-6-induced promoter activity. IL-6 increases Cdx2 protein expression, which is suppressed by the inhibition of MEK and PI3K. These observations may reveal an important mechanism by which IL-6 can undermine the integrity of the intestinal barrier.
Keywords: Cell Junctions, Interleukin, Intestine, Signal Transduction, Tight Junctions, Claudin-2, Inflammatory Bowel Disease, Interleukin-6
Introduction
One of the most important functions of gastrointestinal epithelial cells is to provide a physical barrier to the diffusion of pathogens, toxins, and antigens from the luminal environment into the circulation. This depends on the coordinated expression and interaction of proteins in cell-cell junctional complexes, including the tight junction (TJ)2 (1). The TJ is a multi-protein complex, located around the apical end of the lateral membrane of polarized epithelial cells, which selectively regulates the paracellular passage of ions, molecules and water. Four types of integral transmembrane proteins, occludin (2), the claudins (3), junctional adhesion molecule (JAM) (4), and tricellulin (5), have been identified so far. These transmembrane proteins interact with intracellular plaque proteins such as zonula occludens (ZO) proteins and cingluin, which in turn anchor the transmembrane proteins to the perijunctional actin cytoskeleton (1). The interaction of TJ proteins with the actin cytoskeleton is vital for maintaining TJ structure and function. Numerous studies have reported that TJ permeability and TJ protein expression/cytoskeletal association are dynamically regulated by various intracellular signaling molecules, such as PKC (6, 7), MAPK (8), PI3K (9), and protein phosphatases (10).
Under pathophysiological conditions, the disturbance of the epithelial barrier allows contact with, or even penetration of, noxious luminal contents such as antigens or bacteria into the intestinal immune system resulting in mucosal inflammation, as is the case in inflammatory bowel diseases (IBD). Although the pathogenesis of the barrier defect in IBD is still unclear, studies conducted in cell cultures and animal models demonstrate that some proinflammatory cytokines such as TNF-α (11), IFN-γ (11, 12), IL-1β (13), and IL-13 (14, 15) impair barrier function by decreasing TJ protein expression, stimulating cytoskeletal contraction, and inducing epithelial apoptosis. However, changes in cytokine profile in inflammatory conditions are complicated, and the effects of other cytokines on barrier function require further investigation.
IL-6 is a pleiotropic cytokine whose expression is important for the host response to a number of infections, exerts antigen-specific immune responses, and has both pro- as well as anti-inflammatory effects (16, 17). In pathological states, excessive secretion and dysregulation of IL-6 and its signaling pathway may play a major role in the pathogenesis of many diseases, including IBD (18–20). IL-6 is produced in substantially higher amounts in both the serum and tissues of IBD patients. In mice, the knock-out and blockade of IL-6 and IL-6 receptor suppress experimental colitis, indicating an important contribution of IL-6 and the IL-6 trans-signaling pathways for progression of IBD (21–24). The major source of IL-6 seen in IBD has been shown to be intestinal epithelial cells and lamina propria mononuclear cells (18). However, the role of IL-6 in the regulation of intestinal barrier function remains poorly understood.
The claudin family consists of at least 24 members (1). In contrast to their structural similarities, the claudins perform different functions and can roughly be divided into two types, those involved in barrier formation, and those important in channel formation (25). For example, claudin-1 is crucial for tightening the barrier in renal epithelial cells and mammalian epidermis (26, 27). In contrast, claudin-2 expression decreases the tightness of the epithelial barrier, which, it has been suggested, is mediated by a paracellular channel for small cations (28). It has been reported that claudin-2 expression is markedly increased in the colons of patients suffering from Crohn disease and ulcerative colitis, and it seems to have an important role in the pathogenesis of IBD (29).
In the present study, we provide evidence that IL-6 has a role in the regulation of intestinal epithelial TJs. Our results demonstrate that IL-6 induces claudin-2 expression through signaling pathways involving MEK/ERK and PI3K, and transcriptional factor Cdx2 expression.
EXPERIMENTAL PROCEDURES
Chemicals
The following antibodies were used in this study; rabbit polyclonal anti-claudin-1, anti-claudin-2, anti-claudin-3, anti-JAM-1, anti-ZO-1, and anti-ZO-2, mouse anti-claudin-4, and HRP-conjugated anti-occludin (Life Technologies); rabbit polyclonal anti-Cdx2 and rabbit monoclonal anti-pERK1/2 (Thr-202/Tyr-204), pSTAT3 (Tyr-705), pAkt (Ser-473), and mouse monoclonal anti-ERK1/2 and HA-Tag (Cell Signaling Technology); mouse monoclonal anti-gp130 (R&D Systems); mouse anti-β-actin and HRP-conjugated anti-mouse and -rabbit IgG (Sigma); AlexaFluor 488 conjugated goat polyclonal anti-rabbit IgG and AlexaFluor 546 conjugated goat polyclonal anti-mouse IgG (Life Technologies). The following signaling inhibitors were used in this study; U0126 (a MEK inhibitor), LY294002 (a PI3K inhibitor), PP2 (a Src inhibitor), AG490 (a JAK inhibitor), ammonium pyrrolidinedithiocarbamate (APDC, a NFκB inhibitor) were purchased from Calbiochem. All other chemicals were obtained from Wako Pure Chemical Industries.
Cell Culture
Caco-2 (HTB-37) and T84 intestinal epithelial cells (CCL-248) purchased from American Type Cell Culture were grown under standard cell culture conditions as described (6, 7). Cells were grown on polyester membranes in Transwell and Snapwell inserts (12-mm; Corning) for 14 (Caco-2) or 7 (T84) days prior to experiments.
Treatment with IL-6 and Inhibitors
Recombinant human IL-6 (0∼100 ng/ml; Miltenyie Biotech) was applied to the basal aspect of cells. Cell monolayers were incubated with anti-gp130 (5 and 10 μg/ml), AG490 (1 and 3 μm), U0126 (5 and 10 μm), LY294002 (12 and 25 μm), PP2 (3 and 10 μm), and APDC (10 and 30 μm) 0.5 h before IL-6 administration.
Electrophysiological Measurements
Transepithelial electrical resistance (TER) as an indicator of TJ permeability to ionic solutes, and unidirectional flux of FITC-conjugated dextran as an indicator of TJ permeability to uncharged macromolecules were assessed in Caco-2 and T84 cell monolayers. TER was measured as described previously (6, 7) using a Millicell-ERS Electrical Resistance System (Millipore) at varying times during the experiment. Cell monolayers were incubated in the presence of FITC-dextran (4 kDa, 100 μm) in the apical well and the fluorescence in the basal well was determined using a fluorescence plate reader (ARVO X4, Perkin Elmer).
The NaCl dilution potential in Caco-2 cells on Snapwell inserts were measured using a vertical diffusion chamber system (Harvard Apparatus). Each chamber was filled with 6 ml of Hanks' balanced salt solution supplemented with 5.6 mm d-glucose and 4 mm l-glutamine. The chambers were kept at 37 °C, and 100% O2 was bubbled through the solutions. The transepithelial potential was measured using 3 m-KCl electrode and voltage-clamping device (CEZ9100, Nihon Kohden). The NaCl dilution potential was determined from the shift in the reversal potential after replacing basal solution with one in which 130 mm mannitol was substituted for the 65 mm NaCl (15). The permeability ratio, PNa+/PCl−, was determined using Godlmann-Hodgkin-Katz equation as described previously (30). Liquid junction potentials measured using empty Snapwell inserts were <0.1 mV.
Cell Viability
Cell viability was monitored by assaying mitochondrial dehydrogenase activity (WST-8, Dojindo) after IL-6 treatment.
Transfection
A MEK1WT-HA in pMCL vector was kindly provided from Dr Natalie Ahn (University of Colorado) (31). Caco-2 cells were seeded on 6-well plates a day before transfection. The cells were transfected using 1 ml of antibiotics-free DMEM containing 10% FBS, 1 μg of DNA plasmid (empty and MEK1WT-HA vectors), 1 μl of Plus reagent, and 3 μl of Lipofectamine-LTX (Life Technologies) for each well. After 20 h, the cell monolayers were trypsinized and seeded in Transwell inserts.
Mice
Male BALB/c mice (6-week-old) were purchased from Clea Japan. Recombinant mouse IL-6 (6 μg/mouse; Biolegend) was injected intraperitoneally 16 h prior to tissue harvest. PBS was used as the control treatment. The animal study was approved by the Hiroshima University Animal Committee, and the mice were maintained in accordance with the Hiroshima University guidelines for the care and use of laboratory animals.
Preparation of Detergent-insoluble Fractions and Whole Cell Extracts
Detergent-insoluble fractions and whole cell extracts were prepared as previously described. The detergent insoluble fraction corresponds to the actin cytoskeleton-associated proteins. For preparations of detergent-insoluble fractions, Caco-2 cell monolayers were washed with ice-cold PBS and incubated for 5 min at 4 °C with 200 μl of lysis buffer-CS (1% Triton X-100, 5 mm EGTA in 50 mm Tris containing protease inhibitors (5 mg/liter aprotinin, 3 mg/liter leupeptin hemisulfate, 5 mm benzamidine hydrochloride, and 1 mm PMSF) and phosphatase inhibitors (25 mm glycerol-2-phosphate, 2 mm sodium orthovanadate, and 10 mm sodium fluoride, pH 7.4). Cell lysates were centrifuged at 15,600 × g for 10 min at 4 °C to precipitate the high-density actin-rich fraction. Pellets were resuspended in 100 μl of lysis buffer D (0.3% SDS, 10 mm Tris, and the protease and phosphatase inhibitors described above, pH 7.4). For preparation of the whole Caco-2 cell extracts, 200 μl of lysis buffer D was used after washing cell monolayers with ice-cold PBS. Mouse colon tissue (50 mg) was homogenized in 1 ml lysis buffer D using a polytron-type homogenizer. Protein concentrations in the different fractions were measured using the BCA method (Pierce Biotechnology).
Immunoblot Analysis
Cell extracts were mixed with a half volume of Laemmli sample buffer (3× concentrated; 6% (w:v) SDS, 30% (v:v) glycerol, 15% (v:v) 2-β-mercaptoethanol, and 0.02% (w:v) bromphenol blue in 188 mm Tris, pH 6.8) and heated to 100 °C for 5 min. Proteins (20 μg) were separated by SDS-PAGE and transferred to PVDF membranes. Membranes were blotted for ZO-1, ZO-2, JAM-1, claudin-1, claudin-2, claudin-3, claudin-4, Cdx2, pSTAT3, pERK1/2, pAkt, and β-actin, using specific antibodies in combination with HRP-conjugated anti-mouse IgG or HRP-conjugated anti-rabbit IgG antibodies. HRP-conjugated anti-occludin antibody was used for immunoblot analysis of occludin. The blots were developed using the ECL chemiluminescence method (GE Healthcare). Quantification was performed by densitometric analysis of specific bands on the immunoblots using Image J software.
Immunofluorescence Microscopy
Caco-2 cell monolayers were washed with ice-cold PBS, fixed in methanol at 0 °C for 5 min, and permeabilized with 0.2% Triton X-100 in PBS for 5 min. Cell monolayers were blocked in 4% nonfat milk in TBST (20 mm Tris, 150 mm NaCl, 0.05% Tween-20, pH7.4) and incubated for 1 h with rabbit polyclonal anti-claudin-2, ZO-1, Cdx2, and mouse monoclonal anti-HA tag, gp130, and gp80 antibodies followed by incubation for 1 h with secondary antibodies (goat AlexaFluor 488-conjugated anti-rabbit IgG and AlexaFluor 546-conjugated anti-mouse IgG) with DAPI.
Mouse colon tissue was embedded in OCT compound (Sakura Finetek Japan) after fixation with 3.7% paraformaldehyde in PBS. Frozen sections (8 μm in thickness) were prepared on glass slides and washed with PBS. The sections were blocked in 5% normal goat serum and incubated for 1 h with rabbit polyclonal anti-claudin-2, followed by incubation for 1 h with goat AlexaFluor 488-conjugated anti-rabbit IgG, rhodamine-conjugated phalloidine and DAPI.
The specimens were preserved in a mounting medium, and the fluorescence was visualized using Nikon ECLIPSE E600 fluorescence microscope (Nikon) and Olympus FW1000 confocal microscope (Olympus).
RNA Extraction and Quantitative RT-PCR
The total RNA of Caco-2 cells was isolated using TRI reagent (Sigma), and reverse-transcribed with ReverTra Ace® qPCR RT kit (TOYOBO) according to the manufacturer's instructions. Quantitative real-time PCR was performed using an ABI PRISM 7700 Sequence Detection System (Life Technologies) and KAPA SYBR FAST qPCR kit (KAPA BIOSYSTEMS). The primer sequences used for PCR are shown in supplemental Table S1. Reactions were performed at 95 °C for 2 min, followed by 40 cycles of 95 °C for 3 s and 60 °C for 30 s. The dissociation stage was analyzed at 95 °C for 15 s, followed by one cycle of 60 °C for 15 s and 95 °C for 15 s. The fluorescence of the SYBR green dye was determined as a function of the PCR cycle number, giving the threshold cycle number at which amplification reached a significant threshold. Data were analyzed by the ΔΔCt method and presented as fold changes in gene expression after normalization to the internal control β-actin gene expression level.
Isolation of Claudin-2 Promoter Fragment and Mutagenesis
Genomic DNA was purified from Caco-2 cells using TRI reagent. The 5′ region (−1067 to −1) of the human Claudin-2 gene was amplified by PCR with gene-specific primers (forward/reverse) 5′-GAATCTTGGCAACACCGAGG-3′/5′-GGCAGACCTCTCAGTAGAAG-3′, inserted into the pGEM-T vector (Promega), and sequenced. The Claudin-2 promoter fragment with MluI and BglII sites was subcloned into the pGL3 Basic vector (Promega). In the promoter sequence, 6 putative transcription factor binding sites (4 sites for Cdx, a site for STAT, and a site for NFκB) were detected by TFSEARCH (Real World Computing Partnership). Deletion mutants for the putative transcription factor binding sites (Cdx, STAT, and NFκB) were introduced into the WT-claudin-2 promoter sequence using the KOD-Plus Mutagenesis kit (TOYOBO). The primer sequences used for mutagenesis are shown in supplemental Table S2.
Reporter Assay
An hClaudin-2 promoter in a pGL3 vector driving luciferase expression was transfected to Caco-2 cells. Luciferase activity in cell lysates was assayed by the Luciferase assay system (Promega).
Statistical Analysis
Statistical analyses were performed using a one-way ANOVA approach followed by a Tukey-Kramer multiple range test using the general linear models procedure of the Statistical Analysis Systems program (version 6.07; SAS Institute Inc). A difference of p < 0.05 was considered significant.
RESULTS
IL-6 Increases TJ Permeability to Na+, but Not Macromolecules
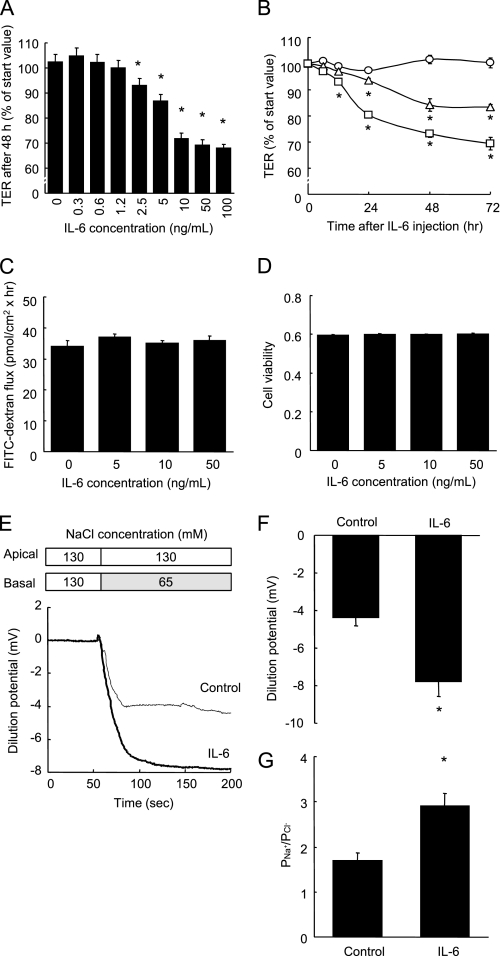
The degree of tightness of the TJ can be evaluated by measuring the transepithelial electrical resistance (TER, an indicator of TJ permeability to ionic solutes) and dextran flux (an indicator of TJ permeability to uncharged macromolecules). In Caco-2 cell monolayers, IL-6 decreased the TER in both a dose-dependent and time-dependent manner, indicating increased TJ permeability to ionic solutes (Fig. 1, A and B), without eliciting any changes to the permeance of the nonionic macromolecule 4 kDa dextran (Fig. 1C). Fig. 1A shows that the addition of ≥ 2.5 ng/ml IL-6 to the culture medium for 48 h induced significant decreases in the TER, and that the TER decreased to ∼70% of pretreatment level in the presence of 10 ng/ml IL-6. Fig. 1B shows that the TER readings taken after treatment with 5 ng/ml IL-6 at 24, 48, and 72 h, and after treatment with 10 ng/ml IL-6 at 12, 24, 48, and 72 h, were lower than the control values at each time point. Although the induction of apoptosis is known to decrease the TER, IL-6 (∼50 ng/ml) did not affect the cell viability (Fig. 1D). IL-6 also decreased the TER in another intestinal epithelial T84 cells in a similar manner to the Caco-2 cells, indicating that the IL-6-induced effect is not confined to the Caco-2 cells (supplemental Fig. S1).
FIGURE 1.
IL-6 increases TJ permeability to ionic solutes without any changes to dextran flux or cell viability. A, TER was measured across Caco-2 cell monolayers incubated with varying concentrations of IL-6 (0∼100 ng/ml) for 48 h. *, p < 0.05 relative to the control value. B, TER was measured across cell monolayers before incubation and 3, 6, 12, 24, 48, and 72 h after incubation with IL-6 (0, 5, and 10 ng/ml). *, p < 0.05 relative to the control value at each time point. C and D, unidirectional FITC-dextran flux (C) was evaluated across Caco-2 cell monolayers incubated with varying concentrations of IL-6 (0∼50 ng/ml) for 48 h, and cell viability was assessed by WST assay (D). E–G, NaCl dilution potentials were measured across Caco-2 cell monolayers incubated with or without 10 ng/ml IL-6 for 48 h by the basal substitution of 65 mm NaCl with 130 mm mannitol. Representative electrophysiologic measurements (D), the statistical analysis of the dilution potentials, and PNa+/PCl− calculated from stable dilution potentials (G) are shown. *, p < 0.05 relative to the control value. Values represent the mean ± S.E. (n = 6).
To determine the ion selectivity of Caco-2 cell monolayers incubated without or with IL-6, the dilution potentials were measured under an apicobasal chemical gradient of NaCl (Fig. 1, E–G). Fig. 1, E and F show that the treatment with 10 ng/ml IL-6 increased the NaCl dilution potential in the Caco-2 cells. As calculated from the dilution potential by the Goldman-Hodgkin-Katz equation, permeability of Na+ relative to Cl− (PNa+/PCl−) was increased by IL6 treatment (Fig. 1G).
IL-6 Induces Claudin-2 Expression
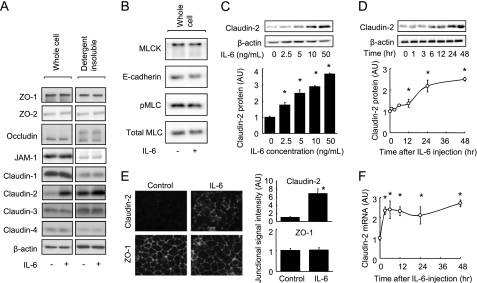
Because intestinal TJ permeability is regulated by TJ structure, we examined the effect of IL-6 on both the total expression of TJ proteins and on TJ proteins associated with the actin cytoskeleton in Caco-2 cell monolayers. Treatment of cells with 10 ng/ml IL-6 for 48 h increased claudin-2 protein expression in whole cell extracts and detergent-insoluble fractions (which corresponds to the actin cytoskeletal fraction) but did not affect the levels of other TJ proteins (ZO-1, ZO-2, occludin, JAM-1, claudin-1, claudin-3, or claudin-4) (Fig. 2A). It is known that claudin-2 expression decreases the tightness of the intestinal TJ barrier, due to the fact that claudin-2 forms paracellular cation channels. Furthermore, IL-6 had no effect on the expression of E-cadherin, MLCK, or on MLC phosphorylation (Fig. 2B), indicating that IL-6 is unlikely to regulate adherence junctions or cytoskeletal contraction. Fig. 2, C and D show increases in total claudin-2 protein levels in response to IL-6, occurring both dose-dependently and time-dependently. Treatment with 2.5, 5.0, 10, and 50 ng/ml IL-6 for 48 h significantly elevated claudin-2 protein expression (Fig. 2C). Increases in claudin-2 expression in response to 10 ng/ml IL-6 became apparent 6 h after treatment, but the most pronounced increases were observed at 24 and 48 h (Fig. 2D). The IL-6-induced claudin-2 expression was also observed in the T84 cell monolayers (supplemental Fig. S1). Increases in claudin-2 protein expression in response to IL-6 were confirmed using immunofluorescence microscopy (Fig. 2E). IL-6 enhanced the signal intensity of immunolabeled claudin-2, but not of ZO-1, in the junctional region of Caco-2 cell monolayers. To assess transcriptional regulation, claudin-2 mRNA was quantified by qPCR. Fig. 2E demonstrates that IL-6 treatment led to an increase in claudin-2 mRNA levels. These results show that the IL-6-induced increase in TJ permeability to Na+ is due to elevated claudin-2 expression in Caco-2 cells.
FIGURE 2.
IL-6 induces claudin-2 expression in Caco-2 cells. A, whole cell extracts and detergent-insoluble fractions of Caco-2 cell monolayers incubated in the absence or presence of IL-6 (10 ng/ml) for 48 h were immunoblotted for ZO-1, ZO-2, occludin, JAM-1, claudin-1, claudin-2, claudin-3, claudin-4, and β-actin. B, whole cell extracts of Caco-2 cell monolayers incubated in the absence or presence of IL-6 (10 ng/ml) for 48 h were immunoblotted for MLCK, E-cadherin, pMLC, and total MLC. C, whole cell extracts of Caco-2 cell monolayers incubated with varying concentrations of IL-6 (0∼50 ng/ml) for 48 h were immunoblotted for claudin-2 and β-actin. Specific bands for claudin-2 were quantitated by densitometric analysis. D, whole cell extracts of Caco-2 cell monolayers before and 1, 3, 6, 12, 24, 48 h after incubation with IL-6 (10 ng/ml) were immunoblotted for claudin-2 and β-actin. Specific bands for claudin-2 were quantitated by densitometric analysis. E, Caco-2 cell monolayers incubated in the absence or presence of IL-6 (10 ng/ml) for 48 h were immunolabeled for claudin-2 and ZO-1. The fluorescent signal intensity of claudin-2 and ZO-1 in the junctional region of cells was quantified. F, claudin-2 mRNA expression was analyzed by qPCR in cell monolayers before incubation and 3, 6, 12, 24, and 48 h after incubation with IL-6 (10 ng/ml). *, p < 0.05 relative to the control value (IL-6-free or pretreatment levels). Values represent the mean ± S.E. (n = 4).
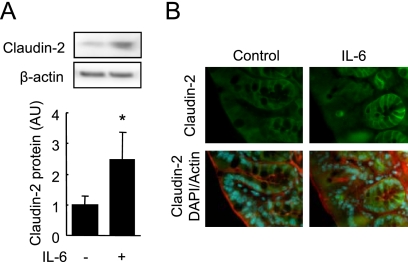
To investigate whether IL-6 induced claudin-2 expression in vivo, we evaluated claudin-2 expression in mouse colons 16 h after IL-6 injection. Immunoblot analysis revealed that claudin-2 levels in the colons of mice injected with IL-6 were higher than those of the control mice (Fig. 3A). Immunofluorescence microscopy showed that claudin-2 expression was concentrated in the crypt epithelial cells of control mice, as previously reported (15), and the signal intensity was markedly increased after IL-6 injection (Fig. 3B).
FIGURE 3.
IL-6 induced claudin-2 expression in vivo. Mice were intraperitoneally injected with IL-6 or PBS (vehicle). Colonic mucosae were immunoblotted for claudin-2 and β-actin (A), and cryosections (8 μm in thickness) of colon were triple-labeled for claudin-2 (green), actin (red), and total DNA (blue) (B). Specific bands for claudin-2 were quantitated by densitometric analysis (A). Values represent the mean ± S.E. (n = 4). *, p < 0.05 relative to the control value.
Signaling Pathway
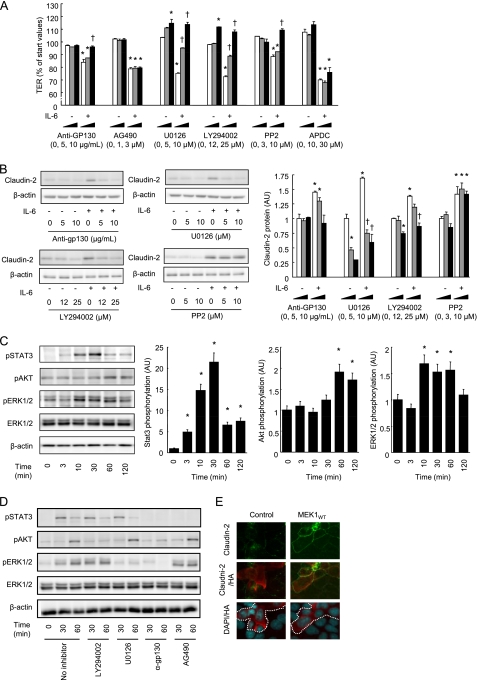
We then explored possible signaling pathways involved in IL-6-mediated increases in TJ permeability and claudin-2 expression. It has been reported that the binding of IL-6 to IL-6 receptor (gp80) induces the homodimerization of gp130, a signal-transducing subunit, which triggers several different signaling pathways including JAK/STAT, MEK/ERK, PI3K/Akt, cSrc, and NFκB. Fig. 4A shows that the IL-6-mediated decrease in TER was suppressed by anti-gp130, U0126 (a MEK inhibitor), LY294002 (a PI3K inhibitor), and PP2 (a cSrc inhibitor), but not by AG490 (a JAK inhibitor) or APDC (a NFκB inhibitor) in Caco-2 cell monolayers. Immunoblot analysis (Fig. 4B) further demonstrated that IL-6-induced claudin-2 expression was highly sensitive to the inhibition of gp130, MEK, and PI3K, but not cSrc. The results show that IL-6 induced the phosphorylation of STAT3, ERK1/2, and Akt (Fig. 4C), which were specifically or totally prevented by each inhibitor or anti-gp130 (Fig. 4D). Because of the possibility that MEK activation may have a primary role in IL-6-induced claudin-2 expression, Caco-2 cells were transiently transfected with MEK1wt-HA plasmid and triple-labeled for claudin-2 (green), MEK1-HA (red), and total DNA (blue), as shown in Fig. 4E. Cells expressing MEK1wt-HA demonstrated both enhanced expression and junctional distribution of claudin-2, while transfection of the control vector did not affect claudin-2 expression. These results indicate that the IL-6-mediated activation of the MEK/ERK and PI3K pathways, via gp130 subunit/IL-6Rα interaction, leads to enhanced claudin-2 expression resulting in increases in cation-selective TJ permeability.
FIGURE 4.
The MEK/ERK and PI3K pathways have a role in IL-6-mediated claudin-2 expression and TJ permeability. A, TER was measured across Caco-2 cell monolayers incubated in IL-6-free medium or in medium containing 10 ng/ml IL-6 in the absence or presence of signaling inhibitors (anti-gp130; AG490, a JAK kinase inhibitor; U0126, a MEK inhibitor; LY294002, a PI3K inhibitor; PP2, a Src inhibitor; APDC, a NFκB inhibitor) for 48 h. B, whole cell extracts of Caco-2 cell monolayers incubated in IL-6-free medium or in medium containing 10 ng/ml IL-6 in the absence or presence of signaling inhibitors (anti-gp130; U0126, a MEK inhibitor; LY294002, a PI3K inhibitor; PP2, a Src inhibitor) for 48 h were immunoblotted for claudin-2 and β-actin. Specific bands for claudin-2 were quantitated by densitometric analysis. *, p < 0.05 relative to control without inhibitors. †, p < 0.05 relative to IL-6 without inhibitors. C, whole cell extracts of Caco-2 cell monolayers before incubation and 3, 10, 30, 60, and 120 min after incubation with IL-6 (10 ng/ml) were immunoblotted for pSTAT3, pERK1/2, pAkt, total ERK, and β-actin. Specific bands for pSTAT3, pERK1/2, and pAkt were quantitated by densitometric analysis. *, p < 0.05 relative to the pretreatment value. D, whole cell extracts of Caco-2 cell monolayers before incubation and 30 and 60 min after incubation with IL-6 (10 ng/ml) in the absence or presence of signaling inhibitors (anti-gp130, U0126, and LY294002) were immunoblotted for pSTAT3, pERK1/2, pAkt, total ERK, and β-actin. E, Caco-2 cells were transiently transfected with control or MEKwt-HA plasmids, fixed, and triple-labeled for claudin-2 (green), HA-tag (red), and total DNA (blue). Areas encircled by a dotted line indicate transfected cells (MEKwt-HA or HA-expressing cells). *, p < 0.05 relative to the control value. Values represent mean ± S.E. (n = 4).
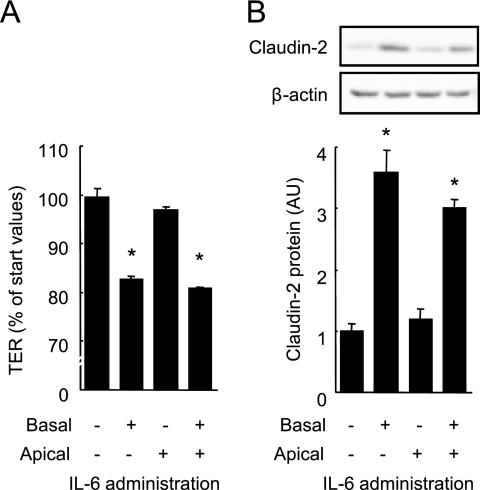
Fig. 5, A and B show the decrease in TER and increase in claudin-2 expression induced by IL-6 when applied to the basolateral, but not the apical sides of cell monolayers. Confocal microscopy reveals that gp130 is predominantly expressed at the basolateral surface of Caco-2 cells while gp80, an IL-6 receptor, is expressed at both apical and basolateral surfaces (supplemental Fig. S2) in agreement with a previous study (32).
FIGURE 5.
IL-6 induces claudin-2 expression and increases TJ permeability from basal sides. IL-6 (10 ng/ml) was applied to the apical and/or basal aspects of Caco-2 cell monolayers. After 48 h, TER across the monolayers was measured (A) and the whole cell extracts were immunoblotted for claudin-2 (B). Specific bands for claudin-2 were quantitated by densitometric analysis. *, p < 0.05 relative to the control value. Values represent the mean ± S.E. (n = 4).
IL-6 Enhances Claudin-2 Promoter Activity
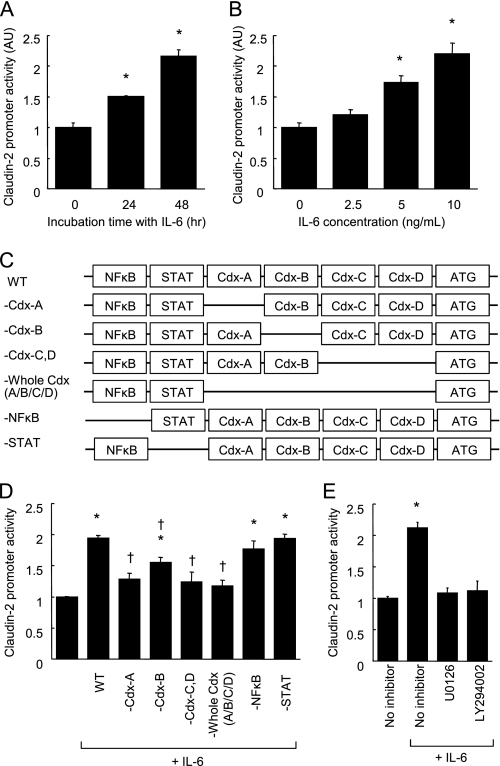
Because IL-6 induces claudin-2 expression at the transcriptional level, we examined whether IL-6 could enhance claudin-2 promoter activity in Caco-2 cell monolayers by means of a reporter gene assay. As seen in Fig. 6, A and B, IL-6 enhanced claudin-2 promoter activity in a time and dose-dependent manner. Claudin-2 promoter activity in cells incubated with IL-6 for 48 h was elevated more than 200% above control activity.
FIGURE 6.
IL-6 enhances claudin-2 promoter activity in a Cdx binding site-dependent manner. A and B, claudin-2 reporter gene plasmids were transfected to Caco-2 cells. Luciferase activity was measured in the cell monolayers incubated in the absence or presence of IL-6 (10 ng/ml) for 24 and 48 h (A). Luciferase activity was measured in Caco-2 cell monolayers incubated with varying concentrations of IL-6 (0–10 ng/ml) for 48 h (B). *, p < 0.05 relative to control treatment. C, schematic drawings of transcriptional binding sites in the WT-claudin-2 promoter and deletion mutants. D, WT-claudin-2 reporter gene plasmids and the deletion mutant plasmids were transfected to Caco-2 cells. Luciferase activity was measured in the cell monolayers incubated in the absence or presence of IL-6 (10 ng/ml) for 48 h. *, p < 0.05 relative to control treatment. †, p < 0.05 relative to WT-claudin-2 with IL-6. E, WT-claudin-2 reporter gene plasmid was transfected to Caco-2 cells. Luciferase activity was measured in the cell monolayers incubated in IL-6-free medium or in medium containing 10 ng/ml IL-6 in the absence or presence of signaling inhibitors (U0126, a MEK inhibitor; LY294002, a PI3K inhibitor) for 48 h. *, p < 0.05 relative to control treatment. Values represent the mean ± S.E. (n = 4).
IL-6-induced Claudin-2 Promoter Activity Requires Cdx Binding Sites
We next employed a site-directed mutagenesis technique to identify the transcriptional factors by which IL-6 induced claudin-2 expression. A search program for transcriptional factor binding sites, TFSEARCH (Real World Computing Partnership), detected putative 4 Cdx, STAT, and NFκB binding sites in the claudin-2 promoter sequence (−1067 to −1 bp upstream of the translational start site, supplemental Fig. S3). To investigate the relative contribution of these binding sites to IL-6-mediated enhancement of claudin-2 expression, deletion mutations were introduced to remove them from the WT-claudin-2 promoter sequence (Fig. 6C). Deletions of STAT and NFκB binding sites did not affect the claudin-2 promoter activity induced by IL-6 in Caco-2 cell monolayers (Fig. 6D), consistent with our earlier finding, which showed that IL-6-induced claudin-2 expression was not sensitive to JAK/STAT or NFκB inhibitors. In contrast, deletions of one or all of the 4 Cdx binding sites (-Cdx-A, -Cdx-B, -Cdx-C/D, and -Cdx-A/B/C/D) clearly suppressed the promoter activity of IL-6, although the suppression resulting from the deletion of the 2nd Cdx binding site (-Cdx-B) was partial. These results demonstrated that IL-6-induced claudin-2 expression required Cdx binding sites in the claudin-2 promoter sequence. In addition, IL-6-induced claudin-2 promoter activity was attenuated by MEK and PI3K inhibitors (Fig. 6E).
IL-6 Induces Cdx2 Expression
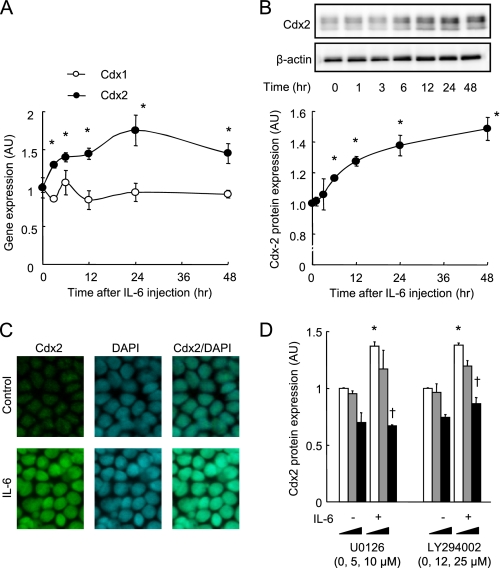
Our results from the reporter assay suggested that Cdx protein expression is involved in IL-6-mediated increases in claudin-2 expression. Therefore, studies were conducted to investigate the effect of IL-6 on Cdx expression. As seen in Fig. 7A, treatment with IL-6 (10 ng/ml) induced an increase in the mRNA level of Cdx2, but not Cdx1, in Caco-2 cell monolayers. Immunoblot analysis revealed that 10 ng/ml IL-6 increased Cdx2 protein in a time-dependent manner, and that the Cdx2 level increased to 150% of the initial level after incubation for 48 h (Fig. 7B). To examine Cdx2 localization, cells incubated in the absence or presence of IL-6 for 48 h were double-labeled to reveal Cdx2 (green) and total DNA (blue), as shown in Fig. 7C. Cdx2 was co-localized with the nucleus in the cells in both the absence and presence of IL-6, but the signal intensity of immunolabeled Cdx2 was markedly enhanced by IL-6 treatment. Because we have evidence to indicate that the MEK/ERK and PI3K pathways have a role in IL-6-induced claudin-2 expression, the effects of the inhibition of these enzymes on the Cdx2 expression induced by IL-6 were examined (Fig. 7D). The IL-6-induced increase in Cdx2 expression was suppressed by U0126 (a MEK inhibitor) and LY294002 (a PI3K inhibitor). These results indicate that the increased Cdx2 expression elicited by IL-6 leads to claudin-2 promoter activation resulting in raised claudin-2 expression, and that the MEK/ERK and PI3K pathways also play a role in regulating Cdx2 expression (Fig. 8).
FIGURE 7.
IL-6 induces Cdx2 expression in Caco-2 cells. A and B, Caco-2 cell monolayers were incubated with IL-6 (10 ng/ml) for 48 h. Cdx1 and Cdx2 mRNA expression was quantified with qPCR (A), and Cdx2 protein expression quantified with immunoblotting in cell monolayers before incubation and 3, 6, 12, 24, 48 h after incubation with 10 ng/ml IL-6. Specific bands for Cdx-2 were quantitated by densitometric analysis. *, p < 0.05 relative to 0 h. C, cell monolayers incubated in the absence or presence of IL-6 (10 ng/ml) were double-labeled for Cdx2 (green) and total DNA (blue). D, whole cell extracts of Caco-2 cell monolayers incubated in IL-6-free medium or in medium containing 10 ng/ml IL-6 in the absence or presence of signaling inhibitors (U0126, a MEK inhibitor; LY294002, a PI3K inhibitor) for 48 h were immunoblotted for Cdx2. Specific bands for Cdx-2 were quantitated by densitometric analysis. *, p < 0.05 relative to control without inhibitors. †, p < 0.05 relative to IL-6 without inhibitors. Values represent the mean ± S.E. (n = 4).
FIGURE 8.
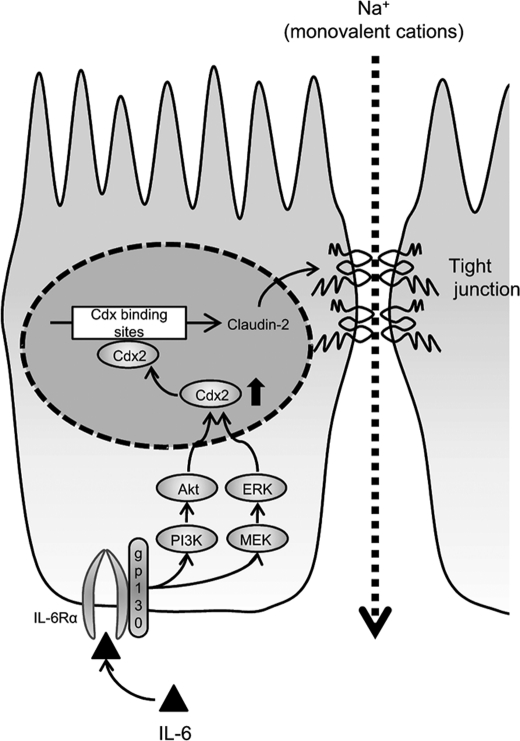
Schematic representation showing the mechanism for the IL-6-mediated increase in the TJ permeability in intestinal epithelium cells. IL-6 activates the MEK/ERK and PI3K/Akt pathways through gp130/IL-6Rα interaction, which in turn enhances Cdx2 expression. The enhanced Cdx2 expression activates the claudin-2 promoter resulting in the increase in claudin-2 expression.
DISCUSSION
IBDs such as ulcerative colitis and Crohn's disease involve impairment of epithelial barrier function, which is characterized by a change in TJ protein expression and distribution (29). A growing body of evidence suggests that this barrier dysfunction is associated with the release of TNFα (11, 33), IFNγ (11, 12), IL-1β (13), and IL-13 (14, 15); however, the precise pathologic mechanism remains unclear. In this study, we have characterized for the first time the role of IL-6 as a cytokine that induces TJ permeability to cations including Na+, via a pathway involving claudin-2 expression. IL-6 is one of the major cytokines that is produced in substantially higher amounts in both the serum and tissues of patients with active IBD, where the levels have been shown to correlate with the severity of disease (18–20). However, the role of IL-6 in the regulation of intestinal barrier is less unclear than those for other cytokines. Wang et al. demonstrate that IL-6 suppresses the paracellular dextran flux in Caco-2 cells and that the IL-6 knock-out exacerbates the increased colonic permeability induced by the dextran sulfate sodium in mice (34). These data suggest that IL-6 may increase or protect the intestinal barrier integrity under some conditions. In contrast, many other studies demonstrate that IL-6 has roles in the intestinal barrier dysfunction and colitis progression. Yang et al. have reported that the intestinal barrier integrity is preserved in the IL-6 knock-out mice after hemorrhagic shock and resuscitation (35). Further, the knock-out and blockade of IL-6 and IL-6 receptor suppress experimental colitis in mice (21–24). In agreement with the latter studies, our results suggest that IL-6 contributes to the intestinal barrier defect in IBD patients in concert with the other cytokines mentioned above.
The TJ permeability is associated with claudin expression (1). Overexpression of claudin-1 and -4 increases TER; claudin-2 overexpression, on the other hand, decreases TER as a result of its ability to promote cation channel formation (27, 28, 36). Our results indicate that the increase in the TJ permeability to ionic solutes (Fig. 1, A and B) but not to uncharged macromolecules (Fig. 1C) mediated by IL-6, stems entirely from increased claudin-2 expression (Fig. 2, A–E) in intestinal Caco-2 cells. Further, the detailed analysis of ion selectivity shows that IL-6 increases PNa+/PCl− in the cells (Fig. 2, E–G). In keeping with these, a marked increase in claudin-2 expression was observed in the colons of the mice injected intraperitoneally with IL-6 (Fig. 3, A and B). Studies have demonstrated that claudin-2 expression is higher in the colons of IBD patients, typically those suffering from Crohn disease and ulcerative colitis (29). TNFα and IL-13 are now known to induce claudin-2 expression in cultured intestinal cell monolayers and mouse colon (14, 15, 33). Our results suggest that IL-6 also plays a role in the elevation of colonic epithelial claudin-2 levels in IBD patients.
The IL-6-mediated signaling pathways leading to claudin-2 expression operate via an IL-6Rα-coupled signal transducer, gp130 (Fig. 4, A and B). The finding that IL-6 induces claudin-2 expression at the basolateral aspects of cell monolayers (Fig. 5, E and F) is consistent with the fact that gp130 is expressed predominantly on the basolateral membrane (supplemental Fig. S2) (32). IL-6-induced TJ permeability and claudin-2 expression are sensitive to the inhibition of the MEK/ERK and PI3K pathways (Fig. 4, A and B). Further, IL-6 induces the phosphorylation of ERK and Akt. Some previous reports have illustrated the importance of MEK and PI3K in epithelial claudin-2 expression. Kinugasa et al. have shown that the MEK/ERK pathway is required for IL-17-mediated claudin-2 expression in intestinal T84 cells (37). PI3K activity has been shown to be required for TNFα- and IL-13-induced claudin-2 expression (15, 33). The colonic epithelium of active Crohn disease and ulcerative colitis patients also exhibits higher pERK and pAkt activity, suggesting that activated signaling pathways might be associated with the dysregulation of epithelial function in IBD (38). Our results demonstrated that increased phosphorylation of ERK and Akt is required for the IL-6-mediated claudin-2 expression leading to cation-selective TJ permeability.
We also demonstrated the involvement of Cdx2, a transcriptional factor, in the transcriptional regulation of claudin-2 by IL-6 (Figs. 6 and 7). Previous studies have suggested that Cdx2 plays a critical role in both the transcriptional regulation of intestinal genes, including claudin-2, and the differentiation of intestinal epithelial cells (38). Cdx2 expression is localized only in the epithelial cells at the luminal surface in normal colons, while it occurs also in the colonic crypt in Crohn disease and ulcerative colitis patients (38). This increase in Cdx2 expression seems to be associated with the increase in claudin-2 expression seen in these patients. In addition, it has been reported that Cdx2 overexpression results in the transcriptional activation of claudin-2 promoter (39), and that claudin-2 expression correlates with Cdx2 expression in mouse intestines when expression is analyzed in a longitudinal direction (40). These lines of evidence support the notion that Cdx2-dependent claudin-2 induction by IL-6 is one of the mechanisms underlying the elevated claudin-2 expression seen in the IBD patients.
In conclusion, this study demonstrated that IL-6 increases the cation-selective TJ permeability through an enhancement of claudin-2 expression in intestinal epithelial cells. The induction of claudin-2 expression requires increases in Cdx2 transcriptional factor levels brought about via the MEK/ERK and PI3K pathways.
Supplementary Material
Acknowledgment
We thank Dr. Natalie Ahn (University of Colorado) for providing the MEK1wt-HA plasmid.
This work was supported by the Japan Society for the Promotion of Science, Grant-in-Aid for Young Scientists (B) 21780117.

The on-line version of this article (available at http://www.jbc.org) contains supplemental Figs. S1–S3 and Tables S1 and S2.
- TJ
- tight junction
- APDC
- ammonium pyrrolidinedithiocarbamate
- Cdx
- caudal-related homeobox
- IBD
- inflammatory bowel disease
- JAM
- junctional adhesion molecule
- MLCK
- myosin light chain kinase
- TER
- transepithelial electrical resistance
- ZO
- zonula occludens.
REFERENCES
- 1. González-Mariscal L., Betanzos A., Nava P., Jaramillo B. E. (2003) Prog. Biophys. Mol. Biol. 81, 1–44 [DOI] [PubMed] [Google Scholar]
- 2. Furuse M., Hirase T., Itoh M., Nagafuchi A., Yonemura S., Tsukita S. (1993) J. Cell Biol. 123, 1777–1788 [DOI] [PMC free article] [PubMed] [Google Scholar]
- 3. Furuse M., Fujita K., Hiiragi T., Fujimoto K., Tsukita S. (1998) J. Cell Biol. 141, 1539–1550 [DOI] [PMC free article] [PubMed] [Google Scholar]
- 4. Martìn-Padura I., Lostaglio S., Schneemann M., Williams L., Romano M., Fruscella P., Panzeri C., Stoppacciaro A., Ruco L., Villa A., Simmons D., Dejana E. (1998) J. Cell Biol. 142, 117–127 [DOI] [PMC free article] [PubMed] [Google Scholar]
- 5. Ikenouchi J., Furuse M., Furuse K., Sasaki H., Tsukita S. (2005) J. Cell Biol. 171, 939–945 [DOI] [PMC free article] [PubMed] [Google Scholar]
- 6. Suzuki T., Seth A., Rao R. (2008) J. Biol. Chem. 283, 3574–3583 [DOI] [PubMed] [Google Scholar]
- 7. Suzuki T., Elias B. C., Seth A., Shen L., Turner J. R., Giorgianni F., Desiderio D., Guntaka R., Rao R. (2009) Proc. Natl. Acad. Sci. U.S.A. 106, 61–66 [DOI] [PMC free article] [PubMed] [Google Scholar]
- 8. Basuroy S., Seth A., Elias B., Naren A. P., Rao R. (2006) Biochem. J. 393, 69–77 [DOI] [PMC free article] [PubMed] [Google Scholar]
- 9. Sheth P., Basuroy S., Li C., Naren A. P., Rao R. K. (2003) J. Biol. Chem. 278, 49239–49245 [DOI] [PubMed] [Google Scholar]
- 10. Nunbhakdi-Craig V., Machleidt T., Ogris E., Bellotto D., White C. L., 3rd, Sontag E. (2002) J. Cell Biol. 158, 967–978 [DOI] [PMC free article] [PubMed] [Google Scholar]
- 11. Wang F., Graham W. V., Wang Y., Witkowski E. D., Schwarz B. T., Turner J. R. (2005) Am. J. Pathol. 166, 409–419 [DOI] [PMC free article] [PubMed] [Google Scholar]
- 12. Bruewer M., Luegering A., Kucharzik T., Parkos C. A., Madara J. L., Hopkins A. M., Nusrat A. (2003) J. Immunol. 171, 6164–6172 [DOI] [PubMed] [Google Scholar]
- 13. Al-Sadi R., Ye D., Dokladny K., Ma T. Y. (2008) J. Immunol. 180, 5653–5661 [DOI] [PMC free article] [PubMed] [Google Scholar]
- 14. Heller F., Florian P., Bojarski C., Richter J., Christ M., Hillenbrand B., Mankertz J., Gitter A. H., Bürgel N., Fromm M., Zeitz M., Fuss I., Strober W., Schulzke J. D. (2005) Gastroenterology 129, 550–564 [DOI] [PubMed] [Google Scholar]
- 15. Weber C. R., Raleigh D. R., Su L., Shen L., Sullivan E. A., Wang Y., Turner J. R. (2010) J. Biol. Chem. 285, 12037–12046 [DOI] [PMC free article] [PubMed] [Google Scholar]
- 16. Alonzi T., Fattori E., Lazzaro D., Costa P., Probert L., Kollias G., De Benedetti F., Poli V., Ciliberto G. (1998) J. Exp. Med. 187, 461–468 [DOI] [PMC free article] [PubMed] [Google Scholar]
- 17. Tilg H., Dinarello C. A., Mier J. W. (1997) Immunol. Today 18, 428–432 [DOI] [PubMed] [Google Scholar]
- 18. Kusugami K., Fukatsu A., Tanimoto M., Shinoda M., Haruta J., Kuroiwa A., Ina K., Kanayama K., Ando T., Matsuura T. (1995) Dig. Dis. Sci. 40, 949–959 [DOI] [PubMed] [Google Scholar]
- 19. Louis E., Belaiche J., van Kemseke C., Franchimont D., de Groote D., Gueenen V., Mary J. Y. (1997) Eur. J. Gastroenterol. Hepatol. 9, 939–944 [DOI] [PubMed] [Google Scholar]
- 20. Reinisch W., Gasché C., Tillinger W., Wyatt J., Lichtenberger C., Willheim M., Dejaco C., Waldhör T., Bakos S., Vogelsang H., Gangl A., Lochs H. (1999) Am. J. Gastroenterol. 94, 2156–2164 [DOI] [PubMed] [Google Scholar]
- 21. Yamamoto M., Yoshizaki K., Kishimoto T., Ito H. (2000) J. Immunol. 164, 4878–4882 [DOI] [PubMed] [Google Scholar]
- 22. Atreya R., Mudter J., Finotto S., Müllberg J., Jostock T., Wirtz S., Schutz M., Bartsch B., Holtmann M., Becker C., Strand D., Czaja J., Schlaak J. F., Lehr H. A., Autschbach F., Schürmann G., Nishimoto N., Yoshizaki K., Ito H., Kishimoto T., Galle P. R., Rose-John S., Neurath M. F. (2000) Nat. Med. 6, 583–588 [DOI] [PubMed] [Google Scholar]
- 23. Suzuki A., Hanada T., Mitsuyama K., Yoshida T., Kamizono S., Hoshino T., Kubo M., Yamashita A., Okabe M., Takeda K., Akira S., Matsumoto S., Toyonaga A., Sata M., Yoshimura A. (2001) J. Exp. Med. 193, 471–481 [DOI] [PMC free article] [PubMed] [Google Scholar]
- 24. Sander L. E., Obermeier F., Dierssen U., Kroy D. C., Singh A. K., Seidler U., Streetz K. L., Lutz H. H., Müller W., Tacke F., Trautwein C. (2008) J. Immunol. 181, 3586–3594 [DOI] [PubMed] [Google Scholar]
- 25. Colegio O. R., Van Itallie C. M., McCrea H. J., Rahner C., Anderson J. M. (2002) Am. J. Physiol. Cell Physiol. 283, C142–C147 [DOI] [PubMed] [Google Scholar]
- 26. Furuse M., Hata M., Furuse K., Yoshida Y., Haratake A., Sugitani Y., Noda T., Kubo A., Tsukita S. (2002) J. Cell Biol. 156, 1099–1111 [DOI] [PMC free article] [PubMed] [Google Scholar]
- 27. Inai T., Kobayashi J., Shibata Y. (1999) Eur. J. Cell Biol. 78, 849–855 [DOI] [PubMed] [Google Scholar]
- 28. Amasheh S., Meiri N., Gitter A. H., Schöneberg T., Mankertz J., Schulzke J. D., Fromm M. (2002) J. Cell Sci. 115, 4969–4976 [DOI] [PubMed] [Google Scholar]
- 29. Prasad S., Mingrino R., Kaukinen K., Hayes K. L., Powell R. M., MacDonald T. T., Collins J. E. (2005) Lab. Invest. 85, 1139–1162 [DOI] [PubMed] [Google Scholar]
- 30. Günzel D., Stuiver M., Kausalya P. J., Haisch L., Krug S. M., Rosenthal R., Meij I. C., Hunziker W., Fromm M., Müller D. (2009) J. Cell Sci. 122, 1507–1517 [DOI] [PubMed] [Google Scholar]
- 31. Mansour S. J., Matten W. T., Hermann A. S., Candia J. M., Rong S., Fukasawa K., Vande Woude G. F., Ahn N. G. (1994) Science 265, 966–970 [DOI] [PubMed] [Google Scholar]
- 32. Wang L., Walia B., Evans J., Gewirtz A. T., Merlin D., Sitaraman S. V. (2003) J. Immunol. 171, 3194–3201 [DOI] [PubMed] [Google Scholar]
- 33. Mankertz J., Amasheh M., Krug S. M., Fromm A., Amasheh S., Hillenbrand B., Tavalali S., Fromm M., Schulzke J. D. (2009) Cell Tissue Res. 336, 67–77 [DOI] [PubMed] [Google Scholar]
- 34. Wang L., Srinivasan S., Theiss A. L., Merlin D., Sitaraman S. V. (2007) J. Biol. Chem. 282, 8219–8227 [DOI] [PubMed] [Google Scholar]
- 35. Yang R., Han X., Uchiyama T., Watkins S. K., Yaguchi A., Delude R. L., Fink M. P. (2003) Am. J. Physiol. Gastrointest. Liver Physiol. 285, G621–G629 [DOI] [PubMed] [Google Scholar]
- 36. Van Itallie C., Rahner C., Anderson J. M. (2001) J. Clin. Invest. 107, 1319–1327 [DOI] [PMC free article] [PubMed] [Google Scholar]
- 37. Kinugasa T., Sakaguchi T., Gu X., Reinecker H. C. (2000) Gastroenterology 118, 1001–1011 [DOI] [PubMed] [Google Scholar]
- 38. Dahan S., Roda G., Pinn D., Roth-Walter F., Kamalu O., Martin A. P., Mayer L. (2008) Gastroenterology 134, 192–203 [DOI] [PMC free article] [PubMed] [Google Scholar]
- 39. Mankertz J., Hillenbrand B., Tavalali S., Huber O., Fromm M., Schulzke J. D. (2004) Biochem. Biophys. Res. Commun. 314, 1001–1007 [DOI] [PubMed] [Google Scholar]
- 40. Sakamoto H., Mutoh H., Sugano K. (2010) Scand. J. Gastroenterol. 45, 1273–1280 [DOI] [PubMed] [Google Scholar]
Associated Data
This section collects any data citations, data availability statements, or supplementary materials included in this article.


