Abstract
The hyperthermophilic crenarchaeon Sulfolobus solfataricus P2 encodes three B-family DNA polymerase genes, B1 (Dpo1), B2 (Dpo2), and B3 (Dpo3), and one Y-family DNA polymerase gene, Dpo4, which are related to eukaryotic counterparts. Both mRNAs and proteins of all four DNA polymerases were constitutively expressed in all growth phases. Dpo2 and Dpo3 possessed very low DNA polymerase and 3′ to 5′ exonuclease activities in vitro. Steady-state kinetic efficiencies (kcat/Km) for correct nucleotide insertion by Dpo2 and Dpo3 were several orders of magnitude less than Dpo1 and Dpo4. Both the accessory proteins proliferating cell nuclear antigen and the clamp loader replication factor C facilitated DNA synthesis with Dpo3, as with Dpo1 and Dpo4, but very weakly with Dpo2. DNA synthesis by Dpo2 and Dpo3 was remarkably decreased by single-stranded binding protein, in contrast to Dpo1 and Dpo4. DNA synthesis in the presence of proliferating cell nuclear antigen, replication factor C, and single-stranded binding protein was most processive with Dpo1, whereas DNA lesion bypass was most effective with Dpo4. Both Dpo2 and Dpo3, but not Dpo1, bypassed hypoxanthine and 8-oxoguanine. Dpo2 and Dpo3 bypassed uracil and cis-syn cyclobutane thymine dimer, respectively. High concentrations of Dpo2 or Dpo3 did not attenuate DNA synthesis by Dpo1 or Dpo4. We conclude that Dpo2 and Dpo3 are much less functional and more thermolabile than Dpo1 and Dpo4 in vitro but have bypass activities across hypoxanthine, 8-oxoguanine, and either uracil or cis-syn cyclobutane thymine dimer, suggesting their catalytically limited roles in translesion DNA synthesis past deaminated, oxidized base lesions and/or UV-induced damage.
Keywords: Archaebacteria, DNA Damage, DNA Polymerase, DNA Replication, Enzyme Purification, Enzymes
Introduction
The timely and faithful replication of genomic information by DNA polymerases is crucial for survival in all living organisms (1). An important issue in understanding chromosomal DNA replication is why so many different kinds of DNA polymerases exist and how they function differently and can be regulated in cells, with the discovery of at least 10 new human DNA polymerases during the past 12 years (2). Numerous DNA polymerases from the bacterial, eukaryal, and archaeal domains of life are divided into six families (A, B, C, D, X, and Y) (3), some of which have been suggested to be utilized for replicative and/or non-replicative tasks, such as DNA repair, translesion DNA synthesis, and hypermutation (4), but their precise roles are still in question. The information-processing systems of eukarya are considered to be more similar to those of archaea rather than to bacteria (5, 6), offering a practical advantage of studying archaeal systems as a model for DNA replication. Indeed, many of the B-family DNA polymerases in eukaryotes and archaea, but not in bacteria, are believed to be mainly involved in chromosomal DNA replication (7). Crenarchaeota has only B-family (but at least two) replicative DNA polymerases, whereas Eryarchaeota has one B-family and one D-family replicative DNA polymerase (7).
Sulfolobus solfataricus, a thermoacidophilic crenarchaeon that grows optimally at ∼80 °C (60–92 °C) and pH 2–4 (8), has been regarded as an attractive model for DNA replication studies due to its completely sequenced genome (9), the simplicity of eukaryote-like replication machinery, and high protein thermostability (10). S. solfataricus P2 encodes three B-family DNA polymerases, B1 (Dpo1), B2 (Dpo2), and B3 (Dpo3), which appear to be similar to eukaryotic systems possessing multiple B-family members (e.g. DNA polymerases α, δ, ϵ, and ζ), in addition to the Y-family member DNA polymerase Y1 (Dpo4). Dpo1 has been reported to catalyze DNA polymerization with high fidelity but is blocked at DNA lesions (11, 12), whereas the error-prone Dpo4 bypasses a variety of DNA lesions (13). However, catalytic functions of two other B-family DNA polymerases, Dpo2 and Dpo3, have not been biochemically characterized, although the nucleotide sequences of Dpo2 and Dpo3 genes were first reported in the 1990s (9, 14, 15).
In this study, we successfully purified recombinant Dpo2 and Dpo3 proteins and analyzed their in vitro biochemical properties, in comparison with (recombinant) Dpo1 and Dpo4, in order to elucidate the functional roles of four different DNA polymerases in an archaeal DNA replication system. We also analyzed in vivo expression profiles of the four DNA polymerases and their replication accessory factors during culture. Dpo2 and Dpo3 were found to exhibit low DNA polymerase and 3′ to 5′ exonuclease activities, low thermostability, weak DNA binding, and the eccentric property of severe inhibition by SSB in vitro, in contrast to Dpo1 and Dpo4. Both Dpo2 and Dpo3 bypassed some deaminated and oxidative base lesions, whereas only Dpo3 (and not Dpo2) bypassed a thymine dimer. The implications of the in vitro catalytic properties of Dpo2 and Dpo3 are discussed in comparison with Dpo1 and Dpo4.
EXPERIMENTAL PROCEDURES
Materials
Unlabeled dNTPs, T4 polynucleotide kinase, and restriction endonucleases were purchased from New England Biolabs (Ipswich, MA). [γ-32P]ATP (specific activity 3 × 10³ Ci/mmol) was purchased from PerkinElmer Life Sciences. Bio-spin columns were purchased from Bio-Rad. A protease inhibitor mixture was obtained from Roche Applied Science. The pCR 2.1-TOPO TA cloning kit was from Invitrogen. Amicon Ultra centrifugal filter devices were purchased from Millipore (Billerica, MA). FPLC columns and Prescission Protease were purchased from GE Healthcare.
Oligonucleotides
A 21-mer and 36-mers containing a G, 8-oxoG,4 hypoxanthine, AP site (tetrahydrofuran analog), or O6-MeG were obtained from Midland Certified Reagent Co. (Midland, TX). Three 36-mers, each containing an N2-MeG, N2-BzG, or O6-BzG adduct were prepared as previously described (16, 17). A 25-mer-containing a cis-syn cyclobutane thymine dimer (CTD) was purchased from Integrated DNA Technologies (Coralville, IA), and a 17-mer, 18-mer, and 36-mer containing a uracil residue were from Bioneer (Daejeon, Korea). M13mp18 single-stranded DNA was purchased from Bayou Biolabs (Los Angeles, CA), and 40-mer was from Sigma Genosys (The Woodlands, TX). The sequences of the 17-, 18-, 21-, 25-, and 36-mers are shown in Table 1.
TABLE 1.
Oligodeoxynucleotides used in this study
X represents unmodified TT or CTD; Y represents G, N2-MeG, O6-MeG, N2-BzG, O6-BzG, 8-oxoG, hypoxanthine, uracil, or AP site (tetrahydrofuran analog); and p represents a phosphate group.
| Oligodeoxynucleotide | Sequence |
|---|---|
| 17-mer | 5′-GTACCACCATCCACTAC |
| 17-p-mer | 5′-pCGCAGCGAGGACGCCGA |
| 18-mer | 5′-GCCTCGAGCCAGCCGCAG |
| 21-mer | 5′-GCCTCGAGCCAGCCGCAGACG |
| 24-mer | 5′-GCCTCGAGCCAGCCGCAGACGCAG |
| 25-mer | 3′-CATGGTGGTAGGTGATGXGATGTA |
| 36-mer | 3′-CGGAGCTCGGTCGGCGTCTGCGTCYCTCCTGCGGCT |
| 36-f-mer | 5′-CGGAGCTCGGTCGGCGTCTCGCAGCGAGGACGCCGA |
| 40-mer | 5′-GGAAGCATAAAGTGTAAAGCCTGGGGTGCCTAATGAGTGA |
Polymerase Chain Assembly Preparation of S. solfataricus P2 Genes Encoding Dpo1, Dpo3, PCNA1, PCNA2, PCNA3, and Rad A
The method of polymerase chain assembly was used to construct genes encoding S. solfataricus Dpo1, Dpo3, PCNA1, PCNA2, PCNA3, and RadA. The oligonucleotides used in the gene synthesis (supplemental Table S1) were designed using DNAWorks (available on the World Wide Web), and codons were optimized for expression in Escherichia coli. Synthetic oligonucleotides were purchased for each synthesis (Invitrogen), and polymerase chain assembly was performed essentially as described (18, 19). The resulting polymerase chain assembly products were ligated into a pCRTM4-TOPO® TA vector using a TOPO TA Cloning® Kit (Invitrogen). The sequences were confirmed, and any errors were corrected (using site-directed mutagenesis) prior to excision from the cloning vector and ligation into the pET22b(+) expression vector (BamHI and EcoRI restriction digest at the N and C terminus, respectively). Expression and purification of five proteins (Dpo1, PCNA1, PCNA2, PCNA3, and RadA) was performed in a manner identical to the method described previously for Dpo4 (20). Expression and purification of Dpo3 required transferring the gene into a different vector and is described below.
Isolation of the S. sofataricus P2 Genes Encoding Dpo2, Dpo3, the Small (RFC-small) and Large (RFC-large) Subunits of RFC, and SSB and Construction of E. coli Expression Vectors
The Dpo2 (carboxyl-end), Dpo3, RFC-small, RFC-large, and SSB genes were obtained by PCR amplification from the genomic DNA of S. solfataricus P2 (ATCC, Mansassas, VA) as template using AccuTaq LA DNA polymerase (Sigma) with five pairs of primers: 5′-GGATCCATGGGCTTTGGCGGAGGAAT-3′ and 5′-TTAACACCTAGACATCACCTC-3′ for Dpo2 (carboxyl-end) (GenBankTM accession number NP_342896); 5′-GGATCCATGATTAAGGATTTCTTTAT-3′ and 5′-TTATTTCTTCTTAGAAGCTC-3′ for Dpo3 (NP_341651); 5′-GGATCCGATGAGCACGAAGGTCGAAGA-3′ and 5′-CTGCAGTCATCTATTCTCACTGCCTA-3′ for RFC-small (NP_342275); 5′-CATATGATACAATGGTTTTTAAA-3′ and 5′-AGATCTCTAAGATTTAGATATGGAAC-3′ for RFC-large (NP_342276); 5′-CATATGCATCACCACCATCATCACATGGAAGAAAAAGTAGGTAA-3′ and 5′-GAATTCTCACTCCTCTTCACCTTCTT-3′ for SSB (NP_343725). The resulting PCR products of 1.7-kb Dpo2 (carboxyl-end),5 2.3-kb Dpo3, 1-kb RFC-small, 1.2-kb RFC-large, and 0.5-kb SSB genes were cloned into the vector pCR 2.1 Topo, and the nucleotide sequences were determined (in the Vanderbilt facility) to confirm the coding regions, and sequence errors causing amino acid substitutions were corrected using site-directed mutagenesis. The Dpo2 (carboxyl-end) or Dpo3 gene fragment was then cloned into the BamHI and NotI sites of the vector pBG101 or pNR111 (obtained from the Center for Structural Biology, Vanderbilt University), generating the pBG101-Dpo2 and pNR111-Dpo3 vectors encoding an N-terminal GST-tagged Dpo2 (carboxyl-end) or Dpo3. The synthetic codon-optimized Dpo3 gene (constructed with the use of DNAWorks) was also used as template for construction of the pNR111-Dpo3-OPT vector. The RFC-small and RFC-large gene fragments were cloned into the BamHI and PstI sites and the NdeI and BglII sites, respectively, of the bicistronic vector pETDuet-1 (Novagen, Madison, WI), generating the pETDuet-1-RFC-small/RFC-large vector encoding both an N-terminal His6-tagged RFC small subunit and an RFC large subunit. The SSB gene fragment was cloned into the NdeI and EcoRI sites of the vector pET-22b(+) (Novagen), generating the pET-22b(+)-SSB-NHis6 vector encoding the N-terminal His6-tagged SSB.
Expression and Purification of Recombinant Proteins
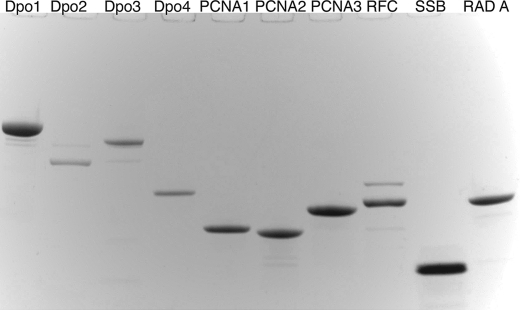
Recombinant proteins were expressed in E. coli strain BL21(DE3)-RIL cells (Stratagene, La Jolla, CA). E. coli BL21(DE3)-RIL harboring each vector for the recombinant protein was grown in Luria-Bertani broth supplemented with ampicillin (100 μg/ml for RFC and SSB) or kanamycin (50 μg/ml for Dpo2 and Dpo3) at 37 °C, with aeration, to an OD600 of 0.6. Isopropyl-β-d-thiogalactopyranoside was added to 0.2 mm (for Dpo2 and Dpo3) or 0.5 mm (for RFC and SSB), and incubation was continued for 12 h at 16 °C (for Dpo2 and Dpo3) or for 3 h at 37 °C (for RFC and SSB). The cells were harvested by centrifugation and resuspended in lysis buffer (50 mm Tris-HCl, pH 7.4, containing 300 mm NaCl, 10% glycerol (v/v), 5 mm β-mercaptoethanol, 1 mg/ml lysozyme, and protease inhibitor mixture (Roche Applied Science)), cooled on ice for 30 min, and then lysed by sonication (12 × 10-s duration with a Branson digital sonifier microtip, (VWR, West Chester, PA), 45% amplitude, with intervening cooling time). The cell lysate was clarified by centrifugation at 4 × 10⁴ × g for 60 min at 4 °C. For Dpo2 or Dpo3 purification, the resulting supernatant was loaded onto a 1-ml GSTrap 4B column, and the column was washed with 20 ml of Buffer A (50 mm Tris-HCl, pH 7.4, containing 150 mm NaCl, 10% glycerol (v/v), and 5 mm β-mercaptoethanol). GST-tagged Dpo2 or Dpo3 bound on the column was cleaved by Prescission Protease (for Dpo2) or TEV protease (for Dpo3) for 14 h at 4 °C. Cleaved Dpo2 or Dpo3 was eluted with Buffer A, and the purity was analyzed by SDS-polyacrylamide gel electrophoresis and Coomassie Brilliant Blue R-250 staining. The yields of Dpo2 and Dpo3 were about 25 and 125 μg, respectively, from 1 liter of each culture. For RFC or SSB purification, each cell extract was loaded onto a HisTrap HP column, and the column was washed with Buffer B (50 mm Tris-HCl, pH 7.4, containing 300 mm NaCl, 10% glycerol (v/v), and 5 mm β-mercaptoethanol) containing 50 mm imidazole. His-tagged RFC and SSB fractions were eluted with buffer B containing 400 mm imidazole. SSB was further purified with the use of a heparin column and an NaCl gradient; SSB was eluted with ∼700 mm NaCl. RFC was further purified with a Superdex 200 column (10 × 300 mm); the RFC complex (small subunit/large subunit, 4:1) was eluted at ∼11 ml, corresponding to a previous report (21). The yields of RFC and SSB were about 140 μg and 1.5 mg, respectively, from 1 liter of each culture. An SDS-polyacrylamide gel electrophoretogram of each of the purified proteins is shown (Fig. 1).
FIGURE 1.
Purified DNA polymerases and accessory proteins of S. solfataricus. The purified recombinant proteins (∼7 μg each) were separated by SDS-polyacrylamide gel electrophoresis (4–20% gradient gel, w/v) and stained with Coomassie Brilliant Blue R-250 (22, 23). The two bands for RFC are the high and low Mr subunits.
Preparation and Characterization of Antibodies
Polyclonal antibodies were raised in New Zealand White rabbits by Covance (Denver, PA) using the company's standard protocol, with 1–3 animals per antigen, depending on the amount available. The first injection (subcutaneously) was with 250 μg of each antigen, emulsified in Freund's complete adjuvant. After 21 days, each rabbit was boosted with another 125 μg of the same adjuvant emulsified in Freund's incomplete adjuvant (subcutaneously). Ten days following the boost, 20 ml of serum was collected from each rabbit (first bleed). Another 18 days later each rabbit was boosted subcutaneously with another 125 μg of antigen emulsified in Freund's incomplete adjuvant, and 10 days later the rabbits were killed, and 50 ml of serum was collected. Both bleeds of serum were tested for specificity and titer.
Characterization of the antisera was done by SDS-polyacrylamide gel electrophoresis/immunoelectrophoretic blotting. A panel of all antigens (1 μg of protein for each, in individual wells) was used. The general procedure was as described previously (24), except that 0.05% Tween 20 (w/v) was used in place of BSA in the buffers (25), and 4-chloro-1-naphthol was used as the peroxidase substrate instead of diaminobenzidine (26). All antisera were used at a dilution of 1:400 (v/v) in testing.
Based on the specificity of the antisera (supplemental Fig. S2), one antiserum preparation from each set was selected for use in the immunoquantitation studies. When cross-reactivity was an issue, the differences in Mr allowed analyses to be done, except in the case of PCNA subunits 1 and 2 (which cross-reacted and could not be distinguished by Mr). In that case, the quantitation was collective for PCNA1 and PCNA2, and PCNA3 was measured separately.
S. solfataricus Culture
S. solfataricus strain P2 (ATCC® 35092TM) cells were cultured at 80 °C in DSM 182/ATCC1304 media (ATCC 35092 Product Information Sheet) (27) with the pH adjusted to 3.0 by the addition of H2SO4. Growth was monitored by measuring A600.
RT-PCR
RNA from S. solfataricus strain P2 was extracted at time points between 15 and 46 h (log phase; Fig. 2) and purified using an RNeasy minikit (Qiagen, Germantown, MD) according to the manufacturer's directions. mRNA integrity was checked by denaturing agarose gel electrophoresis and ethidium bromide staining. Concentrations of mRNA samples were measured using a NanoDrop ND-2000 device (Thermo Scientific, Wilmington, DE). RNA samples were treated with RNase-free DNase (Qiagen), followed by a clean-up step with an RNeasy minikit to remove genomic DNA contamination (Qiagen). RT-PCR was carried out using a Qiagen OneStep RT-PCR kit with 20 ng of RNA as the template and a 7 S rRNA gene fragment as the co-amplified internal control. The gene-specific primers used are listed in supplemental Table S2. PCR products were separated on 2% agarose (w/v) gels and visualized by ethidium bromide staining (supplemental Fig. S1). Images were analyzed with Quantity One software (Bio-Rad).
FIGURE 2.
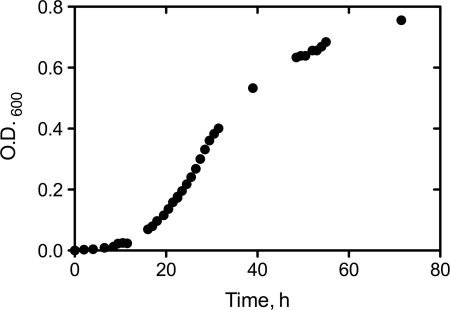
Growth curve of S. solfataricus strain P2 at 80 °C.
Quantitative Immunoblot Analysis
Cell pellets from a S. solfataricus strain P2 time course culture were resuspended in 200 mm Tris-HCl (pH 6.8) solubilization buffer containing 30% glycerol (v/v), 3% SDS (w/v), and 1 mm β-mercaptoethanol. Total cellular protein was isolated by sonication (6 × 15 s, Branson sonicator with microtip, 45% amplitude) followed by centrifugation (2.7 × 10⁴ × g, 4 °C, 20 min). Protein concentrations were measured with a bicinchoninic acid method (Pierce BCA protein assay kit, Thermo Scientific). Protein extracts (30 μg for Dpo2 and Dpo4, 5 μg for other proteins) and purified standards (2-fold serial dilutions from 6.4 ng to 400 pg) were separated on 4–20% (w/v) TGX gradient gels (Bio-Rad). The general transfer procedure was as described previously (24), with 0.05% Tween 20 (w/v) in the buffers (see above). Each membrane was incubated overnight at 4 °C with a rabbit polyclonal antibody and then 45 min at room temperature with an IRDye 680LT-conjugated goat anti-rabbit secondary antibody (LI-COR Biosciences, Lincoln, NE). The membrane was scanned, and the image was analyzed on an Odyssey infrared imaging system (LI-COR) according to the manufacturer's protocol (supplemental Fig. S3).
Reaction Conditions for Enzyme Assays
Unless indicated otherwise, standard DNA polymerase reactions were performed in 50 mm Tris-HCl (pH 7.5) buffer containing 50 mm NaCl, 5 mm dithiothreitol, 100 μg/ml BSA (w/v), and 10% glycerol (v/v) with 100 nm primer-template at 37 °C. For the assays measuring heat stability and temperature effect, potassium HEPES was used as a buffering agent instead of highly temperature-sensitive Tris. Primers were 5′-end-labeled using T4 polynucleotide kinase with [γ-32P]ATP and annealed with template. All polymerase reactions were initiated by the addition of dNTPs and MgCl2 (10 mm final concentration) to preincubated enzyme/DNA mixtures. Exonuclease reactions were initiated by the addition of MgCl2 (10 mm final concentration) without dNTPs.
Primer Extension Assay with All Four dNTPs
A 32P-labeled primer, annealed to either an unmodified or adducted template, was extended in the presence of all four dNTPs (100 μm each) for 15 or 30 min. Reaction mixtures (8 μl) were quenched with six volumes of a solution of 20 mm EDTA in 95% formamide (v/v). Products were resolved using an 8 or 16% polyacrylamide (w/v) gel electrophoresis system containing 8 m urea and visualized using a Bio-Rad Personal Molecular Imager FX and Quantity OneTM software (Bio-Rad).
Steady-state Kinetic Assays
A 21-mer primer was 5′-[γ-32P]ATP end-labeled (PerkinElmer Life Sciences) and annealed to the 36-mer DNA template before being added to reactions (8 μl) in 50 mm Tris-HCl buffer (pH 7.5) containing 5 mm dithiothreitol, 0.1 mg/ml BSA, 5 mm MgCl2, and 10% glycerol (v/v) with 100 nm primer-template; either 4–200 nm Dpo1, 1.5–3 μm Dpo2, 0.5–1.5 μm Dpo3, or 0.1–8 nm Dpo4; and increasing concentrations of individual dNTPs. The amount of DNA polymerase in the reactions yielded ≤20% extended product (in order to maintain initial velocity conditions). Incubations were at 37 °C for 10, 60, or 90 min, depending on the polymerase and dNTP being used, and quenched with six volumes of a solution of 20 mm EDTA in 95% formamide, 0.02% (w/v) bromphenol blue, 0.02% (w/v) xylene cyanol dye solution. Extension products were separated on 8 m urea, 16% (w/v) polyacrylamide gels, visualized using a phosphorimaging system, and quantified using Quantity OneTM software (Bio-Rad). The extended product bands were used to estimate the kinetic parameters Km and kcat by non-linear regression fitting to the Michaelis-Menten equation using Graph Pad Prism 5.0 software (GraphPad, San Diego, CA). Relative insertion frequencies were calculated as (kcat/Km)incorrect/(kcat/Km)correct (28).
Electrophoretic Mobility Shift Assays
Increasing concentrations of each polymerase were incubated with 10 nm 32P-24-mer·36-mer primer-template DNA on ice for 15 min in the binding buffer, which contained 50 mm Tris-HCl (pH 8.0 at 4 °C), 50 mm NaCl, 5 mm MgCl2, 1 mm dithiothreitol, 10 μg/ml bovine serum albumin (w/v), and 5% glycerol (v/v). The mixtures were directly loaded on non-denaturing 3.5% polyacrylamide gels and electrophoresed at 8 V/cm for 40 min at 4 °C in the running buffer (40 mm Tris acetate (pH 8.0 at 4 °C) containing 5 mm magnesium acetate and 0.1 mm EDTA). Gels were imaged using a Bio-Rad Molecular Imager FX instrument.
RESULTS
Expression and Purification of Recombinant Dpo2 and Dpo3
Initial trials using an N-terminal His6 tag with a pET-22b(+) vector system were not successful for the expression and purification of Dpo2 and Dpo3, due to the very low expression levels and the loss of proteins during purification. We changed to a PreScission or TEV protease-cleavable N-terminal GST tag generating a pBG101 or pNR111 system to increase the expression yield and minimize the purification time, which proved to be successful for obtaining full-length 66-kDa Dpo2 protein (carboxyl-end)5 but not Dpo3. Thereafter, we used a synthetic Dpo3 gene with an optimized sequence (instead of the native sequence of the gene) to enhance the heterologous protein expression in E. coli, which proved to be a successful strategy for obtaining full-length 88-kDa Dpo3 protein (Fig. 1).
Growth of S. solfataricus and Patterns of mRNA and Protein Expression in Vivo
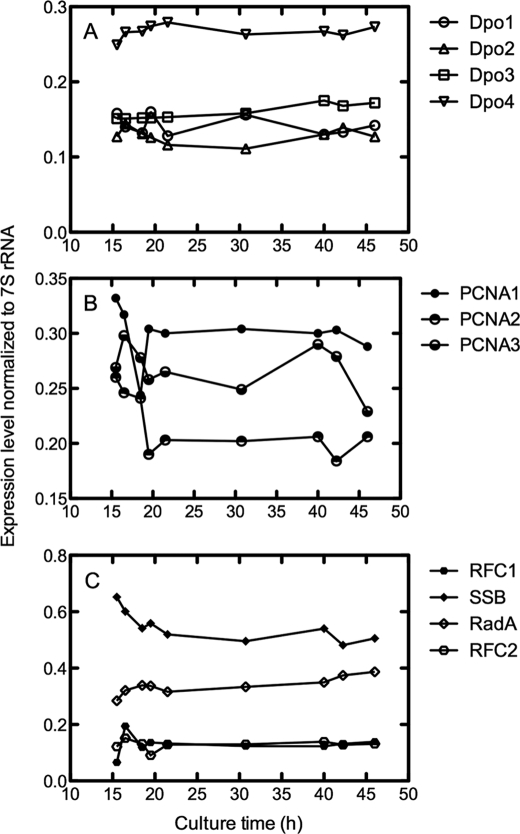
A growth curve for S. solfataricus (80 °C, pH 3) showed the classic lag, exponential, and stationary phases over the course of 72 h (Fig. 2). Analysis of mRNA levels of the 10 genes studied showed relatively limited changes between 15 and 46 h, during the exponential phase (Fig. 3). The only appreciable change was a 2-fold decrease in the level of mRNA for PCNA3 (Fig. 3C).
FIGURE 3.
RT-PCR analyses of S. solfataricus strain P2 RNA levels as a function of growth time. RT-PCR products were separated on 2% agarose (w/v) gels and visualized by ethidium bromide staining (supplemental Fig. S1). The images were analyzed with Quantity One software (Bio-Rad). A, Dpo1, Dpo2, Dpo3, and Dpo4; B, PCNA1, PCNA2, and PCNA3; C, RFC1, RFC2, SSB, and RadA.
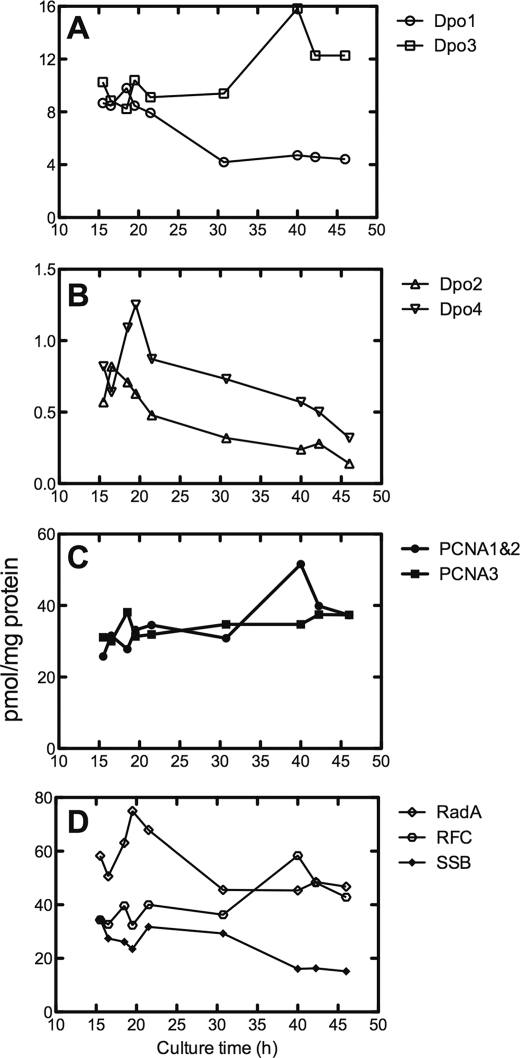
Polyclonal antibodies were raised against the 10 proteins of interest, and the most selective of these (supplemental Fig. S2) were used to quantify these proteins during the exponential growth phase (Fig. 4). As with RNA, any temporal changes were not major over the course of 15–46 h, with only some decreases seen for Dpo1, Dpo2, Dpo4, and SSB (Fig. 4, A–C) and an increase for Dpo3 (Fig. 4C) (in contrast to the RNA pattern; Fig. 3B). One point of interest is that the expression levels of Dpo1 and Dpo3 were an order of magnitude higher than for Dpo2 and Dpo4.
FIGURE 4.
Quantitative immunoblot analyses of proteins in S. solfataricus strain P2 as a function of growth time. Images were analyzed on an Odyssey Infrared Imaging System (LI-COR) as described under “Experimental Procedures.” A, Dpo1 and Dpo2; B, Dpo3 and Dpo4; C, PCNA1/PCNA2 (these were not distinguished and are presented as the sum) and PCNA3; C, RFC, SSB, and RadA.
DNA Polymerase Activities of Dpo1, Dpo2, Dpo3, and Dpo4
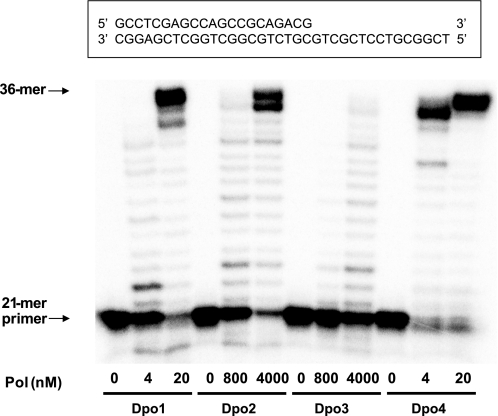
A primer extension assay using an unmodified 21-mer primer·36-mer template complex and all four dNTPs was carried out in order to verify the DNA polymerase activities of Dpo2 and Dpo3, in comparison with Dpo1 and Dpo4 (Fig. 5). Both Dpo2 and Dpo3 showed primer extension activities, which were much lower than for Dpo1 or Dpo4. Even 0.8 μm Dpo2 and 4 μm Dpo3 yielded only partially extended products, ranging from 22- to 35-mers. Primers were extended mainly to 35-mer and full-length 36-mer products by Dpo2. In contrast, much lower concentrations (20 nm) of Dpo1 and Dpo4 readily extended primers and generated mainly full-length products.
FIGURE 5.
DNA polymerase (Pol) activities of Dpo1, Dpo2, Dpo3, and Dpo4. Reactions were done for 30 min at 37 °C with increasing concentrations of Dpo1 (0–20 nm), Dpo2 (0–4 μm), Dpo3 (0–4 μm), or Dpo4 (0–20 nm) with 50 nm 21-mer primer/36-G-mer template DNA as indicated (Table 1). 32P-Labeled 21-mer primer was extended in the presence of 10 mm MgCl2 and all four dNTPs (100 μm each). The reaction products were analyzed by 16% (w/v) denaturing polyacrylamide gel electrophoresis with subsequent phosphorimaging analysis.
DNA Synthesis Activities of Dpo1, Dpo2, Dpo3, and Dpo4 on Recessed, Gapped, and Forked DNA Substrates in the Presence of Mg2+ or Mn2+
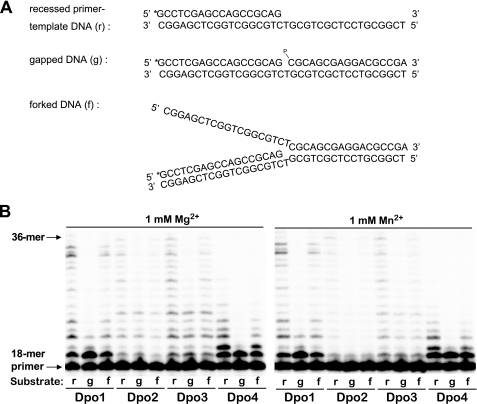
Primer extensions against recessed, gapped, and forked DNA substrates in the presence of either Mg2+ or Mn2+ were performed to test the substrate and metal ion preferences of Dpo1, Dpo2, Dpo3, and Dpo4. All four DNA polymerases were active over a wide range of Mg2+ concentrations (i.e. 1–10 mm), whereas they were active only at 1 mm Mn2+ but not very active at 3 or 10 mm Mn2+ (data not shown). All DNA polymerases could utilize all three kinds of DNA substrates for DNA synthesis but slightly preferred the recessed primer-template DNA substrates to one-nucleotide gapped or forked DNA substrates, in the presence of 1 mm Mg2+ or Mn2+ (Fig. 6). Interestingly, both Dpo2 and Dpo3 incorporated up to six nucleotides using one-nucleotide gapped DNA substrates, indicating their possible involvement in strand displacement DNA synthesis for long patch base excision repair. In contrast, Dpo1 and Dpo4 incorporated mostly one nucleotide and were strongly blocked thereafter, although the overall activity with forked DNA was no better with Dpo3 than Dpo1 (Fig. 6). Dpo2 and Dpo3 were both more active with Mg2+ than Mn2+, although Dpo1 and Dpo4 were similarly active with Mg2+ or Mn2+.
FIGURE 6.
DNA synthesis activities on recessed, gapped, and forked DNA substrates by Dpo1, Dpo2, Dpo3, and Dpo4 in the presence of Mg2+ or Mn2+. A, scheme of the three types of DNA substrates used. The recessed primer-template DNA was made by annealing the 32P-end-labeled primer (18-mer) and the unmodified 36-mer templates. The single-nucleotide gapped DNA was made by annealing the 32P-end-labeled primer (18-mer), the 17-mer with a 5′-phosphate (17-p-mer), and the unmodified 36-mer templates. The forked DNA was made by annealing the 32P-end-labeled primer (18-mer), the half-complementary 36-f-mer, and the unmodified 36-mer templates. All oligonucleotide sequences are listed in Table 1. *, 32P label; p, phosphate group. B, either 0.5 nm Dpo1, 150 nm Dpo2, 1 μm Dpo3, or 0.1 nm Dpo4 was incubated for 15 min at 50 °C with 50 nm DNA substrate as indicated. All 32P-labeled primers were extended with all four dNTPs (100 μm each) in the presence of 1 mm MgCl2 or MnCl2. The reaction products were analyzed by 16% (w/v) denaturing polyacrylamide gel electrophoresis with subsequent phosphorimaging analysis. r, recessed primer-template DNA; g, gapped DNA; f, forked DNA.
Exonuclease Activities of Dpo1, Dpo2, Dpo3, and Dpo4
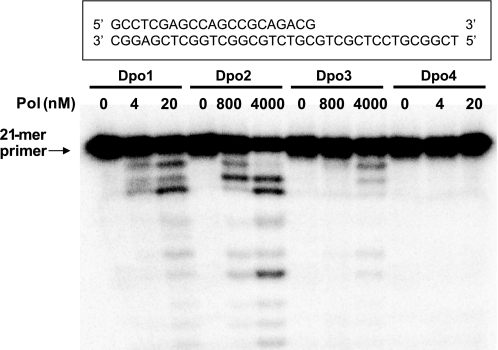
A primer degradation assay using an unmodified 21-mer primer·36-mer template complex in the absence of dNTPs was carried out in order to determine if Dpo2 and Dpo3 have 3′ to 5′ exonuclease activities, in comparison with Dpo1 and Dpo4 (Fig. 7). Dpo2 and Dpo3 degraded the 21-mer primers in proportion to the concentration of enzyme, as did Dpo1, and generated 3′ degradation products ranging from 20- to 12-mers, but the primer degradation was apparent only at concentrations of Dpo2 (∼0.8 μm) and Dpo3 (∼4 μm) much higher than Dpo1 (4 nm). In contrast, Dpo4 (known to be exonuclase−) generated no detectable degradation products.
FIGURE 7.
3′ → 5′ exonuclease activities of Dpo1, Dpo2, Dpo3, and Dpo4. The primer (21-mer) was annealed with unmodified 36-G-mer template (Table 1). Reactions were done for 30 min at 37 °C, with increasing concentrations of Dpo1 (0–20 nm), Dpo2 (0–4 μm), Dpo3 (0–4 μm), or Dpo4 (0–20 nm) with 50 nm primer-template DNA as indicated. 32P-labeled 21-mer primer was incubated in the presence of MgCl2 but no dNTPs at 37 °C. The reaction products were analyzed by 16% (w/v) denaturing polyacrylamide gel electrophoresis with subsequent phosphorimaging analysis. Pol, polymerase.
Steady-state Kinetics of Dpo1, Dpo2, Dpo3, and Dpo4
Steady-state kinetic analysis was performed in order to compare the activity and efficiency of nucleotide incorporation (and misincorporation) catalyzed by each of four DNA polymerases (Dpo1, Dpo2, Dpo3, and Dpo4) encoded by the S. solfataricus genome (Table 2). Despite sequence similarity and the classification of the Dpo2 and Dpo3 genes as B-family DNA polymerases, these proteins had low DNA polymerase activity (compared with Dpo1 and Dpo4) for incorporation of dCTP opposite template G (Table 2).
TABLE 2.
Steady-state kinetics of dNTP incorporation opposite G by Dpo 1, Dpo2, Dpo3, and Dpo4
Km and kcat values were determined by quantifying gel band intensities using Quantity OneTM and non-linear regression analysis of product versus [dNTP] plots (Michelis-Menten equation) with GraphPad Prism 5.0 (hyperbolic plots).
| Polymerase | dNTP | Km | kcat | kcat/Km | finsa |
|---|---|---|---|---|---|
| μm | min−1 | min−1 μm−1 | |||
| Dpo1 | C | 8.4 ± 0.7 | 0.23 ± 0.004 | 2.7 × 10⁻² | 1 |
| A | 2100 ± 1300 | 0.0018 ± 0.0004 | 8.6 × 10⁻⁷ | 3.2 × 10⁻⁵ | |
| G | 2500 ± 900 | 0.0068 ± 0.0011 | 2.7 × 10⁻⁶ | 1.0 × 10⁻⁴ | |
| T | 3100 ± 600 | 0.096 ± 0.008 | 3.1 × 10⁻⁵ | 1.1 × 10⁻³ | |
| Dpo2 | C | 9.8 ± 2.1 | 0.000053 ± 0.000003 | 5.4 × 10⁻⁶ | 1 |
| A | NDb | ND | <1.3 × 10⁻¹⁰c | <2.4 × 10⁻⁵ | |
| G | ND | ND | <1.0 × 10⁻¹⁰c | <1.9 × 10⁻⁵ | |
| T | 3700 ± 1300 | 0.0000072 ± 0.0000009 | 1.9 × 10⁻⁹ | 3.5 × 10⁻⁴ | |
| Dpo3 | C | 75 ± 13 | 0.00053 ± 0.00006 | 7.1 × 10⁻⁶ | 1 |
| A | 390 ± 10 | 0.000016 ± 0.000001 | 4.1 × 10⁻⁸ | 5.7 × 10⁻³ | |
| G | 190 ± 40 | 0.000013 ± 0.000001 | 6.8 × 10⁻⁸ | 9.5 × 10⁻³ | |
| T | 930 ± 160 | 0.00011 ± 0.00001 | 1.2 × 10⁻⁷ | 1.7 × 10⁻² | |
| Dpo4 | C | 39 ± 4 | 12 ± 0.4 | 0.31 | 1 |
| A | 690 ± 160 | 0.073 ± 0.005 | 1.1 × 10⁻⁴ | 3.2 × 10⁻⁴ | |
| G | 470 ± 140 | 0.15 ± 0.01 | 3.2 × 10⁻⁴ | 1.0 × 10⁻³ | |
| T | 1600 ± 100 | 0.48 ± 0.01 | 3.0 × 10⁻⁴ | 9.7 × 10⁻⁴ |
a Relative insertion frequency (fins) was calculated as (kcat/Km)incorrect/(kcat/Km)correct (28).
b ND, not determined.
c A limit of efficiency was estimated from the slope of a v versus [dNTP] plot.
The results of the steady-state kinetic analysis show that Dpo2 and Dpo3 incorporated dCTP opposite template G with catalytic efficiencies of 5.4 × 10⁻⁶ and 7.1 × 10⁻⁶ min−1 μm−1, respectively, which are ∼5,000- and ∼4,000-fold lower than Dpo1. The detection of nucleotide incorporation by Dpo2 and Dpo3 required very high concentrations of polymerase compared with DNA substrate (up to a 30:1 ratio) accompanied with excessively long incubation times (60 or 90 min). Thus, the results obtained may not reflect accurate Km and kcat values because the detection of nucleotide incorporation was outside the linear range of the steady-state assay.
As part of our steady-state analysis, misincorporation of dATP, dGTP, and dTTP opposite template G was also measured for Dpo2 and Dpo3. For Dpo2, Km and kcat values for dATP and dGTP could not be determined accurately, and catalytic efficiencies were estimated from the slopes of the v versus [dNTP] plots. The results showed misinsertion frequencies of 4 × 10⁻⁴ to 2 × 10⁻⁵ by Dpo2, similar to those of Dpo1. Dpo3, however, had fidelity up to ∼60-fold lower than that of Dpo1 (Table 2). As expected from previous work (13), Dpo4 (a member of the Y-family) showed misinsertion frequencies of 1 × 10⁻³ to 3 × 10⁻⁴ during nucleotide incorporation opposite undamaged DNA templates, which were ∼10-fold higher than those of Dpo1.
Binding of Dpo1, Dpo2, Dpo3, and Dpo4 to DNA substrates
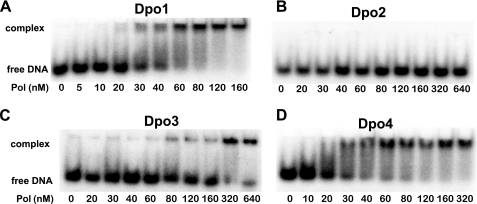
Electrophoretic mobility shift assays were performed to estimate the relative DNA binding affinities of the four S. solfataricus DNA polymerases. Electrophoretic mobility shift assays can provide good comparisons of DNA binding affinities of different proteins, although not representing true equilibrium conditions. The fraction of primer-template DNA bound with each polymerase was determined and used as an indicator of DNA binding of polymerase (Fig. 8). The data clearly indicate that both Dpo1 and Dpo4 bind DNA much more tightly (≥10- and 60-fold, respectively) than Dpo2 and Dpo3, in that the fractions of polymerase-DNA complexes in the 30 and 60 nm lanes with Dpo1 and Dpo4 were comparable with those in 320 and 640 nm lanes with Dpo3; Dpo2 did not form any detectable complex under these conditions, even at an enzyme concentration of 640 nm (Fig. 8).
FIGURE 8.
Comparison of relative DNA binding affinities of Dpo1, Dpo2, Dpo3, and Dpo4 to 24-mer·36-mer DNA by electrophoretic mobility shift assay. A, Dpo1; B, Dpo2; C, Dpo3; D, Dpo4. Reaction mixtures containing 10 nm 32P-labeled 24-mer·36-mer primer-template duplex DNA were incubated with increasing concentrations (as indicated in the figure) of each polymerase (Pol) and resolved on a 3.5% (w/v) non-denaturing polyacrylamide gel to separate the free DNA and the polymerase-DNA complex.
Effect of Temperature on Dpo1, Dpo2, Dpo3, and Dpo4 Activities
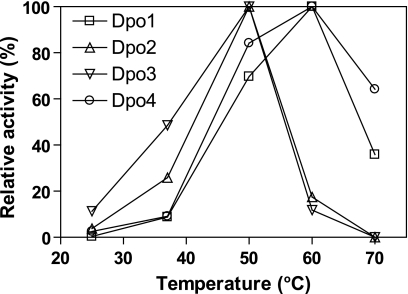
Activities for single dCTP incorporation into a 21-mer·36-mer duplex opposite unmodified G by Dpo1, Dpo2, Dpo3, and Dpo4 at various reaction temperatures were measured to determine the optimum temperatures of these DNA polymerases (Fig. 9). The optimum temperature for Dpo2 and Dpo3 was 50 °C under these reaction conditions, whereas that for Dpo1 and Dpo4 was 60 °C. This relatively low optimum temperature might be related to the easy thermal denaturation of the shorter oligonucleotide DNA substrates used in this assay, although there was also a difference between the DNA polymerases with the same oligonucleotides. The catalytic activities of Dpo2 and Dpo3 gradually increased from 25 to 50 °C but abruptly decreased at 60 °C, at which they were only ∼20% of the activities at 50 °C (and even lower than the activities at 37 °C) and were abolished at 70 °C. In contrast, activities of Dpo1 and Dpo4 gradually increased from 25 to 60 °C and were substantial even at 70 °C, with ∼40 and ∼60% of the activities at 60 °C for Dpo1 and Dpo4, respectively.
FIGURE 9.
Effect of temperature on activities of nucleotide incorporation opposite G by Dpo1, Dpo2, Dpo3, and Dpo4. Reactions were done for 15 min with Dpo1 (5 nm, □), Dpo2 (0.5 μm, △), Dpo3 (1 μm, ▽), or Dpo4 (1 nm, ○) with 50 nm 21-mer primer·36-G-mer template DNA (Table 1) in the presence of 100 μm dCTP at various temperatures. The reaction products were analyzed by 16% (w/v) denaturing polyacrylamide gel electrophoresis with subsequent phosphorimaging analysis. Activities are indicated relative to the highest activity (taken as 100%) of each individual enzyme.
Thermostabilities of Dpo1, Dpo2, Dpo3, and Dpo4
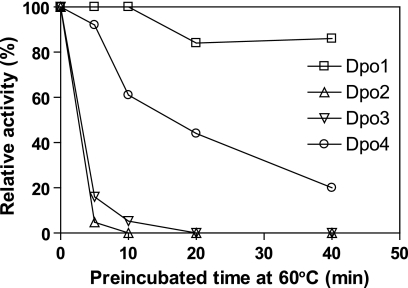
To determine the heat stabilities of the DNA polymerases, each was preincubated in 50 mm potassium HEPES buffer (pH 7.5) without any stabilizing agents (e.g. BSA and glycerol) at 60 °C for varying time intervals and then incubated with dCTP under standard polymerase assay conditions at 50 °C (Fig. 10). Activities of Dpo2 and Dpo3 abruptly decreased to ∼5% of control activity following heat preincubation for only 5 and 10 min, respectively, and were completely abolished after 20 min of heat preincubation. In contrast, activities of Dpo1 and Dpo4 were ∼86 and 20% of control activity, respectively, even after 40 min of heat preincubation.
FIGURE 10.
Thermostabilties of nucleotide incorporation activities of Dpo1, Dpo2, Dpo3, and Dpo4 at 60 °C. Dpo1 (24 nm, □), Dpo2 (2 μm, △), Dpo3 (6 μm, ▽), or Dpo4 (4 nm, ○) was preincubated without DNA, dNTP, and BSA for various time intervals (0–40 min) at 60 °C. Thereafter, reactions were done with the addition of the missing components (50 nm 21-mer·36-G-mer DNA, 100 μm dCTP, 100 μg/ml BSA, and 10 mm MgCl2) for 15 min at 50 °C. The reaction products were analyzed by 16% (w/v) denaturing polyacrylamide gel electrophoresis with subsequent phosphorimaging analysis. Activities are indicated relative to the activity (taken as 100%) of enzyme without preincubation.
Effects of Accessory Factors on DNA Polymerization by DNA Polymerases
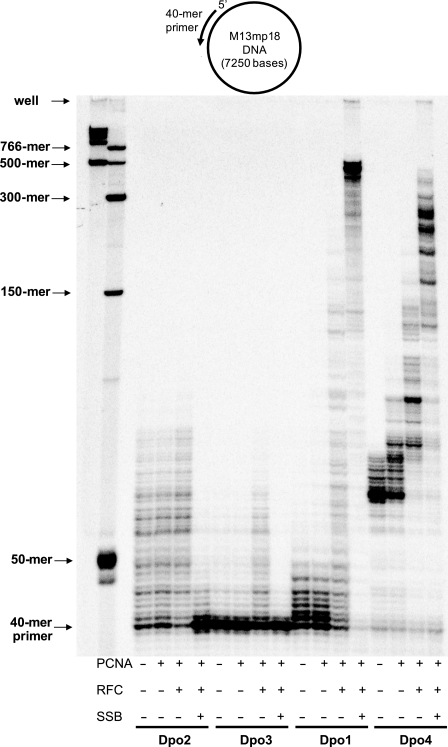
Primer extension reactions with each DNA polymerase were performed in the presence and/or absence of PCNA, RFC, and SSB, using all four dNTPs and a 40-mer primer annealed to M13mp18 single-stranded DNA in order to determine the effects of replication accessory factors on activities of Dpo2 and Dpo3 compared with Dpo1 and Dpo4 (Fig. 11). DNA synthesis by any of the DNA polymerases alone was not very processive. The addition of PCNA slightly increased primer extension only by Dpo4 but not by Dpo1, Dpo2, or Dpo3. Both PCNA and RFC enhanced primer extension substantially in the cases of Dpo1, Dpo3, and Dpo4 (which generated much longer extension products up to about 150-, 65-, and 150-mers, respectively) but very weakly with Dpo2, which generated slightly more products of similar length up to about 80-mers. The addition of PCNA, RFC, and SSB strongly increased DNA polymerization by Dpo1 and Dpo4, which yielded extended products, mainly up to about 500-mers and 300-mers, respectively. An increase of the processivity of DNA synthesis in the presence of all accessory replication factors was the most prominent with Dpo1 and also with Dpo4. In contrast, DNA polymerization by Dpo2 and Dpo3 was strongly inhibited by the presence of all three accessory factors; thus, the extensions were even shorter than with each polymerase alone, yielding mainly one-base extended products.
FIGURE 11.
Effects of PCNA, RFC, and SSB on DNA polymerization by Dpo1, Dpo2, Dpo3, and Dpo4. Dpo1 (5 nm), Dpo2 (1 μm), Dpo3 (1 μm), or Dpo4 (5 nm) was incubated with 5 nm 40-mer primer·M13mp18 template DNA in the presence of 10 mm MgCl2, 500 μm ATP, and all four dNTPs (100 μm each) for 10 min at 50 °C, with 0.6 μm PCNA, 0.6 μm RFC, or 6 μm SSB added as indicated. The reaction products were analyzed by 8% (w/v) denaturing polyacrylamide gel electrophoresis with subsequent phosphorimaging analysis.
DNA Lesion Bypass by Dpo1, Dpo2, Dpo3, and Dpo4
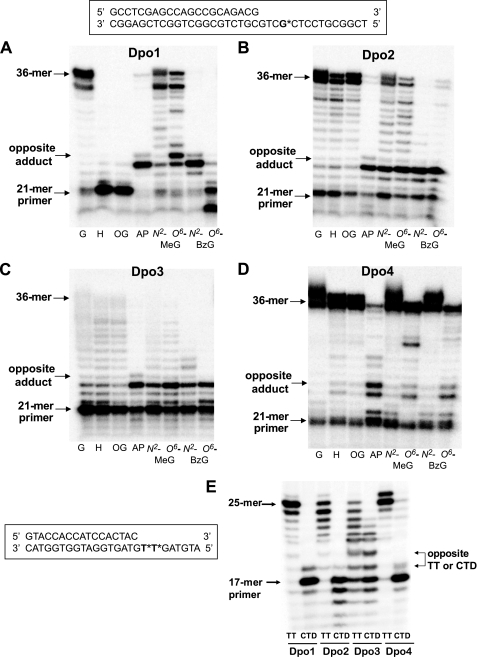
The translesion DNA synthesis activities of Dpo1, Dpo2, Dpo3, and Dpo4 across various DNA lesions in the presence of all four dNTPs were analyzed in “running start” primer extension assays using 21-mer·36-mer duplexes containing unmodified G, hypoxanthine, 8-oxoG, an AP site (tetrahydrofuran analog), N2-MeG, O6-MeG, N2-BzG, or O6-BzG (placed at position 25 of the template) and in “standing start” primer extension assays using a 17-mer·25-mer duplex containing unmodified TT or CTD placed at positions 18 and 19 of the template (Fig. 12). The Y-family DNA polymerase Dpo4 effectively bypassed all DNA lesions except for the AP site, which strongly inhibited primer extension opposite to and one base after the lesion. Dpo1 bypassed only two DNA lesions, N2-MeG and O6-MeG, but with some retardation one base after O6-MeG, yielding 34-mers and full-length 36-mer products. Hypoxanthine, 8-oxoG, and O6-BzG strongly blocked DNA synthesis by Dpo1 three bases before the lesions, and exonuclease activity was prominent in the latter case, whereas the AP site and N2-BzG blocked opposite the lesions. In contrast, Dpo2 and Dpo3 replicated through the hypoxanthine and 8-oxoG lesions as effectively as unmodified G but largely stalled at the other DNA lesions, with little further extension in some cases. For the CTD, the primer extensions by Dpo1, Dpo2, and Dpo4 were strongly blocked opposite the first base of the lesion, and only a trace of full-length product was observed in the latter case. In contrast, Dpo3 quite effectively bypassed opposite the CTD and yielded 18- to 23-mer products, about one-half as much as with TT.
FIGURE 12.
Translesion DNA synthesis across various DNA adducts by Dpo1, Dpo2, Dpo3, and Dpo4. A–D, the primer (21-mer) was annealed with each of the eight different 36-mer templates (Table 1) containing an unmodified G or hypoxanthine (H), 8-oxoG (OG), AP site, N2-MeG, O6-MeG, N2-BzG, or O6-BzG placed at the 25th position from the 3′-end. Either 20 nm Dpo1 (A), 4 μm Dpo2 (B), 4 μm Dpo3 (C), or 20 nm Dpo4 (D) was incubated for 30 min at 37 °C with 50 nm 21-mer primer·36-mer template DNA as indicated. E, the primer (17-mer) was annealed with 25-mer templates (Table 1) containing an unmodified TT or CTD placed at the 18th position from the 3′-end. Dpo1 (20 nm), Dpo2 (4 μm), Dpo3 (4 μm), or Dpo4 (20 nm) was incubated for 30 min at 37 °C with 50 nm 17-mer primer·25-mer template DNA, as indicated. All 32P-labeled primers were extended in the presence of 10 mm MgCl2 and all four dNTPs (100 μm each). The reaction products were analyzed by 16% (w/v) denaturing gel electrophoresis with subsequent phosphorimaging analysis.
Bypass of Uracil Residues by Dpo1, Dpo2, Dpo3, and Dpo4
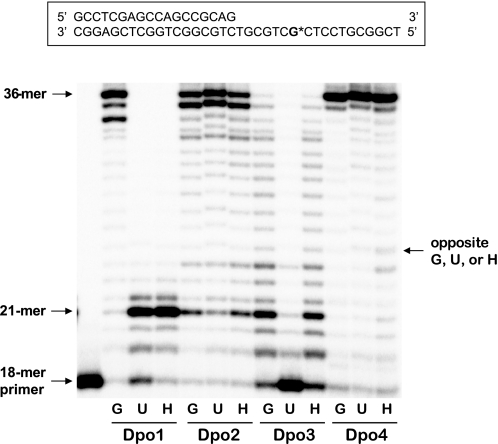
Our findings on effective bypass functions of Dpo2 and Dpo3 across hypoxanthine (deaminated adenine) prompted us to examine further their bypass abilities across uracil (which can arise from deamination of cytosine). Running start primer extension assays using an 18-mer primer annealed to a U-containing 36-mer template (with a single uracil placed seven bases ahead of the primer-template junction) were performed to examine the properties of the four DNA polymerases on bypass or blockage upon sensing uracil, in comparison with G or hypoxanthine (Fig. 13). Dpo1 mostly stalled four bases prior to encountering both uracil and hypoxanthine lesions, which is consistent with the reported read-ahead recognition of deaminated bases by archaeal B-family DNA polymerases (i.e. Dpo1 (29, 30)), whereas Dpo4 readily bypassed both lesions. Interestingly, only Dpo2 (and not Dpo3) was able to bypass uracil, although both Dpo2 and Dpo3 were able to bypass hypoxanthine, indicating that Dpo2 is competent in bypass of both deaminated lesions, as is Dpo4. Dpo3 largely stalled seven bases before uracil (just at the starting position of the 18-mer primer), unlike Dpo1, thus indicating that the mechanism of uracil-induced Dpo3 stalling is probably not identical to the read-ahead sensing of uracil at the 4-bp upstream position by the uracil-binding pocket domain.
FIGURE 13.
Translesion DNA synthesis across uracil and hypoxanthine residues by Dpo1, Dpo2, Dpo3, and Dpo4. The 32P-end-labeled primer (18-mer) was annealed with each of the three different 36-mer templates (Table 1) containing an unmodified G, U, or hypoxanthine (H) at the position seven bases ahead of the primer-template junction. Either 20 nm Dpo1 (A), 4 μm Dpo2 (B), 4 μm Dpo3 (C), or 20 nm Dpo4 (D) was incubated for 30 min at 37 °C with 50 nm 21-mer primer·36-mer template DNA as indicated. All 32P-labeled primers were extended in the presence of 10 mm MgCl2 and all four dNTPs (100 μm each). The reaction products were analyzed by 16% (w/v) denaturing polyacrylamide gel electrophoresis with subsequent phosphorimaging analysis.
Effects of Dpo2 and Dpo3 on DNA Polymerization by Dpo1 and Dpo4
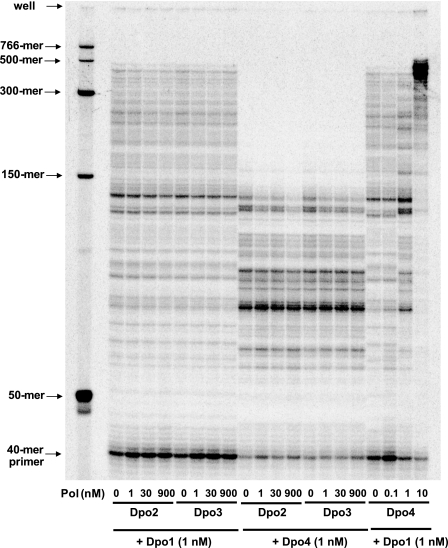
Primer extension reactions by Dpo1 and Dpo4 were performed in the presence and absence of Dpo2 or Dpo3 using PCNA, RFC, SSB, all four dNTPs, and a 40-mer primer annealed to M13mp18 single-stranded DNA, in order to determine if Dpo2 or Dpo3 can inhibit or facilitate DNA synthesis by Dpo1 and Dpo4, when compared with a combination of Dpo1 and Dpo4 (Fig. 14). The addition of 1 and 10 nm Dpo4 promoted DNA synthesis by 1 nm Dpo1, which was proportional to the added Dpo4 concentration and generated mainly 500-mer products in the latter case. In contrast, an effect of the addition of either Dpo2 or Dpo3 on DNA synthesis by Dpo1 or Dpo4 was not observed. The addition of 1–900 nm Dpo2 or Dpo3 only slightly inhibited the DNA synthesis by 1 nm Dpo1 or Dpo4 but was not proportional to the enzyme concentration.
FIGURE 14.
Effects of Dpo2, Dpo3, and Dpo4 on DNA polymerase (Pol) activities of Dpo1 and Dpo4. Dpo1 (1 nm) or Dpo4 (1 nm) was incubated with 5 nm 40-mer primer·M13mp18 template DNA in the presence of 10 mm MgCl2, 500 μm ATP, all four dNTPs (100 μm each), 0.6 μm PCNA, 0.6 μm RFC, and 6 μm SSB for 10 min at 50 °C, where Dpo2 (0–0.9 μm), Dpo3 (0–0.9 μm), or Dpo4 (0–10 nm) was added as indicated. The reaction products were analyzed by 8% (w/v) denaturing polyacrylamide gel electrophoresis with subsequent phosphorimaging analysis.
DISCUSSION
We demonstrated that S. solfataricus P2 cells express the two hypothetical B-family DNA polymerases Dpo2 and Dpo3 in vivo in addition to B-family Dpo1 and Y-family Dpo4. Both Dpo2 and Dpo3 possess rather inefficient and highly thermolabile polymerase and 3′ to 5′ exonuclease activities in vitro, compared with Dpo1 and Dpo4. We also report that Dpo2 and Dpo3 (but not Dpo1) can bypass 8-oxoG and hypoxanthine lesions and/or uracil or cyclobutane thymine dimers, although DNA synthesis by Dpo2 and Dpo3 is much more inhibited by the presence of SSB in vitro, as opposed to Dpo1.
Although ∼9% of the annotated coding sequences in the S. solfataricus genome are predicted to be pseudogenes, inactivated by gene truncations and frameshifts (31), the S. solfataricus P2 DNA polymerase Dpo2 and Dpo3 genes are not “defunct” pseudogenes (32) but protein-encoding functional genes because the mRNA and protein corresponding to each is expressed in cells (Figs. 3 and 4). It has been hypothesized that the three B-family DNA polymerases evolved by gene duplication events in Crenarchaeota, as evidenced by phylogenetic analysis (14). The three B-family DNA polymerases in S. solfataricus are so highly divergent in amino acid sequences that there is only 10–15% identity with each other when calculated from multiple-sequence alignment analysis using ClustalX (version 2.1) (33) and GeneDoc (version 2.7) (34) software, suggesting different functions in cells. Genes homologous to S. solfataricus Dpo2 and Dpo3 have been identified in the genomes of the other Sulfolobus species, indicating the relationships of those species. The hypothetical Dpo2 proteins from two different Sulfolobus species, Sulfolobus tokodaii and Sulfolobus islandicus, have 81–96% amino acid sequence identity to S. solfataricus Dpo2. The hypothetical Dpo3 proteins from two different Sulfolobus species, Sulfolobus acidocaldarius and S. tokodaii, have 64% identities to S. solfataricus Dpo3. We found that Dpo2 and Dpo3 possess both DNA polymerase and 3′ to 5′ exonuclease activities, and DNA polymerization for both is at least somewhat stimulated by PCNA/RFC, which appears to be only analogous to the case of Dpo1. Our data indicate that both Dpo2 and Dpo3, but not Dpo1, are closely related (to each other) in many biochemical properties such as weak catalytic activities, low thermostability, optimum reaction temperature, effective lesion bypass abilities across hypoxanthine and 8-oxoG, weak DNA binding, and severe stalling in the presence of SSB. However, Dpo3 (which is a more distributive polymerase than Dpo2; Fig. 5) can bypass UV-induced DNA damage, and Dpo2 can bypass uracil (Fig. 12). Dpo3 can also work on forked DNA (Fig. 6).
PCNA and RFC, which play the roles of a sliding clamp and a clamp loader, respectively, are key components for highly processive DNA replication in cells. SSB stabilizes single-stranded DNA at replication forks and thus facilitates DNA synthesis. In good agreement with previous reports (35, 36), DNA synthesis with both Dpo1 and Dpo4 was highly stimulated by PCNA/RFC and even further with the addition of SSB. In contrast, the increases in DNA product length and extent by Dpo2 and Dpo3 were relatively weak with the addition of PCNA/RFC and were rather severely inhibited by SSB, suggesting that either Dpo2 or Dpo3 might not be able to overcome the tight binding of SSB on DNA, unlike Dpo1 and Dpo4 (Fig. 11). It is uncertain which sequences of Dpo2 and Dpo3 are involved in PCNA binding; Dpo1 has a “PIP” box in the N-terminal region, and Dpo4 has a PIP box in the C terminus (35, 36). Thus, the accessory factors do not appear to be capable of overcoming the intrinsic low DNA affinity of Dpo2 and Dpo3 (Fig. 8). Although the Dpo2 and Dpo3 genes do not appear to have conserved motifs matched exactly with the previously known PIP box consensus (37), a few sequences in the N-and C-terminal regions of Dpo2 and Dpo3 might be plausible as PIP box candidates. Which sequences of Dpo2 and Dpo3 are responsible for PCNA binding and which subunit(s) of PCNA binds to Dpo2 or Dpo3 are unknown, in the context of predicting an archaeal “toolbelt” model of polymerase exchange (38). Conceivably, both Dpo2 and Dpo3 might play some catalytic roles only in certain short regions of DNA, especially containing deamination, oxidative, and/or UV-induced damage (Fig. 12), and may not be involved in the main chromosomal DNA replication process.
It is remarkable that Dpo2 and Dpo3 effectively bypass both deaminated and oxidative base damage, similar to Dpo4 but in contrast to Dpo1, although Dpo4 appears to be the most efficient in translesion DNA synthesis across most of DNA lesions (Fig. 12). As shown by our results (Fig. 13), archaeal B-family DNA polymerases, such as S. solfataricus Dpo1, generally stall four bases before hypoxanthine and uracil lesions, due to a mechanism of read-ahead recognition by the N-terminal subdomain pocket during DNA synthesis (29, 30). Intriguingly, we also found a subtle difference in lesion bypass between Dpo2 and Dpo3, in that Dpo2 is capable of bypassing two deaminated bases, uracil and hypoxanthine, as effectively as unmodified G, whereas Dpo3 can bypass only hypoxanthine. It is possible that Dpo2 and Dpo3 might have evolved in different ways from a B-family polymerase prototype to evade the base damage formed at high temperature. Unexpectedly, we found that Dpo3 can bypass cyclobutane thymine dimers, unlike Dpo1 and Dpo2, which in turn appear to be more efficient than Dpo4 (Fig. 12E). Thus, Dpo3 may exist to bypass UV-induced DNA damage, which is common in all living organisms exposed to light. It is not clear whether Dpo3 plays a role in bypass of UV-induced DNA lesions in vivo. We note previous reports that only the Dpo2 gene, and not Dpo3 or Dpo4, is specifically induced by UV irradiation in S. solfataricus cells (39–41). It is conceivable that Dpo2 might have a role in DNA repair of UV-induced DNA damage (rather than translesion DNA synthesis across the damaged bases), or otherwise Dpo2 might assist in bypass of UV-induced lesions by an unknown mechanism.
The question has been raised as to whether S. solfataricus Dpo2 or Dpo3 plays a role in Okazaki fragment synthesis (together with Dpo1 in leading strand DNA synthesis), as in the case of multiple DNA polymerases in eukaryotic cells (10). Alternatively, S. solfataricus Dpo1 could play a role in both leading and lagging strand DNA synthesis, as in E. coli (7, 10), although it should be pointed out that the E. coli DNA polymerase III is a complex, multisubunit protein. The latter scenario (Dpo1 as the sole replicative polymerase) is considered more probable because Dpo1 is catalytically much more efficient and processive, in the presence of all accessory replication factors, among the three B-family polymerases, although DNA synthesis by Dpo1 alone even appears to be rather distributive, at least under the in vitro conditions used here (Fig. 11). It is highly unlikely that Dpo2 or Dpo3 plays a role as a major replicative polymerase, on the basis of our in vitro data (Fig. 11), in that DNA synthesis was extremely slow and very distributive. These two DNA polymerases were even more blocked in the presence of SSB protein and thus are not adequate for long chromosomal DNA synthesis. However, we cannot exclude the possibility that Dpo2 and Dpo3 are rendered catalytically more efficient or activated by other unknown components in vivo. Detailed analyses of individual gene knock-out effects in S. solfataricus cells should be helpful in establishing if Dpo2 or Dpo3 is essential (i.e. Dpo2 or Dpo3 being a main replicative polymerase) and have been initiated. The presence of Dpo2 or Dpo3 should not affect DNA synthesis by Dpo1 or Dpo4, in that the concentration of Dpo1 in cells is quite similar to that of Dpo3 but is 10–20 times higher than that of Dpo2 or Dpo4 (Fig. 4). High concentrations of Dpo2 or Dpo3 (∼900-fold those of Dpo1 or Dpo4) did not block processive DNA synthesis by Dpo1 or Dpo4 (Fig. 14).
As pointed out earlier (10, 42), archaea such as S. solfataricus provide attractive model systems for DNA replication studies because of their simplicity as well as their similarities to eukaryotes (10). Dpo4 is not essential for normal physiological function; its presence provided resistance to the cytotoxicity of the cancer drug cisplatin (42). Thus, replication in this organism can be understood in the context of only a few single-subunit DNA polymerases, and the interactions with damaged DNA (Figs. 12 and 13) can be defined in vivo. In conclusion, our results suggest that the more efficient Dpo1 and Dpo4 play the catalytic roles as a main replicative DNA polymerase and a main translesion DNA polymerase, respectively, whereas the highly inefficient Dpo2 and Dpo3 may play limited catalytic roles in the bypass of oxidative and deaminated base lesions and/or UV-induced damage in short patches of DNA in S. solfataricus and other Sulfolobus species. Further studies on the interactions of these DNA polymerases and their accessory proteins are in progress.
Supplementary Material
Acknowledgment
We thank K. Trisler for assistance in preparation of the manuscript.
This work was supported, in whole or in part, by National Institutes of Health Grants R01 ES010375 (to F. P. G.), F32 CA119776 (to R. L. E.), K99 GM084460 (to R. L. E.), T32 ES007028 (to F. P. G. and M. G. P.), and P30 ES000267 (to F. P. G.). This work was also supported by the Basic Science Research Program of the National Research Foundation of Korea funded by the Ministry of Education, Science and Technology Grant 2010-0006538 (to J.-Y. C.) and a grant of the Korea Healthcare Technology R & D Project, Ministry for Health, Welfare, and Family Affairs, Republic of Korea, Grant A084187 (to J.-Y. C.).

The on-line version of this article (available at http://www.jbc.org) contains supplemental Tables S1 and S2 and Figs. S1–S3.
The current GenBankTM information lists two “Dpo2” genes with 68 overlapping bases, termed the carboxyl-end (NP_342896, 66-kDa protein) and amino-end (NP_342897, 10.4-kDa protein) genes. In cloning, the cDNA corresponding to the former could be amplified using primers, but a fused cDNA could not. Our immunoblot analyses showed only a protein of 65 kDa in the S. solfataricus cultures (at all time points). Thus, we conclude that the 66-kDa protein we expressed should be the intact Dpo2 DNA polymerase found in the organism; the assignment of NP_342897 (N-terminal, 10.4 kDa) as part of Dpo2 appears ambiguous.
- 8-oxoG
- 8-oxo-7,8-dihydrodeoxyguanosine
- AP
- apurinic
- Bz
- benzyl
- CTD
- cis-syn cyclobutane thymine (dimer)
- PCNA
- proliferating cell nuclear antigen (PCNA refers to the heterotrimeric complex of S. solfataricus PCNA1, PCNA2, and PCNA3)
- PIP
- PCNA-interacting protein
- RFC
- replication factor C (RFC refers to the heteropentamer of four small subunits and one large subunit)
- SSB
- single-stranded binding protein.
REFERENCES
- 1. Kornberg A., Baker T. A. (1992) DNA Replication, 2nd Ed., W.H. Freeman, New York [Google Scholar]
- 2. Friedberg E. C., Walker G. C., Siede W., Wood R. D., Schultz R. A., Ellenberger T. (2006) DNA Repair and Mutagenesis, 2nd Ed., American Society for Microbiology Press, Washington, D. C [Google Scholar]
- 3. Rothwell P. J., Waksman G. (2005) Adv. Protein Chem. 71, 401–440 [DOI] [PubMed] [Google Scholar]
- 4. Hubscher U., Maga G., Spadari S. (2002) Annu. Rev. Biochem. 71, 133–163 [DOI] [PubMed] [Google Scholar]
- 5. Rivera M. C., Lake J. A. (2004) Nature 431, 152–155 [DOI] [PubMed] [Google Scholar]
- 6. Yutin N., Makarova K. S., Mekhedov S. L., Wolf Y. I., Koonin E. V. (2008) Mol. Biol. Evol. 25, 1619–1630 [DOI] [PMC free article] [PubMed] [Google Scholar]
- 7. Böhlke K., Pisani F. M., Rossi M., Antranikian G. (2002) Extremophiles 6, 1–14 [DOI] [PubMed] [Google Scholar]
- 8. Zaparty M., Esser D., Gertig S., Haferkamp P., Kouril T., Manica A., Pham T. K., Reimann J., Schreiber K., Sierocinski P., Teichmann D., van Wolferen M., von Jan M., Wieloch P., Albers S. V., Driessen A. J., Klenk H. P., Schleper C., Schomburg D., van der Oost J., Wright P. C., Siebers B. (2010) Extremophiles 14, 119–142 [DOI] [PMC free article] [PubMed] [Google Scholar]
- 9. She Q., Singh R. K., Confalonieri F., Zivanovic Y., Allard G., Awayez M. J., Chan-Weiher C. C., Clausen I. G., Curtis B. A., De Moors A., Erauso G., Fletcher C., Gordon P. M., Heikamp-de Jong I., Jeffries A. C., Kozera C. J., Medina N., Peng X., Thi-Ngoc H. P., Redder P., Schenk M. E., Theriault C., Tolstrup N., Charlebois R. L., Doolittle W. F., Duguet M., Gaasterland T., Garrett R. A., Ragan M. A., Sensen C. W., Van der Oost J. (2001) Proc. Natl. Acad. Sci. U.S.A. 98, 7835–7840 [DOI] [PMC free article] [PubMed] [Google Scholar]
- 10. Duggin I. G., Bell S. D. (2006) J. Biol. Chem. 281, 15029–15032 [DOI] [PubMed] [Google Scholar]
- 11. Grúz P., Shimizu M., Pisani F. M., De Felice M., Kanke Y., Nohmi T. (2003) Nucleic Acids Res. 31, 4024–4030 [DOI] [PMC free article] [PubMed] [Google Scholar]
- 12. Zhang L., Brown J. A., Newmister S. A., Suo Z. (2009) Biochemistry 48, 7492–7501 [DOI] [PubMed] [Google Scholar]
- 13. Boudsocq F., Iwai S., Hanaoka F., Woodgate R. (2001) Nucleic Acids Res. 29, 4607–4616 [DOI] [PMC free article] [PubMed] [Google Scholar]
- 14. Edgell D. R., Klenk H. P., Doolittle W. F. (1997) J. Bacteriol. 179, 2632–2640 [DOI] [PMC free article] [PubMed] [Google Scholar]
- 15. Prangishvili D., Klenk H. P. (1993) Nucleic Acids Res. 21, 2768. [DOI] [PMC free article] [PubMed] [Google Scholar]
- 16. Choi J. Y., Chowdhury G., Zang H., Angel K. C., Vu C. C., Peterson L. A., Guengerich F. P. (2006) J. Biol. Chem. 281, 38244–38256 [DOI] [PubMed] [Google Scholar]
- 17. Choi J. Y., Guengerich F. P. (2004) J. Biol. Chem. 279, 19217–19229 [DOI] [PubMed] [Google Scholar]
- 18. Smith H. O., Hutchison C. A., 3rd, Pfannkoch C., Venter J. C. (2003) Proc. Natl. Acad. Sci. U.S.A. 100, 15440–15445 [DOI] [PMC free article] [PubMed] [Google Scholar]
- 19. Wu Z. L., Bartleson C. J., Ham A. J., Guengerich F. P. (2006) Arch. Biochem. Biophys. 445, 138–146 [DOI] [PubMed] [Google Scholar]
- 20. Zang H., Goodenough A. K., Choi J. Y., Irimia A., Loukachevitch L. V., Kozekov I. D., Angel K. C., Rizzo C. J., Egli M., Guengerich F. P. (2005) J. Biol. Chem. 280, 29750–29764 [DOI] [PubMed] [Google Scholar]
- 21. Pisani F. M., De Felice M., Carpentieri F., Rossi M. (2000) J. Mol. Biol. 301, 61–73 [DOI] [PubMed] [Google Scholar]
- 22. Laemmli U. K. (1970) Nature 227, 680–685 [DOI] [PubMed] [Google Scholar]
- 23. Guengerich F. P., Bartleson C. J. (2007) in Principles and Methods of Toxicology (Hayes A. W. ed) pp. 1981–2048, 5th Ed., CRC Press, Inc., Boca Raton, FL [Google Scholar]
- 24. Guengerich F. P., Wang P., Davidson N. K. (1982) Biochemistry 21, 1698–1706 [DOI] [PubMed] [Google Scholar]
- 25. Soucek P., Martin M. V., Ueng Y. F., Guengerich F. P. (1995) Biochemistry 34, 16013–16021 [DOI] [PubMed] [Google Scholar]
- 26. Guengerich F. P., Turvy C. G. (1991) J. Pharmacol. Exp. Ther. 256, 1189–1194 [PubMed] [Google Scholar]
- 27. Robb F. T., Place A. R. (1995) in Archaea: A Laboratory Manual, Vol. 3 (Robb F. T., Place A. R. eds) pp. 167–188, Cold Spring Harbor Laboratory Press, Woodbury, NY [Google Scholar]
- 28. Boosalis M. S., Petruska J., Goodman M. F. (1987) J. Biol. Chem. 262, 14689–14696 [PubMed] [Google Scholar]
- 29. Connolly B. A. (2009) Biochem. Soc. Trans. 37, 65–68 [DOI] [PubMed] [Google Scholar]
- 30. Savino C., Federici L., Johnson K. A., Vallone B., Nastopoulos V., Rossi M., Pisani F. M., Tsernoglou D. (2004) Structure 12, 2001–2008 [DOI] [PubMed] [Google Scholar]
- 31. van Passel M. W., Smillie C. S., Ochman H. (2007) Archaea 2, 137–143 [DOI] [PMC free article] [PubMed] [Google Scholar]
- 32. Vanin E. F. (1985) Annu. Rev. Genet. 19, 253–272 [DOI] [PubMed] [Google Scholar]
- 33. Jeanmougin F., Thompson J. D., Gouy M., Higgins D. G., Gibson T. J. (1998) Trends Biochem. Sci. 23, 403–405 [DOI] [PubMed] [Google Scholar]
- 34. Nicholas K. B., Nicholas H. B., Jr., Deerfield D. W., 2nd (1997) EMBNEW NEWS 4, 14 [Google Scholar]
- 35. Dionne I., Brown N. J., Woodgate R., Bell S. D. (2008) Mol. Microbiol. 68, 216–222 [DOI] [PubMed] [Google Scholar]
- 36. Dionne I., Nookala R. K., Jackson S. P., Doherty A. J., Bell S. D. (2003) Mol. Cell 11, 275–282 [DOI] [PubMed] [Google Scholar]
- 37. Moldovan G. L., Pfander B., Jentsch S. (2007) Cell 129, 665–679 [DOI] [PubMed] [Google Scholar]
- 38. Indiani C., McInerney P., Georgescu R., Goodman M. F., O'Donnell M. (2005) Mol. Cell 19, 805–815 [DOI] [PubMed] [Google Scholar]
- 39. Fröls S., Gordon P. M., Panlilio M. A., Duggin I. G., Bell S. D., Sensen C. W., Schleper C. (2007) J. Bacteriol. 189, 8708–8718 [DOI] [PMC free article] [PubMed] [Google Scholar]
- 40. Fröls S., White M. F., Schleper C. (2009) Biochem. Soc. Trans. 37, 36–41 [DOI] [PubMed] [Google Scholar]
- 41. Götz D., Paytubi S., Munro S., Lundgren M., Bernander R., White M. F. (2007) Genome Biol. 8, R220. [DOI] [PMC free article] [PubMed] [Google Scholar]
- 42. Wong J. H., Brown J. A., Suo Z., Blum P., Nohmi T., Ling H. (2010) EMBO J. 29, 2059–2069 [DOI] [PMC free article] [PubMed] [Google Scholar]
Associated Data
This section collects any data citations, data availability statements, or supplementary materials included in this article.


