Abstract
TREX1 is a potent 3′→5′ exonuclease that degrades single- and double-stranded DNA (ssDNA and dsDNA). TREX1 mutations at amino acid positions Asp-18 and Asp-200 in familial chilblain lupus and Aicardi-Goutières syndrome elicit dominant immune dysfunction phenotypes. Failure to appropriately disassemble genomic DNA during normal cell death processes could lead to persistent DNA signals that trigger the innate immune response and autoimmunity. We tested this concept using dsDNA plasmid and chromatin and show that the TREX1 exonuclease locates 3′ termini generated by endonucleases and degrades the nicked DNA polynucleotide. A competition assay was designed using TREX1 dominant mutants and variants to demonstrate that an intact DNA binding process, coupled with dysfunctional chemistry in the active sites, explains the dominant phenotypes in TREX1 D18N, D200N, and D200H alleles. The TREX1 residues Arg-174 and Lys-175 positioned adjacent to the active sites act with the Arg-128 residues positioned in the catalytic cores to facilitate melting of dsDNA and generate ssDNA for entry into the active sites. Metal-dependent ssDNA binding in the active sites of the catalytically inactive dominant TREX1 mutants contributes to DNA retention and precludes access to DNA 3′ termini by active TREX1 enzyme. Thus, the dominant disease genetics exhibited by the TREX1 D18N, D200N, and D200H alleles parallel precisely the biochemical properties of these TREX1 dimers during dsDNA degradation of plasmid and chromatin DNA in vitro. These results support the concept that failure to degrade genomic dsDNA is a principal pathway of immune activation in TREX1-mediated autoimmune disease.
Keywords: Autoimmune Diseases, DNA, DNase, Enzyme Mechanisms, Nucleic Acid
Introduction
Deoxyribonucleases are essential enzymes acting to degrade DNA polynucleotides in the orchestrated processes of dismantling dying cells and in defense from invading pathogens. Failure to efficiently degrade superfluous DNA macromolecules can result in persistent nucleic acids that activate the mammalian immune system (1). TREX1 is a 314-amino acid polypeptide containing a robust 3′-exonuclease that degrades ssDNA and dsDNA and is expressed ubiquitously in mammalian cells (2–4). The catalytic core of TREX1 is contained in the N-terminal 242 amino acids, and the C-terminal 72 amino acids contain a hydrophobic region that localizes TREX1 to the endoplasmic reticulum in the perinuclear space of cells (5). Located in the cytosol, TREX1 prevents the initiation of a cell-intrinsic autoimmune pathway by degrading ssDNA derived from endogenous retroelements (6). TREX1 also degrades HIV DNA generated during HIV-1 infection, preventing activation of intrinsic DNA sensors (7). Upon activation of a cell death pathway and treatment of cells with DNA-damaging agents, TREX1 relocates to the nucleus, where it acts on DNA 3′ termini (5, 8, 9).
The TREX1 gene is a single open reading frame located on chromosome 3p21.31 (10). Mutations in the human TREX1 gene have been linked to a spectrum of autoimmune diseases including the severe neurological brain disease Aicardi-Goutières syndrome (AGS)2 (11), to a monogenic form of cutaneous lupus erythematosus named “familial chilblain lupus” (FCL) (12–14), to systemic lupus erythematosus (15, 16), and to retinal vasculopathy and cerebral leukodystrophy (17). Approximately 40 TREX1 disease-causing missense and frameshift mutations have been identified, mapping to positions located throughout the gene (18, 19). Furthermore, mice lacking TREX1 develop inflammatory myocarditis consistent with autoimmune disease (20).
Multiple mechanisms of dysfunction underlie the observed clinical phenotypes in patients carrying TREX1 mutations, reflecting the position of the mutation and the stable dimeric structure. Our structural studies of the TREX1 catalytic domain with bound DNA reveal the protein-polynucleotide interactions that explain the requirement for ssDNA in the active site and highlight the extensive interface contacts in the remarkably stable dimeric enzyme (21). The TREX1 AGS-causing mutations locate predominantly to the catalytic core region with a few notable exceptions positioned in the C-terminal hydrophobic region (22). Some TREX1 AGS-causing mutants exhibit dramatically lower levels of catalytic function, whereas others show more modest effects on the ssDNA degradation activities, yet all yield similar human pathologies (21, 23). The TREX1 systemic lupus erythematosus-associated mutations are located mostly in the C-terminal region with a few variants positioned in the catalytic core. The heterozygous TREX1 mutations that cause retinal vasculopathy and cerebral leukodystrophy are all frameshifts in the C-terminal region (17). The TREX1 enzymes containing C-terminal mutations retain full catalytic function but fail to localize to the perinuclear space in cells (15, 17). Thus, disruptions in catalytic function and in cellular trafficking are mechanisms of TREX1 dysfunction in autoimmunity.
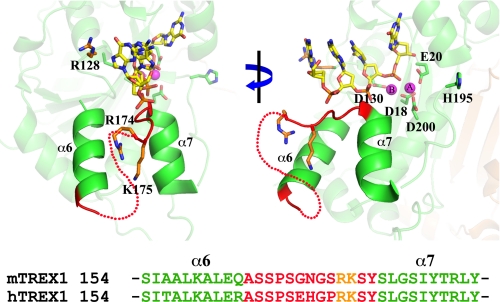
TREX1-mediated autoimmune disease exhibits both dominant and recessive genetics dependent upon the nature of the mutation. Heterozygous de novo and inherited mutations in the highly conserved TREX1 Asp-18 and Asp-200 metal-binding residues exhibit dominant FCL and AGS (12, 14, 19, 24). The disease phenotypes in dominant FCL and AGS patients correlate best with the dsDNA degradation activities measured in the TREX1 D18N and D200N enzymes and not with the ssDNA degradation activities (23). We have proposed that the inability to perform chemistry of phosphodiester bond cleavage resulting from the D18N or D200N mutation might trap the TREX1 mutant enzyme onto the dsDNA in a nonproductive enzyme-DNA complex at the site of the nick. These data support the proposal that TREX1 degrades dsDNA by acting at 3′ termini generated by the NM23-H1 endonuclease during cell death (5). The studies presented here show that the dsDNA degradation activities of TREX1 enzymes containing the FCL and AGS dominant D18N, D200N, and D200H mutations are defective and that these mutants inhibit the dsDNA degradation activity of TREX1WT enzyme, likely present in cells of these patients. The dominant effect of these TREX1 mutant enzymes is dependent upon the functional DNA binding by residues Arg-174 and Lys-175 positioned adjacent to the active sites and the Arg-128 positioned in the catalytic cores (see Fig. 1). In addition, metal-dependent DNA binding in the active sites of the catalytically inactive dominant TREX1 mutants contributes to DNA retention and precludes access to the DNA 3′ termini of nicked dsDNA by the TREX1WT enzyme.
FIGURE 1.
DNA binding in the TREX1 dimer. The region of bound ssDNA in the TREX1 (Protein Data Bank (PDB) number 2OA8) dimer (green) is highlighted. The proposed dsDNA-binding residues (orange) Arg-174 and Lys-175 positioned on a loop adjacent to the active site and Arg-128 in the catalytic core are indicated. The metal-binding residues (green) Asp-18, Glu-20, Asp-130, and Asp-200 and the nucleophile-generating His-195 (green) are indicated. The metal ions (cyan) and 4-mer ssDNA (as sticks) are shown bound in the active site. The flexible loop region (dotted line) connecting the α6 and α7 helices (shown in graphics formation) and a sequence alignment of this region for mammalian TREX1s are shown. The figure was prepared using PyMOL (Schrödinger, LLC), and sequences were aligned using CLUSTALW2.
EXPERIMENTAL PROCEDURES
Materials
The synthetic 30-mer oligonucleotide 5′-ATACGACGGTGACAGTGTTGTCAGACAGGT-3′ with 5′-fluorescein was from Operon. Plasmid pR01-250 is a derivative of pUC19 provided by J. Hays (Oregon State University), and plasmid 1 is a derivative of the pMYC plasmid (New England Biolabs). Both plasmids contain one Nt.BbvCI restriction enzyme site. Plasmids were purified from bacterial cultures and from restriction enzyme digests using Qiagen kits. Nuclei were prepared from hamster livers as described (25).
Enzyme Preparation
The human recombinant TREX1 enzymes were expressed in bacteria and purified as stable homo- or heterodimers as described (23). Briefly, mutant TREX1-containing plasmids were produced using a PCR site-directed mutagenesis strategy and confirmed by DNA sequencing. The TREX1WT and homodimer enzymes (amino acids 1–242) were expressed in bacteria as N-terminal maltose-binding protein (MBP) fusions with a PreScission protease recognition sequence between the MBP and TREX1. The MBP-TREX1 fusion protein was bound to an amylose resin (New England Biolabs) and washed, and the TREX1 was separated from the MBP with PreScission protease (GE Biosciences). The TREX1 was collected and purified to homogeneity using phosphocellulose chromatography.
To generate TREX1 heterodimers, one TREX1-containing plasmid was engineered to express MBP-TREX1, and a second was engineered to express His-NusA-TREX1. Co-expression of the two plasmids in the same bacterial cell generates a mixture of TREX1 homodimers containing only the MBP and only the His-NusA affinity tags and TREX1 heterodimers containing both affinity tags. The TREX1 heterodimers are separated from the homodimers by sequential chromatography using nickel-nitrilotriacetic acid (Qiagen) and amylose resins (New England Biolabs). The TREX1 heterodimers were purified by phosphocellulose or MonoQ chromatography. Protein concentrations were determined by A280 using the molar extinction coefficient for human TREX1 protomer ϵ = 23,950 m−1 cm−1. Aliquots (3 μg) of the TREX1 preparations were analyzed by 12% SDS-PAGE and visualized by Coomassie Blue staining (supplemental Fig. S1). Gel images were generated using a FluorChem 8900 imaging system (Alpha Innotech) and scanned using ImageQuant TL version7.0 to obtain densitometric profiles and to determine the final TREX1 protein concentrations. The NM23-H1 (26) and APE1 fragment (amino acids 32–318) (27) endonucleases were cloned into plasmids as N-terminal MBP fusions with a PreScission protease recognition sequence between the MBP and the endonuclease. The MBP fusion endonucleases were overexpressed in Escherichia coli BL21(DE3) Rosetta 2 cells (Novagen), bound to amylose resins (New England Biolabs), and washed, and the column resin was incubated at 4 °C overnight with PreScission protease (GE Biosciences) to separate the endonuclease from MBP. The NM23-H1 and APE1 fragments were collected from the column flow-through, dialyzed against 50 mm Tris-HCl (pH 7.5), 50 mm NaCl, 1 mm EDTA, and 10% glycerol, and stored at −80 °C.
Exonuclease Assays
The exonuclease reactions contained 20 mm Tris-HCl (pH 7.5), 5 mm MgCl2, 2 mm dithiothreitol, 100 μg/ml bovine serum albumin, 50 nm fluorescein-labeled 30-mer oligonucleotide (ssDNA assays) or 10 μg/ml plasmid DNA (dsDNA assays), and TREX1 protein as indicated in the legends for Figs. 26–10. The TREX1 enzyme and variant mixtures in the competition assays were prepared on ice at 10× the final concentrations to allow the addition of TREX1 dimer mixtures simultaneously to reactions yielding the indicated final concentrations. Reactions were incubated at 25 °C for 30 min or as indicated. Reactions were quenched by the addition of 3 volumes of cold ethanol and dried in vacuo. For ssDNA assays, the reaction products were resuspended in 4 μl of formamide and separated on 23% denaturing polyacrylamide gels. Fluorescently labeled bands were visualized and quantified using a Storm PhosphorImager (GE Healthcare). The fraction of oligomer at each position was multiplied by the number of dNMPs excised from the 30-mer and by the total fmol of 30-mer in the starting reaction to determine the activities for TREX1WT and variants (fmol of dNMP/s/fmol of enzyme).
FIGURE 2.
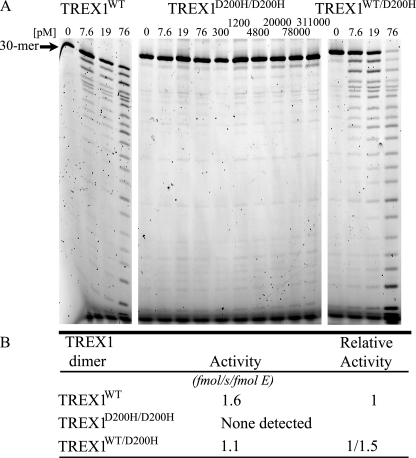
The ssDNA exonuclease activities of TREX1 D200H variants. Standard exonuclease reactions (30 μl) were prepared with a fluorescein-labeled 30-mer oligonucleotide, and dilutions of the recombinant TREX1WT, TREX1D200H/D200H, and TREX1WT/D200H were prepared at 10 times the final concentrations. Samples (3 μl) containing the TREX1 enzymes to yield the final indicated concentrations were added to reactions. The reactions were incubated for 30 min at 25 °C. A and B, the reaction products were subjected to electrophoresis on 23% urea-polyacrylamide gels (A) and quantified as described under “Experimental Procedures.” B, to precisely quantify results, the relative exonuclease activities of TREX1WT and TREX1WT/D200H were assayed in triplicate at 38, 57, and 76 pm as described above. Plots of activity versus enzyme concentrations were used to confirm the linearity of the assay and to generate the enzyme activity values. The average activities and standard errors were determined by regression analysis using SigmaPlot 8.02 (SPSS Science, Inc.). The relative activity was calculated as: relative activity = 100 × ((fmol of dNMP released/s/fmol of mutant enzyme)/(fmol of dNMP released/s/fmol WT enzyme)). The position of migration of the 30-mer is indicated.
FIGURE 3.
The TREX1WT/D18N, TREX1WT/D200H, and TREX1WT/D200N have defective dsDNA degradation activities and inhibit TREX1WT. A, the exonuclease reactions (20 μl) were prepared containing nicked dsDNA plasmid pR01-250 and no enzyme (lane 1), TREX1WT (lane 2), TREX1WT/D18N (lane 3), TREX1WT/D200H (lane 4), and TREX1WT/D200N (lane 5) at 200 nm concentration. B, the exonuclease reactions contained nicked dsDNA plasmid 1 and no enzyme (lane 6), the indicated concentration of TREX1WT only (lane 7), a mixture of TREX1WT with the indicated increased concentrations of TREX1D200H/D200H (lanes 8–12), or TREX1WT/D200H (lanes 13–17). The reactions were incubated for 30 min, and the products were subjected to agarose gel electrophoresis. The positions of migration of Form II (Nicked dsDNA) and circular ssDNA (ssDNA) are indicated.
FIGURE 4.
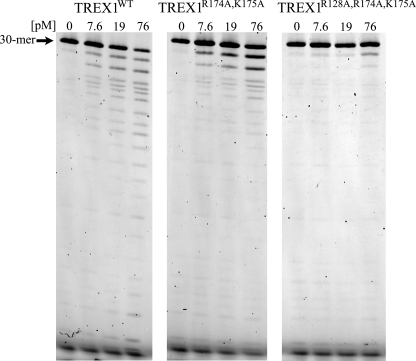
The ssDNA exonuclease activities of TREX1 DNA-binding variants. Standard exonuclease reactions (30 μl) were prepared with a fluorescein-labeled 30-mer oligonucleotide, and dilutions of the recombinant TREX1WT, TREX1R174A/K175A, and TREX1R128A,R174A/K175A were prepared at 10 times the final concentrations. Samples (3 μl) containing the TREX1 enzymes to yield the final indicated concentrations were added to reactions. The reactions were incubated for 30 min at 25 °C. The reaction products were subjected to electrophoresis on 23% urea-polyacrylamide gels and quantified as described under “Experimental Procedures.” The position of migration of the 30-mer is indicated.
FIGURE 5.
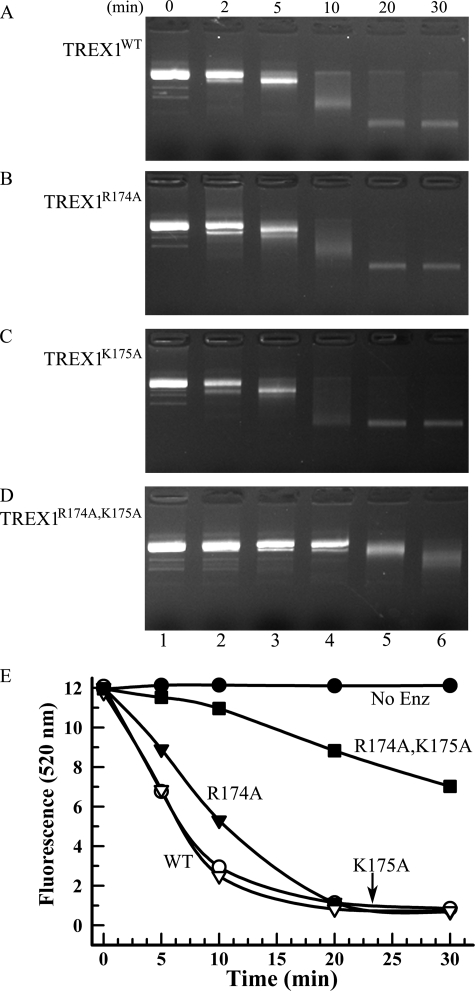
The dsDNA exonuclease activities of TREX1 flexible loop variants. Exonuclease time course reactions (110 μl) were prepared containing nicked dsDNA plasmid 1 and 100 nm TREX1WT (A and E), TREX1R174A (B and E), TREX1K175A (C and E), and TREX1R174A,K175A (D and E). Samples (20 μl) were removed prior to enzyme addition (0 min) and after incubation for the indicated times (A–E). The reaction products were subjected to electrophoresis on agarose gels and visualized by ethidium staining (A–D) or quenched in 15× SYBR Green, and dsDNA remaining was determined by emission at 520 nm (E) as described under “Experimental Procedures.” No Enz, no enzyme.
FIGURE 6.
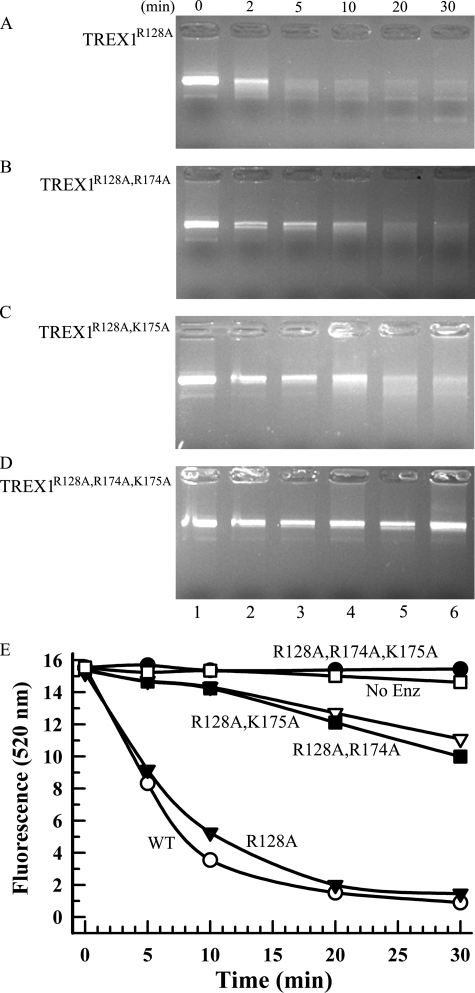
The dsDNA exonuclease activities of TREX1 DNA-binding variants. Exonuclease time course reactions (110 μl) were prepared containing nicked dsDNA plasmid 1 and TREX1R128A (A and E), TREX1R128A,R174A (B and E), TREX1R128A,K175A (C and E), and TREX1R128A,R174A,K175A (D and E) at 750 nm (A–D) and 350 nm (E). Samples (20 μl) were removed prior to enzyme addition (0 min) and after incubation for the indicated times (A–E). The reaction products were subjected to electrophoresis on agarose gels and visualized by ethidium staining (A–D) or quenched in 15× SYBR Green, and dsDNA remaining was determined by emission at 520 nm (E) as described under “Experimental Procedures.” No Enz, no enzyme.
FIGURE 7.
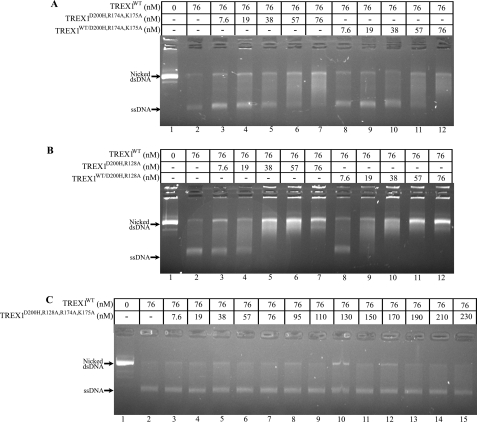
DNA-binding residues in the TREX1 D200H dominant mutant. The exonuclease reactions contained nicked dsDNA plasmid 1 and no enzyme (A–C, lane 1), the indicated concentration of TREX1WT only (A–C, lane 2), or a mixture of TREX1WT with the indicated increased concentrations of TREX1D200H,R174A,K175A (A, lanes 3–7), TREX1WT/D200H,R174A,K175A (A, lanes 8–12), TREX1D200H,R128A (B, lanes 3–7), TREX1WT/D200H,R128A (B, lanes 8–12), or TREX1D200H,R128A,R174A,K175A (C, lanes 3–15). The reactions were incubated for 30 min, and the products were subjected to agarose gel electrophoresis. The positions of migration of Form II (Nicked dsDNA) and circular ssDNA (ssDNA) are indicated.
FIGURE 8.
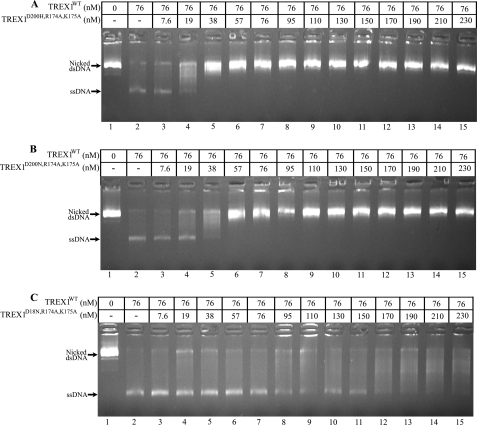
The TREX1 Asp-200 dominant mutants inhibit TREX1WT dsDNA degradation more than the Asp-18 mutant. The exonuclease reactions contained nicked dsDNA plasmid 1 and no enzyme (A–C, lane 1), the indicated concentration of TREX1WT only (A–C, lane 2), or a mixture of TREX1WT with the indicated increased concentrations of TREX1D200H,R174A,K175A (A, lanes 3–15), TREX1D200N,R174A,K175A (B, lanes 3–15), or TREX1D18N,R174A,K175A (C, lanes 3–15). The reactions were incubated for 30 min, and the products were subjected to agarose gel electrophoresis. The positions of migration of Form II (Nicked dsDNA) and circular ssDNA (ssDNA) are indicated.
FIGURE 9.
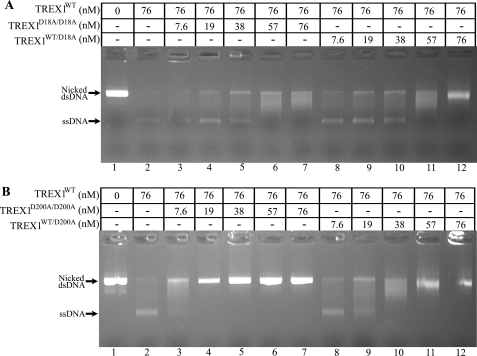
Metal-dependent DNA binding in the TREX1 dominant mutants. The exonuclease reactions contained nicked dsDNA plasmid 1 and no enzyme (lane 1), the indicated concentration of TREX1WT only (lane 2), or a mixture of TREX1WT with the indicated increased concentrations of TREX1D18A/D18A (lanes 3–7) or TREX1D200A/D200A (lanes 8–12). The reactions were incubated for 30 min, and the products were subjected to agarose gel electrophoresis. The positions of migration of Form II (Nicked dsDNA) and circular ssDNA (ssDNA) are indicated.
FIGURE 10.
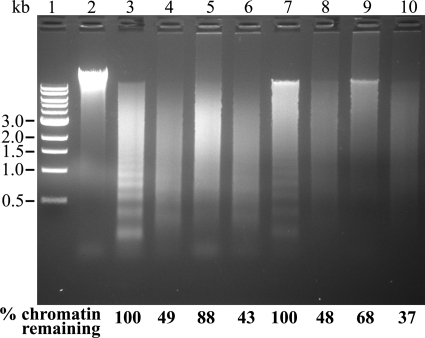
The TREX1 dominant mutants inhibit TREX1WT degradation of chromatin DNA. Reactions (20 μl) were prepared containing hamster nuclei and no enzyme (lane 2); 2.5 μg of NM23-H1 (lane 3); 2.5 of μg NM23-H1, 1 μg of TREX1WT (lane 4); 2.5 μg of NM23-H1, 1 μg of TREX1WT, 1 μg of TREX1D18N/D18N, 1 μg of TREX1WT/D18N (lane 5); 2.5 μg of NM23-H1, 1 μg of TREX1WT, 1 μg of TREX1D18N,R128A,R174A,K175A (lane 6); 5 μg of APE1 fragment (lane 7); 5 μg of APE1 fragment, 1 μg of TREX1WT (lane 8); 5 μg of APE1 fragment, 1 μg of TREX1WT, 1 μg of TREX1D18N/D18N, 1 μg of TREX1WT/D18N (lane 9); and 5 μg of APE1 fragment, 1 μg of TREX1WT, 1 μg of TREX1D18N,R128A,R174A,K175A (lane 10). Lane 1 contains the 1-kb ladder (Invitrogen).
For visualization of dsDNA reaction products, assays were resuspended in 10 μl of TAE agarose gel running solution and electrophoresed on 0.8% agarose gels containing ethidium bromide. DNA was visualized using a FluorChem 8900 imaging system (Alpha Innotech). For quantification of dsDNA degradation, samples (20 μl) were removed at the indicated times and quenched in wells of a 96-well plate containing 20 μl of 15× SYBR Green (Invitrogen). Fluorescent emission at 522 nm was determined using a POLARstar Omega microplate reader (BMG LABTECH). The amount of dsDNA remaining was determined by comparing fluorescence values with those obtained from a standard curve of fluorescence emission using varied plasmid 1 concentrations (1–10 μg/ml) stained with SYBR Green. The amount of dsDNA degraded was used to calculate dNMPs excised and activities for TREX1WT and variants (fmol of dNMP/s/fmol of enzyme).
RESULTS AND DISCUSSION
The TREX1 exonuclease degrades ssDNA and dsDNA polynucleotide substrates containing available 3′ termini. Structural studies of the TREX1-DNA complex provide direct evidence for ssDNA binding of at least four nucleotides in length in the active sites (Fig. 1) (21). Amino acid residues Asp-18 and Asp-200 are two of the divalent metal ion Mg2+-coordinating aspartates in the TREX1 active site that contribute to DNA binding and are required for catalysis. Residues Arg-174 and Lys-175 located on a flexible loop adjacent to the active sites and Arg-128 in the catalytic core are positioned appropriately to function in DNA binding to locate available 3′ termini and generate ssDNA for entry into the active sites.
The TREX1 ssDNA Exonuclease Activities of Dominant Mutants
The dominant TREX1 D18N, D200N, and D200H de novo and inherited mutations have been identified in FCL and AGS (12, 14, 19). The dominant phenotypes caused by these TREX1 alleles and the metal binding functions of these residues suggest a common mechanism of dysfunction. TREX1 is a homodimer, so TREX1 dimers in cells of these heterozygous individuals could be TREX1MUT/MUT and TREX1WT/WT homodimers and TREX1WT/MUT heterodimers. Therefore, the TREX1D200H/D200H and TREX1WT/WT homodimers and TREX1WT/D200H heterodimers were prepared, and the ssDNA degradation activities of these enzymes were compared with the activities of the TREX1 D18N and D200N mutants that we had previously determined (Fig. 2 and Table 1). The ssDNA exonuclease activities of the dominant TREX1 D18N, D200N, and D200H homodimers were reduced by more than 104-fold when compared with TREX1WT. The activities of the TREX1 D18N, D200N, and D200H heterodimers are reduced by only 1.5-, 2.6-, and 1.5-fold when compared with TREX1WT (Fig. 2 and Table 1). The ∼2-fold loss in activity of the TREX1 heterodimers indicates that the TREX1WT protomer within the dimer retains fully functional ssDNA degradation activity. This ∼50% reduction in ssDNA degradation activity has been demonstrated in patient cells carrying the D200N allele (14). The ssDNA degradation activities of the TREX1 dominant mutants suggest that TREX1 protomers within the dimer can act independently during the degradation of small ssDNA substrates.
TABLE 1.
Relative ssDNA exonuclease activities of TREX1WT and dominant variants
| TREX1 | Relative activitya | Study |
|---|---|---|
| WTb | 1 | This study and Refs. 4, 21, and 23 |
| WT/D200H | 1/1.5 | This study |
| D200H/D200H | None detected | This study |
| WT/D18N | 1/2.6 | Ref. 12 |
| D18N/D18N | 1/160,000 | Ref. 12 |
| WT/D200N | 1/1.5 | Ref. 23 |
| D200N/D200N | 1/20,000 | Ref. 23 |
a Activities were derived from reactions in Fig. 2 or as previously reported. Relative activities are calculated as: relative activity = 100 × ((fmol of dNMP released/s/fmol of mutant enzyme)/(fmol of dNMP released/s/fmol WT enzyme)).
b WT = wild type.
The TREX1 dsDNA Exonuclease Activities of Dominant Mutants
The dominant negative effects of the TREX1 D18N, D200N, and D200H alleles are apparent upon examination of the dsDNA degradation activities. The TREX1 D18N, D200N, and D200H protomers within the heterodimers exhibit a dominant inhibitory effect on the dsDNA degradation activities of the TREX1WT protomer. Incubation of nicked plasmid dsDNA with TREX1WT homodimer results in the degradation of the nicked polynucleotide strand and the accumulation of the un-nicked ssDNA strand (Fig. 3A, lane 2). In contrast, the TREX1WT/D18N, TREX1WT/D200H, and TREX1WT/D200N heterodimers do not degrade the nicked dsDNA plasmid (Fig. 3A, lanes 3–5). Additions of up to 10-fold higher concentrations of the TREX1 mutant heterodimers resulted in no detectable dsDNA degradation (Ref. 23 and data not shown). These data indicate that the dominant TREX1 D18N, D200N, and D200H heterodimers exhibit at least a 200-fold decreased level of dsDNA degradation activity relative to TREX1WT in contrast to the modest ∼2-fold level of reduced ssDNA degradation activity by these mutant heterodimers (Table 1).
The TREX1 Dominant Mutants Inhibit the TREX1WT dsDNA Degradation Activity
The TREX1 D200H protomers in the TREX1D200H/D200H homodimers and TREX1WT/D200H heterodimers exhibit a dominant inhibitory effect on the dsDNA degradation activity of TREX1WT. The TREX1WT enzyme was mixed with increased amounts of the TREX1D200H/D200H and TREX1WT/D200H enzymes and incubated with the nicked dsDNA plasmid (Fig. 3B). In these reactions, the TREX1WT competes with the mutant TREX1 enzyme to degrade the nicked dsDNA plasmid. The amount of TREX1WT (76 nm) added in these reactions is 10-fold higher than the amount required to degrade the nicked polynucleotide of the dsDNA (23). The presence of increased amounts of the TREX1D200H/D200H (Fig. 3B, lanes 8–12) and TREX1WT/D200H (Fig. 3B, lanes 13–17) results in decreased dsDNA degradation activity by the TREX1WT enzyme as evidenced by the increased amount of remaining nicked dsDNA. The inhibition of TREX1WT dsDNA degradation activity by the TREX1D200H/D200H and TREX1WT/D200H enzymes is similar to that previously demonstrated with the TREX1 D18N and D200N mutations (23). The potent inhibition of TREX1WT dsDNA degradation activity exhibited by TREX1 dimers containing D18N, D200N, and D200H protomers could explain the dominant phenotypes exhibited by these TREX1 mutant alleles described in FCL and AGS (12, 14). These data suggest that FCL and AGS TREX1 D18N, D200N, and D200H heterozygote patients likely have varying mixtures of TREX1 WT and mutant homo- and heterodimers. The TREX1 D18N-, D200N-, and D200H-containing dimers would likely inhibit the TREX1WT dsDNA degradation activity in these cells.
Identification of TREX1 Residues Contributing to DNA Binding
The TREX1 Arg-174, Lys-175, and Arg-128 residues are positioned within the enzyme to participate in DNA binding. To measure the contribution of these residues in the TREX1-catalyzed reaction, a series of variant enzymes was generated in which each of these residues was changed to alanine individually or in combinations. The TREX1 and variant proteins were tested to confirm the presence of nuclease activity using a 30-mer oligonucleotide and to establish the relative ssDNA excision activities (Fig. 4 and Table 2). The TREX1R174A and TREX1K175A exhibit no loss of activity, and the TREX1R174A,K175A shows a modest ∼3-fold reduced excision activity relative to the TREX1WT. These data indicate some contribution to ssDNA binding by the Arg-174 and Lys-175 that is satisfied by the presence of one of these residues on the flexible loop. The TREX1R128A exhibits an ∼2-fold reduced excision activity relative to the TREX1WT, also indicating a modest contribution to ssDNA binding by the Arg-128 located in the catalytic core. The TREX1R128A,R174A and TREX1R128,K175A double mutants exhibit ∼3-fold reduced excision activities, consistent with the requirement for one of the positively charged flexible loop residues (Arg-174 or Lys-175) and Arg-128 in the core for full ssDNA exonuclease activity. The TREX1R128A,R174A,K175A triple mutant exhibits an ∼30-fold reduced excision activity, further demonstrating the requirement for a single positively charged residue positioned on the flexible loop and the Arg-128 within the catalytic core for full ssDNA degradation activity. Also, a steady-state kinetic analysis indicated an ∼35-fold higher Km value for the TREX1R128A,R174A,K175A when compared with the TREX1WT protein and similar kcat values, confirming the structural integrity of the mutant enzyme and further supporting the diminished DNA binding potential (data not shown). However, the ∼3-fold magnitude in loss of TREX1 catalytic function upon mutation of the flexible loop Arg-174 and Lys-175 residues contrasts sharply with the ∼200-fold loss of TREX2 catalytic function upon mutation of the comparable Arg-163, Arg-165, and Arg-167 flexible loop residues (Refs. 28 and 29 and data not shown). Furthermore, the TREX1 Arg-128 is not conserved in TREX2, where this residue is Asp-121. These data point to a unique function for Arg-128, Arg-174, and Lys-175 in TREX1 DNA degradation activities.
TABLE 2.
Relative ssDNA and dsDNA exonuclease activities of TREX1WT and variants
| TREX1 | ssDNA activitya | Relative activityb | dsDNA activityc | Relative activityb |
|---|---|---|---|---|
| fmol/s/fmol of E | fmol/s/fmol of E | |||
| WTd | 1.9 ± 0.03 | 1 | 0.72 ± 0.02 | 1 |
| R174A | 2.3 ± 0.09 | 1/0.83 | 0.33 ± 0.02 | 1/2.1 |
| K175A | 2.4 ± 0.02 | 1/0.77 | 0.55 ± 0.003 | 1/1.3 |
| R128A | 0.79 ± 0.01 | 1/2.4 | 0.090 ± 0.002 | 1/8.3 |
| R128A,R174A | 0.60 ± 0.09 | 1/3.1 | 0.010 ± 0.0003 | 1/71 |
| R128A,K175A | 0.68 ± 0.01 | 1/2.8 | 0.014 ± 0.0003 | 1/47 |
| R174A,K175A | 0.62 ± 0.01 | 1/3.0 | 0.043 ± 0.003 | 1/20 |
| R128A,R174A,K175A | 0.060 ± 0.0006 | 1/29 | 0.002 ± 0.00007 | 1/500 |
a ssDNA exonuclease activity assays were performed in triplicate at three different concentrations as described under “Experimental Procedures.” Plots of activity versus enzyme concentrations were used to confirm linearity of the assay and to generate the enzyme activity values. The average activities and standard errors were determined by regression analysis using SigmaPlot 8.02 (SPSS Science, Inc.).
b The relative activity was calculated as: Relative activity = 100 × ((fmol of dNMP released/s/fmol of mutant enzyme)/(fmol of dNMP released/s/fmol WT enzyme)).
c dsDNA exonuclease activity assays were performed at enzyme concentrations linear during the time course. Samples were removed at X times and resolved on agarose gels (Fig. 5A) or DNA degradation quantified (Fig. 5B) as described under “Experimental Procedures.” Plots of activity versus enzyme concentrations confirmed the linearity of the assay and were used to generate the enzyme activity values. The average activities and standard errors were determined by regression analysis using SigmaPlot 8.02 (SPSS Science, Inc.).
d WT = wild type.
The TREX1 Arg-174 and Lys-175 flexible loop residues and the Arg-128 located in the catalytic core contribute to dsDNA degradation activity. Incubation of TREX1WT with a singly nicked dsDNA plasmid results in the degradation of the nicked polynucleotide strand and the accumulation of the un-nicked ssDNA strand (23). To determine the effects of TREX1 DNA-binding mutations on dsDNA degradation activity, a quantitative fluorescence assay was developed (Figs. 5 and 6). The TREX1WT and variants were incubated with nicked dsDNA in time course reactions, and DNA degradation was visualized in agarose gels (Figs. 5A and 6A) and quantified by SYBR Green fluorescence emission (Figs. 5B and 6B). The TREX1R174A and TREX1K175A variants exhibit modest but reproducibly reduced dsDNA degradation activities (Fig. 5, A and B, and Table 2). Further, the TREX1R174A,K175A double mutant exhibited a much greater ∼20-fold reduction in dsDNA degradation activity when compared with TREX1WT (Fig. 5, A and B, and Table 2). This 20-fold reduction in dsDNA degradation activity contrasts with the more modest 3-fold reduction in ssDNA degradation activity, indicating that Arg-174 and Lys-175 positioned on the flexible loop region contribute more substantially to dsDNA degradation by TREX1.
The TREX1 Arg-128 located in the catalytic core contributes to dsDNA degradation activity. Incubation of the TREX1R128A variant with nicked dsDNA resulted in ∼8-fold reduced dsDNA degradation activity when compared with TREX1WT (Fig. 6, A and B, and Table 2), contrasting the modest ∼2-fold reduction in ssDNA degradation activity of this variant. The TREX1R128A,R174A and TREX1R128A,K175A double mutants exhibited much greater ∼60-fold reduced dsDNA degradation activities when compared with TREX1WT (Fig. 6, A and B, and Table 2). These large reductions in dsDNA degradation activities contrast with the modest ∼3-fold reduced ssDNA activities of these TREX1 mutants (Table 2). Finally, the TREX1R128A,R174A,K175A variant exhibits ∼500-fold reduced dsDNA degradation activity relative to TREX1WT (Fig. 6, A and B, and Table 2). These data indicate that Arg-174 and Lys-175 positioned on the flexible loop adjacent to the active sites and Arg-128 positioned in the catalytic core contribute to dsDNA binding and subsequent generation of a partial duplex DNA containing sufficient ssDNA for entry into the TREX1 active site and degradation.
Proficient dsDNA Binding by TREX1 Dominant Mutants Is Required for Inhibition of TREX1WT
The dominant inhibitory effect exhibited by TREX1 enzymes containing D18N, D200N, and D200H mutations on the dsDNA degradation activity of TREX1WT is dependent upon DNA binding contributions by Arg-174, Lys-175, and Arg-128. A collection of TREX1 D18N-, D200N-, and D200H-containing homodimers and heterodimers with additional mutations of R174A, K175A, and R128A was prepared and tested for dominant inhibition of TREX1WT dsDNA degradation (Fig. 7 and supplemental Figs. S2 and S3). The TREX1WT enzyme was mixed with increased amounts of the TREX1D200H,R174A,K175A (Fig. 7A, lanes 3–7), TREX1WT/D200H,R174A,K175A (Fig. 7A, lanes 8–12), TREX1D200H,R128A (Fig. 7B, lanes 3–7), TREX1WT/D200H,R128A (Fig. 7B, lanes 8–12), and TREX1D200H,R128A,R174A,K175A (Fig. 7C, lanes 3–15) and incubated with the nicked dsDNA plasmid. In these reactions, the catalytically inactive TREX1 D200H-containing enzymes compete with the TREX1WT to bind the nicked dsDNA plasmid and inhibit degradation by TREX1WT. Increased inhibition of TREX1WT degradation of the nicked polynucleotide strand is apparent by the decreased accumulation of the un-nicked ssDNA upon the addition of increased amounts of the TREX1 D200H mutants containing R174A,K175A (Fig. 7A) and TREX1 D200H mutants containing R128A (Fig. 7B). However, the magnitudes of the TREX1WT inhibition by TREX1D200H,R174A,K175A and TREX1D200H,R128A are dramatically reduced when compared with the levels of inhibition exhibited by the TREX1D200H/D200H and TREX1WT/D200H as apparent from the much lower concentrations of the D200H enzymes needed for complete TREX1WT inhibition (compare Fig. 3B with Fig. 7, A and B). Complete inhibition of TREX1WT (76 nm) is achieved in competition reactions at concentrations of ∼19 nm for TREX1D200H/D200H and ∼38 nm for TREX1WT/D200H (Fig. 3B). In contrast, it is apparent in these competition reactions that greater concentrations of TREX1D200H,R174A,K175A (Fig. 7A) and TREX1D200H,R128A (Fig. 7B) are required to completely inhibit TREX1WT dsDNA degradation. Further, the TREX1D200H,R128A,R174A,K175A quadruple mutant exhibits no detectable TREX1WT dsDNA degradation inhibition upon additions of up to 230 nm (Fig. 7C). Thus, the Arg-174, Lys-175, and Arg-128 contribute to TREX1 dsDNA binding in the D18N, D200N, and D200H dominant mutations as evidenced by the diminished inhibitory effect on TREX1WT dsDNA degradation activity upon mutation of these residues to alanine (Fig. 7 and supplemental Figs. S1 and S2). The proficient DNA binding contributed by these positively charged residues contributes to the dominant phenotypes of these TREX1 alleles and highlights these three residues in the TREX1 dsDNA degradation mechanism.
The dominant TREX1 D200N and D200H alleles cause a more aggressive AGS autoimmune disease than the TREX1 D18N allele that causes FCL (12, 14, 19). The more aggressive AGS disease phenotype correlates with a greater inhibitory effect of the mutations at Asp-200 on TREX1WT dsDNA degradation activity when compared with the TREX1 mutation at Arg-18 (Fig. 8). To demonstrate the greater TREX1WT inhibition by the TREX1 Asp-200 mutants, increased concentrations of TREX1D200H,R174A,K175A (Fig. 8A, lanes 3–15), TREX1D200N,R174A,K175A (Fig. 8B, lanes 3–15), and TREX1D18N,R174A,K175A (Fig. 8C, lanes 3–15) were mixed with TREX1WT, and dsDNA degradation was examined. The level of TREX1WT inhibition by TREX1D200H,R174A,K175A is similar to that of TREX1D200N,R174A,K175A, and both of these TREX1 Asp-200-containing mutants exhibit a greater level of TREX1WT inhibition when compared with the TREX1D18N,R174A,K175A. The greater level of TREX1WT dsDNA degradation inhibition by the TREX1 Asp-200 mutants when compared with the Asp-18 mutant indicates a greater DNA binding affinity for the nicked dsDNA. These data support the idea that the dominant AGS and FCL phenotypes observed with the TREX1 Asp-200 and Asp-18 mutations relate to impaired dsDNA degradation and indicate the TREX1 dsDNA degradation activity as fundamental to the prevention of autoimmunity.
Metal-dependent DNA Binding in the Active Sites Contributes to the Dominant TREX1 Phenotype
The dominant inhibitory effect exhibited by TREX1 containing D18N, D200N, and D200H mutations on the dsDNA degradation activity of TREX1WT depends, in part, on the metal binding contributions of Asp-18 and Asp-200. The carboxylate oxygens of Asp-18, Glu-20, Asp-130, and Asp-200, several water molecules, and the phosphate oxygens of the ssDNA 3′-nucleotide contribute to the coordination of two divalent metal ions A and B in TREX1 (Fig. 1). The Asp-18 coordinates metals A and B and Asp-200 the metal at position A (21). Thus, mutations at Asp-18 and Asp-200 to alanine are likely to compromise metal binding in the TREX1 active sites. The TREX1 D18A and D200A homo- and heterodimers were prepared and tested for inhibition of TREX1WT dsDNA degradation to determine whether metal binding contributes to the TREX1 dominant mutant phenotype. The TREX1WT enzyme was mixed with increased amounts of the TREX1 D18A and D200A enzymes and incubated with the nicked dsDNA plasmid (Fig. 9). In these reactions, the TREX1WT competes with the increased amounts of the TREX1D18A/D18A (Fig. 9A, lanes 3–7), TREX1WT/D18A (Fig. 9A, lanes 8–12), TREX1D200A/D200A (Fig. 9B, lanes 3–7), and TREX1WT/D200A (Fig. 9B, lanes 8–12), resulting in varied levels of nicked dsDNA degradation by TREX1WT as evidenced by the accumulated ssDNA product. The TREX1WT dsDNA degradation activity is inhibited to a lesser extent by the TREX1 D18A-containing mutants than by the D18N-containing mutants (compare Fig. 9A with Fig. 6B in Ref. 23). In contrast, the TREX1 D200A-containing mutants inhibit the TREX1WT dsDNA degradation activity similarly to the D200H- and D200N-containing mutants (compare Fig. 9B with Fig. 3B in the present work and with Fig. 6A in Ref. 23). Mutation of Asp-18 to alanine likely diminishes metal ion binding at positions A and B, whereas mutation of Asp-200 to alanine likely reduces metal ion binding at position A. Thus, these results suggest that metal binding at position B in the TREX1 active site contributes mostly to ssDNA binding, whereas metal binding at position A contributes more to the chemistry of phosphodiester bond cleavage.
TREX1 Degrades Genomic DNA
The DNA degradation properties of the TREX1 Asp-18 and Asp-200 dominant mutations using plasmid DNA suggest that an in vivo DNA substrate is nicked dsDNA. The association of TREX1 with the SET complex and granzyme A-mediated cell death further implicates TREX1 in nuclear DNA degradation after nicking by DNA endonucleases during cell death processes (5, 8). To test this idea, we prepared hamster liver nuclei and examined the TREX1WT and variants for dsDNA degradation activities using nicked chromatin DNA (Fig. 10). Incubation of nuclei with NM23-H1 or APE1 fragment endonucleases generates nicked chromatin DNA that is apparent from the more rapid migration of ethidium-stained DNA in the agarose gel and by the appearance of ∼200-bp DNA laddering indicative of nucleosomal fragmentation (Fig. 10, lanes 3 and 7). The TREX1WT degrades ∼50% of the fragmented chromatin DNA as evidenced by the loss of ethidium-stained DNA (Fig. 10, lanes 4 and 8). When the TREX1D18N/D18N and TREX1WT/D18N dominant mutants were mixed with TREX1WT and incubated with endonuclease-treated nuclei, the amount of chromatin DNA degradation is reduced, indicating inhibition of TREX1WT by the dominant TREX1 D18N-containing mutants during chromatin DNA degradation (Fig. 10, lanes 5 and 9). In contrast, when the TREX1WT was mixed with the TREX1D18N,R128A,R174A,K175A quadruple mutant, the TREX1WT degrades the chromatin DNA to a similar extent as that detected in reactions containing TREX1WT only (Fig. 10, lanes 6 and 10). These TREX1WT and variant chromatin DNA degradation activities using nuclei parallel the dsDNA degradation activities using nicked plasmids and further support the TREX1 exonuclease action to degrade the nicked polynucleotide strands of genomic DNA during cell death processes.
In conclusion, the biochemical activities of the TREX1 dominant alleles support a direct role for TREX1WT in the degradation of dsDNA to prevent autoimmune disease. The TREX1 D18N, D200N, and D200H homodimers are catalytically inactive with respect to ssDNA and dsDNA degradation of polynucleotides. However, this complete loss of TREX1 DNA degradation activity alone does not sufficiently explain the dominant genetics of the D18N, D200N, and D200H alleles because there are other TREX1 AGS alleles, such as the insertion mutations of aspartate at position 201 (D201ins) and alanine at position 124 (A124ins), that result in elimination of TREX1 DNA degradation activities but exhibit recessive genetics (14, 21). The dominant genetic phenotypes exhibited by the TREX1 D18N, D200N, and D200H alleles likely result from the generation of TREX1 enzymes with dysfunctional catalytic potential and fully functional nicked dsDNA binding properties. This mechanism of TREX1 dominant negative inhibition of dsDNA degradation might also extend to inhibition of dsDNA degradation by other exonucleases acting at nicked dsDNA sites, such as perhaps TREX2. Mutations of the TREX1 Arg-174, Lys-175, and Arg-128 residues reduce the dsDNA binding potential and, thus, the inhibitory effect of the D18N, D200N, and D200H alleles on TREX1WT dsDNA degradation activity. The TREX1 exonuclease activities during ssDNA and dsDNA degradation and the stable TREX1 dimeric structure lead to multiple mechanisms of dysfunction, helping to explain the spectrum of TREX1-related autoimmune disorders. The dominant effects exhibited by TREX1 Asp-18 and Asp-200 mutations provide insights into TREX1-mediated autoimmune disease in the heterozygous state.
Supplementary Material
Acknowledgments
We thank Scott Harvey for excellent technical assistance throughout this work, Heather Manring for generating some of the TREX1 mutant constructs, and Min Ae Lee-Kirsch for sharing unpublished data on AGS mutants.
This work was supported, in whole or in part, by National Institutes of Health Grant GM069962 (to F. W. P.). This work was also supported by Alliance for Lupus Research Grant 179222 (to F. W. P.), American Heart Association Grant 10GRNT3650033 (to T. H.), and postdoctoral fellowship award F32GM095290 (to S. R. C.).

The on-line version of this article (available at http://www.jbc.org) contains supplemental Figs. S1–S3.
- AGS
- Aicardi-Goutières syndrome
- FCL
- familial chilblain lupus
- MBP
- maltose-binding protein
- MUT
- mutant.
REFERENCES
- 1. Crow Y. J., Rehwinkel J. (2009) Hum. Mol. Genet. 18, R130–R136 [DOI] [PMC free article] [PubMed] [Google Scholar]
- 2. Höss M., Robins P., Naven T. J., Pappin D. J., Sgouros J., Lindahl T. (1999) EMBO J. 18, 3868–3875 [DOI] [PMC free article] [PubMed] [Google Scholar]
- 3. Mazur D. J., Perrino F. W. (1999) J. Biol. Chem. 274, 19655–19660 [DOI] [PubMed] [Google Scholar]
- 4. Mazur D. J., Perrino F. W. (2001) J. Biol. Chem. 276, 17022–17029 [DOI] [PubMed] [Google Scholar]
- 5. Chowdhury D., Beresford P. J., Zhu P., Zhang D., Sung J. S., Demple B., Perrino F. W., Lieberman J. (2006) Mol. Cell 23, 133–142 [DOI] [PubMed] [Google Scholar]
- 6. Stetson D. B., Ko J. S., Heidmann T., Medzhitov R. (2008) Cell 134, 587–598 [DOI] [PMC free article] [PubMed] [Google Scholar]
- 7. Yan N., Regalado-Magdos A. D., Stiggelbout B., Lee-Kirsch M. A., Lieberman J. (2010) Nat. Immunol. 11, 1005–1013 [DOI] [PMC free article] [PubMed] [Google Scholar]
- 8. Chowdhury D., Lieberman J. (2008) Annu. Rev. Immunol. 26, 389–420 [DOI] [PMC free article] [PubMed] [Google Scholar]
- 9. Yang Y. G., Lindahl T., Barnes D. E. (2007) Cell 131, 873–886 [DOI] [PubMed] [Google Scholar]
- 10. Mazur D. J., Perrino F. W. (2001) J. Biol. Chem. 276, 14718–14727 [DOI] [PubMed] [Google Scholar]
- 11. Crow Y. J., Hayward B. E., Parmar R., Robins P., Leitch A., Ali M., Black D. N., van Bokhoven H., Brunner H. G., Hamel B. C., Corry P. C., Cowan F. M., Frints S. G., Klepper J., Livingston J. H., Lynch S. A., Massey R. F., Meritet J. F., Michaud J. L., Ponsot G., Voit T., Lebon P., Bonthron D. T., Jackson A. P., Barnes D. E., Lindahl T. (2006) Nat. Genet. 38, 917–920 [DOI] [PubMed] [Google Scholar]
- 12. Lee-Kirsch M. A., Chowdhury D., Harvey S., Gong M., Senenko L., Engel K., Pfeiffer C., Hollis T., Gahr M., Perrino F. W., Lieberman J., Hubner N. (2007) J. Mol. Med. 85, 531–537 [DOI] [PubMed] [Google Scholar]
- 13. Lee-Kirsch M. A., Gong M., Schulz H., Rüschendorf F., Stein A., Pfeiffer C., Ballarini A., Gahr M., Hubner N., Linné M. (2006) Am. J. Hum. Genet. 79, 731–737 [DOI] [PMC free article] [PubMed] [Google Scholar]
- 14. Rice G., Newman W. G., Dean J., Patrick T., Parmar R., Flintoff K., Robins P., Harvey S., Hollis T., O'Hara A., Herrick A. L., Bowden A. P., Perrino F. W., Lindahl T., Barnes D. E., Crow Y. J. (2007) Am. J. Hum. Genet. 80, 811–815 [DOI] [PMC free article] [PubMed] [Google Scholar]
- 15. Lee-Kirsch M. A., Gong M., Chowdhury D., Senenko L., Engel K., Lee Y. A., de Silva U., Bailey S. L., Witte T., Vyse T. J., Kere J., Pfeiffer C., Harvey S., Wong A., Koskenmies S., Hummel O., Rohde K., Schmidt R. E., Dominiczak A. F., Gahr M., Hollis T., Perrino F. W., Lieberman J., Hübner N. (2007) Nat. Genet. 39, 1065–1067 [DOI] [PubMed] [Google Scholar]
- 16. Namjou B., Kothari P. H., Kelly J. A., Glenn S. B., Ojwang J. O., Adler A., Alarcón-Riquelme M. E., Gallant C. J., Boackle S. A., Criswell L. A., Kimberly R. P., Brown E., Edberg J., Stevens A. M., Jacob C. O., Tsao B. P., Gilkeson G. S., Kamen D. L., Merrill J. T., Petri M., Goldman R. R., Vila L. M., Anaya J. M., Niewold T. B., Martin J., Pons-Estel B. A., Sabio J. M., Callejas J. L., Vyse T. J., Bae S. C., Perrino F. W., Freedman B. I., Scofield R. H., Moser K. L., Gaffney P. M., James J. A., Langefeld C. D., Kaufman K. M., Harley J. B., Atkinson J. P. (2011) Genes Immun. 12, 270–279 [DOI] [PMC free article] [PubMed] [Google Scholar]
- 17. Richards A., van den Maagdenberg A. M., Jen J. C., Kavanagh D., Bertram P., Spitzer D., Liszewski M. K., Barilla-Labarca M. L., Terwindt G. M., Kasai Y., McLellan M., Grand M. G., Vanmolkot K. R., de, Vries B., Wan J., Kane M. J., Mamsa H., Schäfer R., Stam A. H., Haan J., de Jong P. T., Storimans C. W., van Schooneveld M. J., Oosterhuis J. A., Gschwendter A., Dichgans M., Kotschet K. E., Hodgkinson S., Hardy T. A., Delatycki M. B., Hajj-Ali R. A., Kothari P. H., Nelson S. F., Frants R. R., Baloh R. W., Ferrari M. D., Atkinson J. P. (2007) Nat. Genet. 39, 1068–1070 [DOI] [PubMed] [Google Scholar]
- 18. Kavanagh D., Spitzer D., Kothari P. H., Shaikh A., Liszewski M. K., Richards A., Atkinson J. P. (2008) Cell Cycle 7, 1718–1725 [DOI] [PMC free article] [PubMed] [Google Scholar]
- 19. Ramantani G., Kohlhase J., Hertzberg C., Innes A. M., Engel K., Hunger S., Borozdin W., Mah J. K., Ungerath K., Walkenhorst H., Richardt H. H., Buckard J., Bevot A., Siegel C., von Stülpnagel C., Ikonomidou C., Thomas K., Proud V., Niemann F., Wieczorek D., Häusler M., Niggemann P., Baltaci V., Conrad K., Lebon P., Lee-Kirsch M. A. (2010) Arthritis Rheum. 62, 1469–1477 [DOI] [PubMed] [Google Scholar]
- 20. Morita M., Stamp G., Robins P., Dulic A., Rosewell I., Hrivnak G., Daly G., Lindahl T., Barnes D. E. (2004) Mol. Cell. Biol. 24, 6719–6727 [DOI] [PMC free article] [PubMed] [Google Scholar]
- 21. de Silva U., Choudhury S., Bailey S. L., Harvey S., Perrino F. W., Hollis T. (2007) J. Biol. Chem. 282, 10537–10543 [DOI] [PubMed] [Google Scholar]
- 22. Rice G., Patrick T., Parmar R., Taylor C. F., Aeby A., Aicardi J., Artuch R., Montalto S. A., Bacino C. A., Barroso B., Baxter P., Benko W. S., Bergmann C., Bertini E., Biancheri R., Blair E. M., Blau N., Bonthron D. T., Briggs T., Brueton L. A, Brunner. H. G., Burke C. J., Carr I. M., Carvalho D. R., Chandler K. E., Christen H. J., Corry P. C., Cowan F. M., Cox H., D'Arrigo S., Dean J., De Laet C., De Praeter C., Dery C., Ferrie C. D., Flintoff K., Frints S. G., Garcia-Cazorla A., Gener B., Goizet C., Goutieres F., Green A. J., Guet A., Hamel B. C., Hayward B. E., Heiberg A., Hennekam R. C., Husson M., Jackson A. P., Jayatunga R., Jiang Y. H., Kant S. G., Kao A., King M. D., Kingston H. M., Klepper J., van der Knaap M. S., Kornberg A. J., Kotzot D., Kratzer W., Lacombe D., Lagae L., Landrieu P. G., Lanzi G., Leitch A., Lim M. J., Livingston J. H., Lourenco C. M., Lyall E. G., Lynch S. A., Lyons M. J., Marom D., McClure J. P., McWilliam R., Melancon S. B., Mewasingh L. D., Moutard M. L., Nischal K. K., Ostergaard J. R., Prendiville J., Rasmussen M., Rogers R. C., Roland D., Rosser E. M., Rostasy K., Roubertie A., Sanchis A., Schiffmann R., Scholl-Burgi S., Seal S., Shalev S. A., Corcoles C. S., Sinha G. P., Soler D., Spiegel R., Stephenson J. B., Tacke U., Tan T. Y., Till M., Tolmie J. L., Tomlin P., Vagnarelli F., Valente E. M., Van Coster R. N., Van der Aa N., Vanderver A., Vles J. S., Voit T., Wassmer E., Weschke B., Whiteford M. L., Willemsen M. A., Zankl A., Zuberi S. M., Orcesi S., Fazzi E., Lebon P., Crow Y. J. (2007) Am. J. Hum. Genet. 81, 713–725 [DOI] [PMC free article] [PubMed] [Google Scholar]
- 23. Lehtinen D. A., Harvey S., Mulcahy M. J., Hollis T., Perrino F. W. (2008) J. Biol. Chem. 283, 31649–31656 [DOI] [PMC free article] [PubMed] [Google Scholar]
- 24. Haaxma C. A., Crow Y. J., van Steensel M. A., Lammens M. M., Rice G. I., Verbeek M. M., Willemsen M. A. (2010) Am. J. Med. Genet. A. 152A, 2612–2617 [DOI] [PubMed] [Google Scholar]
- 25. Liu X., Zou H., Slaughter C., Wang X. (1997) Cell 89, 175–184 [DOI] [PubMed] [Google Scholar]
- 26. Fan Z., Beresford P. J., Oh D. Y., Zhang D., Lieberman J. (2003) Cell 112, 659–672 [DOI] [PubMed] [Google Scholar]
- 27. Yoshida A., Urasaki Y., Waltham M., Bergman A. C., Pourquier P., Rothwell D. G., Inuzuka M., Weinstein J. N., Ueda T., Appella E., Hickson I. D., Pommier Y. (2003) J. Biol. Chem. 278, 37768–37776 [DOI] [PubMed] [Google Scholar]
- 28. Perrino F. W., de Silva U., Harvey S., Pryor E. E., Jr., Cole D. W., Hollis T. (2008) J. Biol. Chem. 283, 21441–21452 [DOI] [PMC free article] [PubMed] [Google Scholar]
- 29. Perrino F. W., Harvey S., McMillin S., Hollis T. (2005) J. Biol. Chem. 280, 15212–15218 [DOI] [PubMed] [Google Scholar]
Associated Data
This section collects any data citations, data availability statements, or supplementary materials included in this article.


