Background: Mechanisms that down-regulate expression of renal D1 dopamine receptors in diabetes are not well understood.
Results: Inhibiting ectonucleotidases and tissue-nonspecific alkaline phosphatase prevents D1 receptor down-regulation.
Conclusion: The extracellular cAMP-adenosine (ECA) pathway is involved in the down-regulation of renal D1 receptors.
Significance: Inhibitors of the ECA pathway provide a novel approach to reverse the down-regulation of D1 receptor expression in diabetic animals.
Keywords: Adenosine, Cyclic AMP (cAMP), Diabetes, Dopamine Receptors, Gene Expression, Hypertension, Kidney
Abstract
Activation of D1 dopamine receptors expressed in the kidneys promotes the excretion of sodium and regulates sodium levels during increases in dietary sodium intake. A decrease in the expression or function of D1 receptors results in increased sodium retention which can potentially lead to the development of hypertension. Studies have shown that in the absence of functional D1 receptors, in null mice, the systolic, diastolic, and mean arterial pressures are higher. Previous studies have shown that the expression and function of D1 receptors in the kidneys are decreased in animal models of diabetes. The mechanisms that down-regulate the expression of renal D1 receptor gene in diabetes are not well understood. Using primary renal cells and acutely isolated kidneys from the streptozotocin-induced rat diabetic model, we demonstrate that the renal D1 receptor expression is down-regulated by the extracellular cAMP-adenosine pathway in vitro and in vivo. In cultures of primary renal cells, a 3 mm, 60-h cAMP treatment down-regulated the expression of D1 receptors. In vivo, we determined that the plasma and urine cAMP levels as well as the expression of 5′-ectonucleotidase, tissue-nonspecific alkaline phosphatase, and adenosine A2a receptors are significantly increased in diabetic rats. Inhibitors of 5′-ectonucleotidase and tissue-nonspecific alkaline phosphatase, α,β-methyleneadenosine 5′-diphosphate, and levamisole, respectively, blocked the down-regulation of D1 receptors in the primary renal cells and in the kidney of diabetic animals. The results suggest that inhibitors of the extracellular cAMP-adenosine pathway reverse the down-regulation of renal D1 receptor in diabetes.
Introduction
In the periphery, the neurotransmitter dopamine modulates blood pressure and blood flow and regulates sodium and water excretion (1). In the kidney, dopamine is produced locally in the tubular cells (2). Dopamine receptors are divided into two broad categories on the basis of their structural and functional properties: the D1-like receptors (D1R and D5R) and the D2-like receptors (D2R, D3R, and D4R) (3). The molecular mechanisms that regulate dopamine receptor expression in pathophysiological conditions are not well understood. The D1-like receptors link to stimulatory Gs/Golf proteins and activate adenylyl cyclase to increase intracellular cAMP. In contrast, the D2-like receptors are coupled to inhibitory Gi/Go proteins and decrease cAMP levels (3). The activation of renal D1 dopamine receptors by locally produced dopamine inhibits sodium-potassium-ATPase and sodium-hydrogen exchanger promoting renal sodium excretion (4). Thus, pathological conditions that decrease expression or function of D1 receptors in the kidney will increase sodium retention, potentially leading to the development of hypertension. Indeed, mice lacking functional D1 receptors develop hypertension (5). Several studies have also shown a defect in D1 receptor function in hypertension (2).
Previous studies have shown that in both type I and type II diabetes, renal D1 receptor gene expression is reduced >50%, resulting in increased sodium retention (6, 7). The mechanisms that down-regulate renal D1 receptor gene expression in diabetes are not well understood. We have previously shown that expression of D1 receptors in the Cath A-derived catecholaminergic mouse neuronal cell line is down-regulated by the extracellular cAMP-adenosine (ECA)2 signaling pathway (8). Because the ECA signaling pathway proteins are highly expressed in the kidney (9) and their expression levels are altered in diabetes, we developed a hypothesis that the down-regulation of renal D1 dopamine receptor expression in diabetes is mediated by the ECA signaling pathway.
Secretion of cAMP by mammalian cells in response to stimuli that increase intracellular cAMP was described originally in 1963 by Davoren and Sutherland (10). Secretion of cAMP has since been reported in numerous cells and tissues (9). Efflux of cAMP has also been reported in vivo in the brain of awake behaving rats (11), liver (12), and kidney (13, 14). The physiological effects of extracellular cAMP in mammals, in the kidney and other tissues, are primarily mediated by its conversion first to AMP by ectophosphodiesterases and then to adenosine via 5′-ectonucleotidases (5′-Ecto-NT) and/or tissue-nonspecific alkaline phosphatase (TNAP) (9). Adenosine is also generated from extracellular ATP by a family of ectonucleotidases (15, 16). Adenosine activates G protein-coupled adenosine receptors that stimulate or inhibit, among other effectors, adenylyl cyclase. These proteins together with the ectophosphodiesterases, 5′-Ecto-NT, and TNAP make up the ECA signaling pathway (9, 15).
The pancreato-hepato-renal axis primarily provides the extracellular cAMP that activates the renal ECA signaling pathway. Glucagon secreted from the pancreas stimulates adenylyl cyclase in the liver to form cAMP which is released into the hepatic vein (17). The kidney filters cAMP into the tubular lumen where it is concentrated in the proximal tubule due to the reabsorption of water. The proximal tubule expresses all components of the ECA signaling pathway necessary to form adenosine from the liver-generated cAMP (18). In animals and people with obesity, insulin resistance, and hyperlipidemia, oral glucose administration instead of inhibiting, stimulates pancreatic glucagon secretion (19, 20). The excessive glucagon secreted from the pancreas, under these pathological conditions, increases the cAMP synthesized and secreted from the liver (17). The chronically elevated extracellular cAMP results in stimulation of abnormally high adenosine production in the renal tubules which contributes to development of hypertension (18). Indeed, in the streptozotocin (STZ)-treated diabetic rats, the extracellular concentration of adenosine is elevated (21), and levels of the adenosine-metabolizing enzyme, adenosine kinase, are reduced by 50% (22). The plasma and urine levels of cAMP in STZ-treated rats have not been reported previously.
To test the hypothesis that the down-regulation of renal D1 dopamine receptor expression in diabetes is mediated by the ECA signaling pathway, we determined the expression of D1 receptors and various components of the ECA pathway both in cAMP-treated primary renal cell culture and in the kidney of STZ-induced diabetic rats. Our results suggest that whereas the renal D1 receptor expression is down-regulated, the expression of key proteins in the ECA pathway is up-regulated both in vitro and in vivo. Furthermore, inhibitors of Ecto-5′-NT and TNAP blocked the down-regulation of renal D1 receptors both in vitro and in vivo. The results support our hypothesis that the ECA signaling pathway regulates the expression of the renal D1 dopamine receptor.
EXPERIMENTAL PROCEDURES
Animals
The protocol for the use of animals was approved by the Institutional Animal Care and Use Committee at UMDNJ-New Jersey Medical School. Male Sprague-Dawley rats (8–10 weeks old) weighing 250–300 g were purchased from Harlan. The rats were housed in the animal care facility and provided ad libitum access to water and standard chow. For the diabetes studies, the animals were administered a single intraperitoneal injection of either the vehicle, 5 mm sodium citrate (pH 4.5), or 60 mg/kg streptozotocin (Sigma). STZ was dissolved in 5 mm sodium citrate (pH 4.5) at a concentration of 50 mg/ml. The intraperitoneal injection volume was 1.2 ml/kg. Body weight and blood glucose levels were measured prior to STZ injection and subsequently on days 1, 4, 7, and 13. Blood glucose levels were measured via tail tip sampling using the Accu-Chek® Active glucose test meter (Roche Applied Science). Food and water consumption as well as urine output were measured on day 14 using metabolic cages. In experiments where we tested the effect of inhibitors of the ECA pathway, we administered vehicle (PBS), AMP-CP (2.5 mg/kg, intramuscularly), or levamisole (3 mg/kg, intraperitoneally) twice a day (12 h apart) for 3 days beginning on day 11. The doses of inhibitors were selected based on previous in vivo studies (23, 24). AMP-CP and levamisole (Sigma) were dissolved in PBS. Animals were euthanized on day 14 and plasma and kidneys harvested for analysis. One kidney from each animal was used for RNA analysis and the other for protein analysis. From each kidney the cortex and medulla were separately dissected for subsequent analysis.
Renal Cell Isolation and Culture
Primary renal cell culture was established from freshly harvested kidneys obtained from untreated 8-week-old male Sprague-Dawley rats, exactly as described previously (25). The isolation method enriches proximal convoluted tubule cells which express D1 receptors and ECA pathway proteins (25, 27). Briefly, kidneys were harvested and placed in ice-cold oxygenated L-15 medium (Sigma). The cortex was dissected, minced in to small pieces, and then incubated at 37 °C in 0.2% collagenase V (Worthington) with shaking. Following digestion, the cells were mixed with ice-cold 45% Percoll and centrifuged at 10,000 × g for 15 min at 4 °C. The top bands were washed in ice-cold L-15 medium and resuspended in 40% ice-cold Percoll solution and centrifuged as before. The cells were washed first in L-15 medium, followed by PBS and subjected to a collagenase type IV (1 mg/ml) digestion at 4 °C for 15 min. The digestion was terminated with DMEM-F12 and 10% FCS, pelleted, and the cells were plated in 100-mm dishes in DMEM-F12 with 10% FCS. Medium was replaced every 2 days. Four days later, cells were trypsinized and replated. After reaching ∼60% confluence, cells were treated with 3 mm 3′,5′-cAMP sodium salt (Sigma) for 60 h before being harvested. In some experiments cells were co-treated with 0.3 mm AMP-CP or 1.0 mm levamisole (Sigma).
RNA Isolation and RT-PCR
RNA isolation was performed using the TRIzol® reagent (Invitrogen) according to the manufacturer's instructions. DNA-freeTM (Ambion) was used to remove DNA contamination from the total RNA sample (50 μg of total RNA, 1× DNase I buffer, 0.08 unit DNase I). The quality and integrity of the DNase-treated RNA were confirmed by running 2 μg of total RNA on a 1.2% Tris-borate-EDTA (TBE)-agarose gel. To set up the reverse transcriptase (RT) reaction, 5 μg of DNase-treated total RNA and 300 ng of random hexamers (Invitrogen) were combined. The mixture was denatured by heating at 65 °C for 5 min and quick chilling in ice slurry. After the addition of 1× first strand Superscript III RT buffer (Invitrogen), the denatured samples were annealed at room temperature for 10 min. To initiate cDNA synthesis, 0.5 mm deoxynucleotide triphosphates, 10 mm DTT, 1 unit of SUPERase In (Ambion), and 10 units of Superscript III RT (Invitrogen) were added and the reaction incubated at 45 °C for 1 h. The reaction was stopped by heat inactivation at 70 °C for 15 min. Quantitative real-time PCR was performed using the Light Cycler® (Roche Applied Science) and TaqMan® Gene Expression Assays (Applied Biosystems). The TaqMan® probes used were: D1 dopamine receptor (Rn03062203_s1), β-actin (Rn00667869_m1), 5′-Ecto-NT (Rn00571989_m1), TNAP (Rn00564931_m1), and A2a adenosine receptor (Rn00583935_m1). Two negative and one positive control were incorporated in each RT-PCR run. The negative control included a PCR in which the template was substituted for water. For a second negative control, PCR was run with products from a RT reaction in which the Superscript III RT enzyme was omitted. Rat brain cDNA was used as a positive control. Two independent RT reactions and three PCRs were performed for each sample. -Fold differences were determined using crossing point analysis as described previously (26).
Protein Isolation and Western Blotting
Tissue was homogenized and solubilized using the CellyticTM-MT reagent (Sigma) supplemented with 1 mm phenylmethylsulfonylfluoride (PMSF) and 1% protease inhibitor mixture (Pierce). Protein amounts in the lysates were determined using the BCA assay (Pierce), and equal amounts of total cell proteins (100 to 200 μg) were electrophoresed on SDS-polyacrylamide gels and transferred onto nitrocellulose. The D1 receptor protein was detected using the D1 dopamine receptor rat monoclonal antibody (1:1000 dilution; Sigma) as described previously (8). The 5′-Ecto-NT and TNAP proteins were detected using anti rat CD73 monoclonal antibody (1:1000 dilution; BD Biosciences) and anti-human ALPL polyclonal antibody (1:500 dilution; Abnova), respectively. Signals were detected using films and/or gel imager by employing chemiluminescent methods (Pierce), using HRP-conjugated light chain-specific secondary antibodies (1:10,000 or 1:20,000; Jackson ImmunoResearch). The signals were detected using the SuperSignal® WestDura substrate chemiluminescence detection kit (Pierce). After chemiluminescent detection, the nitrocellulose blots were stained with Amido Black total protein stain to determine whether equal amount of proteins were loaded in all lanes. All experiments were repeated three to five independent times. To quantitate the intensity of bands in the Western blots, photographic films were subjected to densitometric analysis using the FluorChem gel documentation system (Alpha Innotech, San Leandro, CA). For each blot, multiple film exposures were obtained and scanned to determine the linear range of exposure.
cAMP Measurements
cAMP levels in plasma and urine were assessed using the cAMP Biotrak Enzymeimmunoassay System (GE Healthcare). Plasma and urine samples were diluted 1:100 and 1:1000, respectively, in assay buffer provided in the kit before adding to the 96-well assay plate. The cAMP levels were measured by following the recommendations of the kit manufacturer and as described previously (26). The number of moles of cAMP was calculated by comparing with a curve derived from the standards provided with each kit. The molar values were obtained by normalizing to the volume of each plasma sample. In the case of the urine sample, the levels were normalized to volume and time as the urine samples were collected over a 6-h period in metabolic cages. The cAMP levels in each treated sample were assayed in triplicate.
Statistics
Analysis of variance (ANOVA) and the Student-Newman-Keuls (SNK) multiple pairwise comparison tests and Student's t test were performed with the SigmaPlot® 11 software (SPSS Inc.). Data were considered statistically significant when the probability value (p) was <0.05.
RESULTS
ECA Pathway Regulates D1 Receptor Expression in Primary Renal Cell Culture
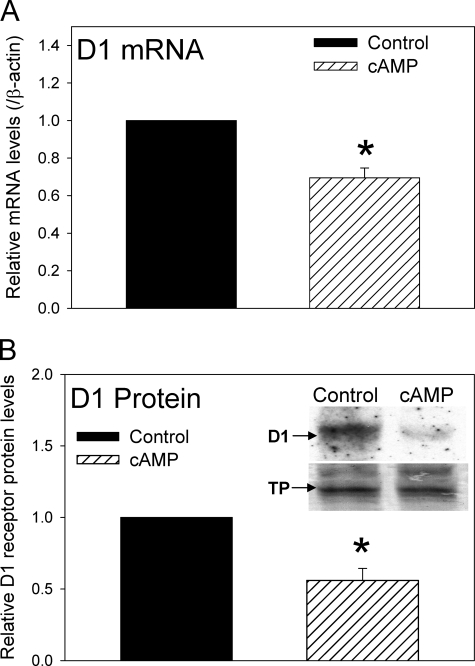
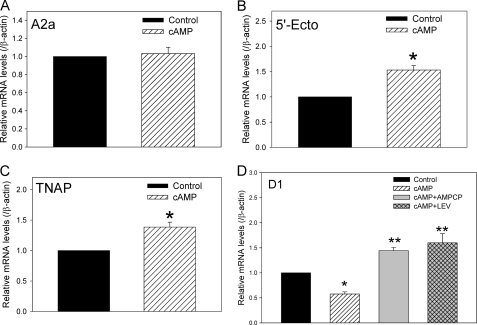
Expression of D1 dopamine receptors and proteins of the ECA pathway has been previously demonstrated in primary renal cell cultures (25, 27). Although we have previously shown that the D1 receptor is regulated by the ECA pathway in the Cath A-derived catecholaminergic cell line (8), it is not known whether D1 receptor expression in cultured renal cells is modulated by the ECA pathway. Primary renal cells isolated from 8-week-old untreated rats were cultured as described under “Experimental Procedures.” The cells were treated with vehicle (PBS) or 3 mm 3′,5′-cAMP sodium salt for 60 h. Fig. 1 shows that both D1 dopamine receptor mRNA (Fig. 1A) and protein (Fig. 1B) were significantly reduced by the extracellular cAMP treatment in the primary renal cell cultures. The key proteins involved in the ECA pathway include 5′-Ecto-NT, TNAP, and A2a adenosine receptors. The 60-h cAMP treatment significantly increased the expression of 5′-Ecto-NT and TNAP mRNA, but not the A2a adenosine receptor mRNA (Fig. 2, A–C). Treatment of cells for 24 and 36 h did not significantly decrease D1 receptor expression levels; however, the levels of 5′-Ecto-NT, TNAP, and A2a adenosine receptors were also not altered at the shorter time points. This also suggests that up-regulation of 5′-Ecto-NT and TNAP expression might be required to down-regulate D1 receptor expression. To determine whether the ECA pathway was mediating the cAMP-induced down-regulation of D1 receptors in the primary renal cells, the cultured cells were treated with 3 mm 3′,5′-cAMP sodium salt in the absence or presence of 0.3 mm AMP-CP or 1.0 mm levamisole, inhibitors of 5′-Ecto-NT and TNAP, respectively. Results in Fig. 2D shows that both AMP-CP and levamisole significantly inhibited the cAMP-induced down-regulation of D1 receptor mRNA. Together, these results suggest that the ECA pathway regulates D1 receptor expression in primary renal cells.
FIGURE 1.
Effect of extracellular cAMP on the expression of D1 dopamine receptor gene in primary renal cells. A, cumulative data from real-time RT-PCR showing relative expression of D1 receptor mRNA in control cells (black bar) and cells treated with 3 mm 3′,5′-cAMP sodium salt (hatched bar) for 60 h. The D1 receptor mRNA levels were normalized to β-actin and then normalized to levels in control cells. *, p < 0.05, Student's t test. The results are from three independent experiments performed on primary renal cell cultures obtained from three animals. B, cumulative data and representative Western blots (inset) indicating the levels of D1 receptor protein in control cells and cells treated with 3 mm cAMP for 60 h. In the inset, the bottom panel shows the same blot as in top panel stained with Amido Black. The D1 receptor protein levels were normalized to Amido Black-stained total proteins (TP) and then normalized to levels in control cells. *, p < 0.05, Student's t test. Three independent experiments were performed. Error bars, S.E.
FIGURE 2.
Effect of extracellular cAMP on the expression of ECA pathway genes in primary renal cells. A–C, cumulative data from real-time RT-PCR showing relative mRNA expression of adenosine A2a receptor (A), 5′-Ecto-NT (B), and TNAP (C) in control cells (black bar) and cells treated with 3 mm 3′,5′-cAMP sodium salt (hatched bar) for 60 h. The mRNA levels were normalized to β-actin and then normalized to levels in control cells. *, p < 0.05, Student's t test. Error bars, S.E. The results are from independent experiments performed on primary renal cell cultures obtained from three animals. D, cumulative data from real-time RT-PCR showing relative mRNA expression of D1 dopamine in control cells (black bar), cells treated with 3 mm 3′,5′-cAMP sodium salt (hatched bar), 3 mm cAMP + 0.3 mm AMP-CP (gray bar), or 3 mm cAMP + 1.0 mm levamisole (LEV, cross-hatched bar) for 60 h. The mRNA levels were normalized to β-actin and then normalized to levels in control cells. *, **, p < 0.05, ANOVA, post hoc SNK test. The results are from four independent experiments performed on primary renal cell cultures obtained from four animals.
Plasma and Urine cAMP Levels Are Significantly Elevated in STZ-induced Diabetic Rats
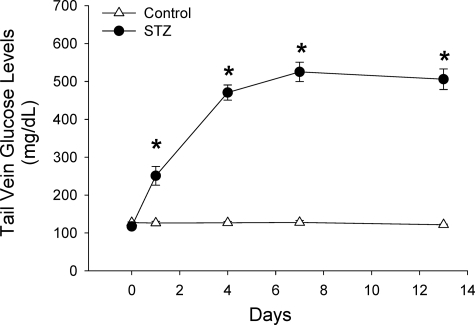
The pancreato-hepato-renal axis primarily provides the extracellular cAMP that activates the renal ECA signaling pathway. Glucagon secreted from the pancreas stimulates adenylyl cyclase in the liver to form cAMP which is released into the hepatic vein (17). In animals and people with obesity, insulin resistance, and hyperlipidemia, oral glucose administration stimulates instead of inhibits pancreatic glucagon secretion (19, 20). The excessive glucagon secreted from the pancreas, under these pathological conditions, increases the cAMP synthesized and secreted from the liver (17). The levels of plasma and urine cAMP have not been previously measured in animal models of diabetes. To determine the levels of plasma and urine cAMP in a type I model of diabetes, rats were administered a single dose of STZ as described under “Experimental Procedures.” Results in Fig. 3 show that the STZ-treated rats exhibited significantly higher levels of blood glucose levels over a 2-week period. On day 14, urine and plasma samples were collected from control and STZ-treated rats and levels of cAMP measured. The cAMP levels in the plasma and urine were significantly elevated in the STZ-treated rats (Fig. 4). The results suggest that in diabetic rats, the substrate for the ECA pathway, cAMP, is significantly higher and could contribute to the down-regulation of renal D1 dopamine receptors.
FIGURE 3.
STZ-treated rats sustain elevated blood glucose levels over a 14-day period. Blood glucose levels in control (vehicle; open triangles) and STZ-injected animals (filled circles) were measured on day of injection and subsequently on days 1, 4, 7, and 13. n = 9 animals for each treatment group. *, p < 0.05, Student's t test between control and STZ-treated animals on each day. Error bars, S.E.
FIGURE 4.
Elevated cAMP levels in the plasma and urine of STZ-treated diabetic rats. Levels of cAMP in plasma (A) and urine (B) from control (vehicle, black bars) and STZ-injected rats (hatched bars) were measured on day 14 after treatment. Levels of cAMP are indicated in nanomolar for plasma and in nanomoles per hour for urine, as the urine sample was collected over a 6-h period. n = 9 animals for each treatment group. *, p < 0.05, Student's t test. Error bars, S.E.
Renal D1 Receptor Expression Is Down-regulated in STZ-induced Diabetic Rats
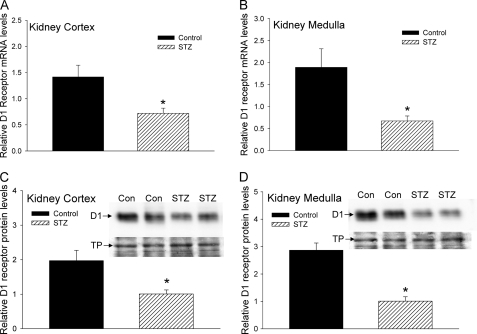
Previous studies have shown that the expression of renal D1 dopamine receptor protein is significantly decreased in rat models of diabetes (5, 6). However, it is not known whether D1 receptor mRNA levels in the kidney are also down-regulated in diabetic rats. Furthermore, it is not known whether there are regional differences in the down-regulation of the renal D1 receptor in the cortex and medulla of STZ-treated diabetic rats. To determine the expression of renal D1 receptor mRNA and protein in the STZ-treated rats, we used real-time RT-PCR and Western blotting, respectively, and measured the mRNA and protein levels in kidney cortex and medulla. The results in Fig. 5 show that the expression of renal D1 receptor mRNA (Fig. 5, A and B) and protein (Fig. 5, C and D) was significantly reduced in both the cortex (Fig. 5, A and C) and medulla (Fig. 5, B and D) in STZ-treated diabetic rats.
FIGURE 5.
Effect of STZ treatment on expression of D1 receptor gene in kidney cortex and medulla. A and B, cumulative data from real-time RT-PCR show relative expression of D1 receptor mRNA in kidney cortex (A) and medulla (B) of control (black bars) and STZ-treated rats (hatched bars) 14 days after injection. The D1 receptor mRNA levels were normalized to β-actin. C and D, cumulative data from Western blots show relative expression of D1 receptor protein in kidney cortex (C) and medulla (D) from control (black bars) and STZ-treated rats (hatched bars) 14 days after injection. Insets show representative Western blots (top panels, D1 receptor protein) and Amido Black stain of the same blot (bottom panels, TP). n = 8 animals for each treatment group. *, p < 0.05, Student's t test. Error bars, S.E.
Expression of ECA Pathway Proteins Are Altered in the Kidney of STZ-induced Diabetic Rats
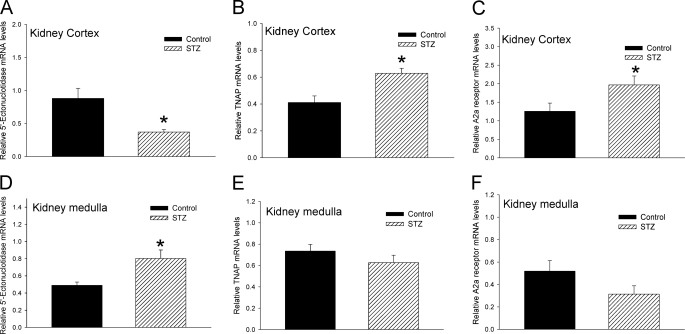
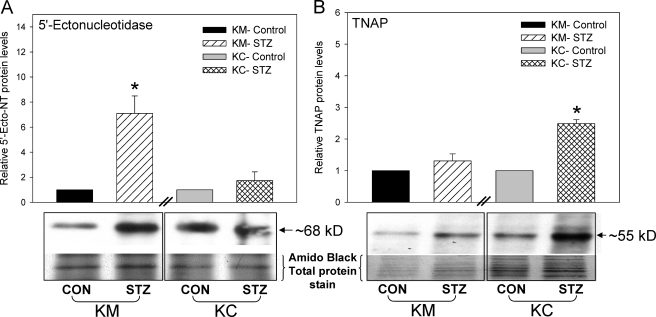
The expression of key proteins of the ECA pathway such as 5′-Ecto-NT, TNAP, and adenosine A2a receptor in kidney has been previously reported (21, 25). We determined whether the expression of these genes was altered in the STZ-treated diabetic rats and whether there were regional differences between the cortex and medulla. Using real-time RT-PCR, we showed that in the kidney cortex the expression of 5′-Ecto-NT mRNA was significantly reduced whereas the expression of TNAP and adenosine A2a receptor mRNA was significantly increased (Fig. 6, A–C) in the STZ-treated diabetic rats. In contrast, in the kidney medulla, the expression of 5′-Ecto-NT mRNA was significantly increased whereas the expression of TNAP and adenosine A2a receptor mRNA was not changed (Fig. 6, D–F). The differential effect of STZ treatment on the expression of 5′-Ecto-NT mRNA in the cortex and medulla was also observed at the protein level (Fig. 7A); there was a significant increase in 5′-Ecto-NT protein in the medulla but not the cortex. The effect of STZ treatment on TNAP protein levels was consistent with the changes in the TNAP mRNA levels. The increase in TNAP mRNA in the cortex was also observed at the protein level (Fig. 7B). As observed with TNAP mRNA, TNAP protein levels in the medulla were not significantly different. The results suggest that in the STZ-treated diabetic rat kidneys the expression levels of proteins involved in the ECA pathway are significantly increased, albeit with regional differences. These results coupled with the elevated plasma and urine cAMP levels (Fig. 4) strongly suggest that the activity of the ECA pathway is enhanced in the diabetic rats.
FIGURE 6.
Effect of STZ treatment on expression of ECA pathway genes in kidney cortex and medulla. Cumulative data from real-time RT-PCR show relative expression of 5′-Ecto-NT (A and D), TNAP (B and E), and adenosine A2a receptor (C and F) in kidney cortex (A–C) and medulla (D–F) of control (black bars) and STZ-treated rats (hatched bars) 14 days after injection. The mRNA levels were normalized to β-actin. n = 8 animals for each treatment group. *, p < 0.05, Student's t test. Error bars, S.E.
FIGURE 7.
Effect of STZ treatment on expression of 5′-Ecto-NT and TNAP proteins in kidney cortex and medulla. Cumulative data and representative Western blots show 5′-ectonucleotidase (A) and TNAP (B) proteins in kidney cortex (KC) and medulla (KM) in control (CON) and STZ-injected rats 14 days after the treatment. Top panel, Western blots of 5′-Ecto-NT and TNAP. Bottom panels, Amido Black stains of the same blot. For each kidney region, the protein levels were normalized to Amido Black-stained total proteins and then normalized to levels in control cells. n = 5 animals for each treatment group. *, p < 0.05, Student's t test. Error bars, S.E.
Inhibition of ECA Pathway Proteins Blocks the Down-regulation of Renal D1 Receptor in STZ-induced Diabetic Rats
The AMP derived from extracellular cAMP is further metabolized to adenosine by 5′-Ecto-NT and/or TNAP (16, 28), both of which are expressed in the kidneys. Previous studies have shown that AMP-CP and levamisole are inhibitors of 5′-Ecto-NT and TNAP, respectively, preventing the metabolism of AMP to adenosine (28–31). Furthermore, AMP-CP is an inhibitor of 5′-Ecto-NT but not cytosolic 5′-nucleotidase (32). Interestingly, TNAP is not inhibited by AMP-CP (33), which facilitates the discrimination of the relative roles of 5′-Ecto-NT and TNAP using AMP-CP and levamisole.
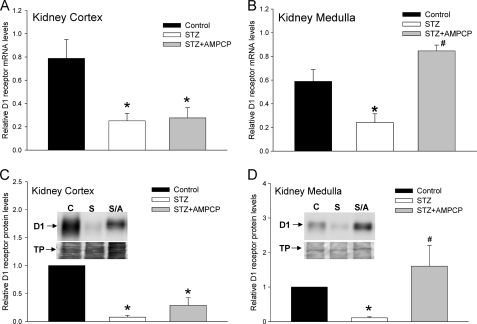
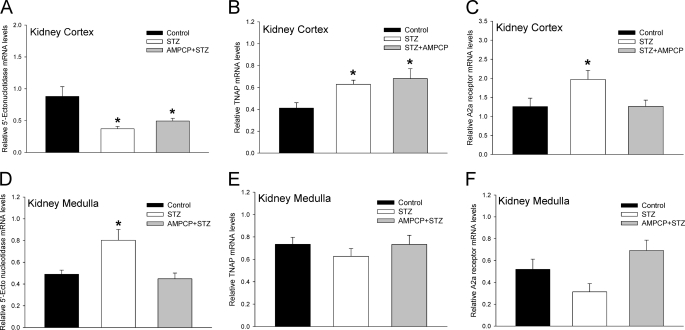
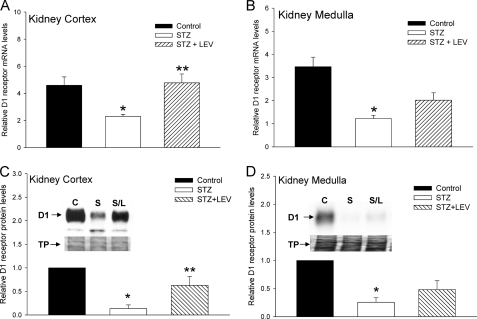
To determine whether the ECA pathway was modulating the expression of D1 receptors in the STZ-treated diabetic rats, we administered either AMP-CP (Figs. 8 & 9) or levamisole (Fig. 10) for 3 consecutive days, twice a day prior to harvesting the kidney tissue. Administration of AMP-CP and levamisole did not affect the blood glucose level in control or STZ-treated rats. Fig. 8 shows that administration of AMP-CP, in vivo, significantly reversed the down-regulation of D1 receptor mRNA observed in the STZ-treated diabetic rats; however, significant reversal was observed only in the kidney medulla (Fig. 8B) but not in the kidney cortex (Fig. 8A). The changes in D1 receptor mRNA levels correlated with D1 protein levels (Fig. 8, C and D). We next determined the effect of AMP-CP treatment on the expression of ECA pathway proteins in the STZ-treated diabetic rats. In the kidney cortex, AMP-CP treatment had no effect on the STZ-induced decrease in 5′-Ecto-NT mRNA (Fig. 9A) and increase in TNAP mRNA (Fig. 9B); however, AMP-CP treatment significantly reduced the STZ-induced increase in adenosine A2a receptor mRNA (Fig. 9C). In the kidney medulla, consistent with the results in Fig. 6, STZ treatment significantly increased the expression of only 5′-Ecto-NT mRNA, and this increase was prevented by the AMP-CP treatment (Fig. 9, D–F). The effect of in vivo levamisole treatment on the STZ-induced decrease in D1 receptor mRNA is shown in Fig. 10. Unlike the AMP-CP treatment, the levamisole treatment significantly reversed the STZ-induced down-regulation of D1 receptor mRNA and protein in the kidney cortex (Fig. 10, A and C). In the kidney medulla, the effect of levamisole on the STZ-induced down-regulation of D1 receptor was not significant at the mRNA and protein level (Fig. 10, B and D).
FIGURE 8.
Effect of AMP-CP on STZ-induced down-regulation of D1 receptor gene expression in kidney cortex and medulla. A and B, cumulative data from real-time RT-PCR show relative expression of D1 receptor mRNA in kidney cortex (A) and medulla (B) of control (black bars), STZ-treated (white bars), and STZ + AMP-CP-treated (gray bars) rats. AMP-CP (2.5 mg/kg, intramuscularly) was administered for 3 days, twice a day starting at day 11. Kidneys were harvested on day 14. The D1 receptor mRNA levels were normalized to β-actin. *, significantly different from control; #, significantly different from STZ-treated. *, p < 0.05, ANOVA, post hoc SNK test. n = 6 animals for each treatment group. C and D, cumulative data and representative Western blots (insets) indicate the levels of D1 receptor protein in kidney cortex (C) and medulla (D) from control, STZ-treated, and STZ + AMP-CP-treated rats. Bottom panels in the insets show Amido Black stain of the same blot. The D1 receptor protein levels were normalized to Amido Black-stained total proteins (TP) and then normalized to levels in control cells. *, significantly different from control; #, significantly different from STZ-treated. *, #, p < 0.05, ANOVA, post hoc SNK test. n = 5 animals for each treatment group. Error bars, S.E.
FIGURE 9.
Effect of AMP-CP on STZ-induced changes in ECA pathway gene expression in kidney cortex and medulla. Cumulative data from real-time RT-PCR show relative expression 5′-Ecto-NT (A and D), TNAP (B and E), and adenosine A2a receptor (C and F) in kidney cortex (A–C) and medulla (D–F) of control (black bars), STZ-treated (white bars), and STZ + AMP-CP-treated (gray bars) rats. AMP-CP (2.5 mg/kg, intramuscularly) was administered for 3 days, twice a day starting at day 11. Kidneys were harvested on day 14. All mRNA levels were normalized to β-actin. *, p < 0.05, ANOVA, post hoc SNK test. n = 6 animals for each treatment group. Error bars, S.E.
FIGURE 10.
Effect of levamisole on STZ-induced down-regulation of D1 receptor gene expression in kidney cortex and medulla. A and B, cumulative data from real-time RT-PCR show relative expression of D1 receptor mRNA in kidney cortex (A) and medulla (B) of control (black bars), STZ-treated (white bars), and STZ + levamisole (LEV)-treated (hatched bars) rats. Levamisole (3 mg/kg, intraperitoneally) was administered for 3 days, twice a day starting at day 11. Kidneys were harvested on day 14. The D1 receptor mRNA levels were normalized to β-actin. *, significantly different from control; **, significantly different from STZ-treated. *, **, p < 0.05, ANOVA, post hoc SNK test. n = 6 animals for each treatment group. C and D, cumulative data and representative Western blots (insets) indicate the levels of D1 receptor protein in kidney cortex (C) and medulla (D) from control, STZ-treated, and STZ + levamisole-treated rats. Bottom panels in the insets shows Amido Black stains of the same blot. The D1 receptor protein levels were normalized to Amido Black-stained total proteins (TP) and then normalized to levels in control cells. *, significantly different from control; **, significantly different from STZ-treated. *, **, p < 0.05, ANOVA, post hoc SNK test. n = 6 animals for each treatment group. Error bars, S.E.
Taken together, these results suggest that in the kidney medulla, the STZ-induced decrease in D1 receptor expression is mediated by the up-regulation of 5′-Ecto-NT expression and activity. AMP-CP treatment did not have a significant effect on STZ-induced D1 receptor down-regulation in the kidney cortex. In contrast, in the kidney cortex, the results suggest that the STZ-induced down-regulation of D1 receptor expression is mediated by TNAP.
DISCUSSION
The results support our hypothesis that the ECA pathway down-regulates the expression of D1 dopamine receptor in STZ-induced diabetic rats. The ECA pathway has been described in several organ systems, including, the brain, kidney, cardiac tissue, and ovaries (11, 18, 29, 30). We previously demonstrated the ability of this signaling pathway to regulate D1 receptor gene expression directly in the Cath A-derived catecholaminergic cell line (8). Here, we present novel evidence that the expression of renal D1 receptor is regulated by the ECA pathway in vitro and in vivo in a rat model of type I diabetes. Extensive work by several groups has characterized the ECA pathway and its component proteins in the kidney (18, 34). Based on these studies, a pancreato-hepato-renal cascade has been proposed which links pancreatic release of glucagon and elevated hepatic cAMP release with renal adenosine formation (9, 18). Indeed, in the STZ-treated rats, extracellular concentration of adenosine is elevated (21), and levels of the adenosine-metabolizing enzyme, adenosine kinase, are reduced by 50% (36). Our results, showing elevated plasma and urine levels of cAMP in STZ-induced diabetic rat (Fig. 4), support these studies and suggest that the pancreato-hepato-renal cascade is hyperactivated in pathological conditions such as diabetes. This is also consistent with the observation that, in animals and people with obesity, insulin resistance, and hyperlipidemia, oral glucose administration instead of inhibiting, stimulates pancreatic glucagon secretion (19, 20). The excessive glucagon secreted from the pancreas, under these pathological conditions, increases the cAMP synthesized and secreted from the liver (17). Early studies in normal humans showed that administration of glucagon causes large release of cAMP from the liver with plasma levels reaching ∼450 nm (36). The results in Fig. 4 show that the steady-state plasma cAMP levels in STZ-induced diabetic rats was ∼40 nm, which corresponds to a 30% increase compared with control animals. In the urine of diabetic rats, the increase in cAMP levels was even higher; there was a ∼250% increase in cAMP levels compared with control rats. As the stability of cAMP is significantly greater than adenosine, the chronically elevated cAMP level in the diabetic rats promotes the sustained activation of the ECA signaling pathway.
Previous studies have shown that the renal dopaminergic system plays an important role in modulating sodium level, particularly during increases in dietary sodium intake. The renal D1 dopamine receptor is a key component of this regulatory system, controlling the function of sodium-potassium-ATPase and sodium-hydrogen exchanger. A decrease in the expression or function of D1 dopamine receptor will result in increased sodium retention (6, 7), which, if chronically elevated, can potentially lead to the development of hypertension. Indeed, studies have shown that in D1 dopamine receptor knock-out mice the systolic, diastolic, and mean arterial pressures are higher (5). Several studies have also shown a defect in D1 receptor function in hypertension (2). In both type I and type II diabetes, renal D1 dopamine receptor gene expression is reduced >50%, resulting in increased sodium retention (6, 7). The results in Fig. 5 showing a significant reduction in expression of D1 receptor mRNA and protein in the cortex and medulla of kidneys from STZ-treated rats are consistent with these previous studies. The mechanisms that down-regulate D1 dopamine receptor gene expression in diabetes, in the kidney, are not well understood. The results presented here suggest that the ECA pathway is involved in the down-regulation of renal D1 receptor expression in diabetic rats.
The key proteins of the ECA pathway are expressed in the kidney. 5′-Ecto-NT (also called CD73) is expressed in the kidney (37) and its activity and expression are increased in hypertensive and diabetic-hypertensive patients (38), in platelets of alloxan-induced diabetic rats (39), and in adipose tissue of STZ-treated rats and mice (40). Our results suggest differential regulation of 5′-Ecto-NT in the kidney cortex versus medulla of STZ-treated diabetic rats. 5′-Ecto-NT mRNA and protein are down-regulated in the kidney cortex and up-regulated in the kidney medulla (Figs. 6 and 7). TNAP is expressed in the kidney (41, 42); however, its renal expression level in diabetic animal models was not known. The results in Figs. 6 and 7 suggest that TNAP expression in the kidney cortex but not medulla is significantly increased in STZ-treated diabetic rats. The complementary regulation of 5′-Ecto-NT and TNAP in the kidney cortex and medulla of diabetic rats is intriguing and likely determines their individual contribution to regulation of renal D1 receptor by the ECA pathway.
In the kidney, adenosine regulates several physiological functions including renal blood flow, glomerular filtration rate, transport function, and urine flow (43). Adenosine activates four known P1 adenosine receptor subtypes that include the A1, A2a, A2b, and A3. The A1 and A3 adenosine receptors exhibit inhibitory coupling to adenylyl cyclase and decrease cAMP levels whereas A2a and A2b receptors couple to adenylyl cyclase via stimulatory G proteins (Gs/Golf) and increase cAMP levels (44). Compared with other tissues and organs, the various adenosine receptor isoforms are expressed at relatively low levels in normal kidneys (45). In STZ-treated diabetic rats the expression level of adenosine A1, A2a, and A3 receptors in the kidney is increased (35). Our current studies did not identify the adenosine receptor subtype involved in the down-regulation of renal D1 receptors in diabetic rats. In this paper, we evaluated A2a adenosine receptors because our previous study in the Cath A-derived cell line showed that down-regulation of D1 dopamine receptors is mediated by A2a and not A1 adenosine receptors (8). A previous study has shown that the level of A2a receptors in the diabetic kidney cortex is increased 3-fold (35). The results in Fig. 6C are consistent with this observation; moreover, the results show that the up-regulation of adenosine A2a receptor in the diabetic rats is reversed by the AMP-CP treatment (Fig. 9C), suggesting that the A2a receptor is also likely to be regulated by the ECA pathway.
In summary, we have demonstrated that the down-regulation of renal D1 dopamine receptor expression in STZ-induced diabetic rats is mediated by the ECA pathway. Although the D1 receptor is down-regulated in the kidney cortex and medulla, the mechanism underlying the down-regulation is different in the two kidney regions. The results suggest that the 5′-Ecto-NT or CD73 protein mediates the D1 receptor down-regulation in the medulla whereas the TNAP protein is involved in the down-regulation observed in the cortex. Given the role of the renal dopaminergic system and D1 receptors in maintaining sodium homeostasis and blood pressure, the identification of the ECA pathway as a key regulator of renal D1 receptor expression will help develop novel therapeutic approaches to modulate renal D1 receptor expression.
The work was supported by Grant-in-aid 0755940T from the American Heart Association Heritage Affiliate (to E. V. K.).
- ECA
- extracellular cAMP-adenosine
- AMP-CP
- α,β-methyleneadenosine 5′-diphosphate
- 5′-Ecto-NT
- 5′-ectonucleotidase
- SNK
- Student-Newman-Keuls
- STZ
- streptozotocin
- TNAP
- tissue-nonspecific alkaline phosphatase.
REFERENCES
- 1. McDonald R. H., Jr., Goldberg L. I., McNay J. L., Tuttle E. P., Jr. (1964) J. Clin. Invest. 43, 1116–1124 [DOI] [PMC free article] [PubMed] [Google Scholar]
- 2. Hussain T., Lokhandwala M. F. (2003) Exp. Biol. Med. 228, 134–142 [DOI] [PubMed] [Google Scholar]
- 3. Missale C., Nash S. R., Robinson S. W., Jaber M., Caron M. G. (1998) Physiol. Rev. 78, 189–225 [DOI] [PubMed] [Google Scholar]
- 4. Aperia A. C. (2000) Annu. Rev. Physiol. 62, 621–647 [DOI] [PubMed] [Google Scholar]
- 5. Albrecht F. E., Drago J., Felder R. A., Printz M. P., Eisner G. M., Robillard J. E., Sibley D. R., Westphal H. J., Jose P. A. (1996) J. Clin. Invest. 97, 2283–2288 [DOI] [PMC free article] [PubMed] [Google Scholar]
- 6. Marwaha A., Banday A. A., Lokhandwala M. F. (2004) Am. J. Physiol. Renal Physiol. 286, F451–457 [DOI] [PubMed] [Google Scholar]
- 7. Hussain T., Beheray S. A., Lokhandwala M. F. (1999) Hypertension 34, 1091–1096 [DOI] [PubMed] [Google Scholar]
- 8. Do T., Sun Q., Beuve A., Kuzhikandathil E. V. (2007) J. Neurochem. 101, 619–631 [DOI] [PubMed] [Google Scholar]
- 9. Jackson E. K., Dubey R. K. (2001) Am. J. Physiol. Renal Physiol. 281, F597–612 [DOI] [PubMed] [Google Scholar]
- 10. Davoren P. R., Sutherland E. W. (1963) J. Biol. Chem. 238, 3009–3015 [PubMed] [Google Scholar]
- 11. Stone E. A., John S. M. (1990) J. Neurochem. 55, 1942–1949 [DOI] [PubMed] [Google Scholar]
- 12. Kuster J., Zapf J., Jakob A. (1973) FEBS Lett. 32, 73–77 [DOI] [PubMed] [Google Scholar]
- 13. Levy M., Starr N. L. (1972) Kidney Int. 2, 76–84 [DOI] [PubMed] [Google Scholar]
- 14. Exton J. H., Robison G. A., Sutherland E. W., Park C. R. (1971) J. Biol. Chem. 246, 6166–6177 [PubMed] [Google Scholar]
- 15. Latini S., Pedata F. (2001) J. Neurochem. 79, 463–484 [DOI] [PubMed] [Google Scholar]
- 16. Matsuoka I., Ohkubo S. (2004) J. Pharmacol. Sci. 94, 95–99 [DOI] [PubMed] [Google Scholar]
- 17. Broadus A. E., Kaminsky N. I., Northcutt R. C., Hardman J. G., Sutherland E. W., Liddle G. W. (1970) J. Clin. Invest. 49, 2237–2245 [DOI] [PMC free article] [PubMed] [Google Scholar]
- 18. Jackson E. K., Raghvendra D. K. (2004) Annu. Rev. Physiol. 66, 571–599 [DOI] [PubMed] [Google Scholar]
- 19. Velliquette R. A., Koletsky R. J., Ernsberger P. (2002) Exp. Biol. Med. (Maywood) 227, 164–170 [DOI] [PubMed] [Google Scholar]
- 20. Iannello S., Campione R., Belfiore F. (1998) Mol. Genet. Metab. 63, 214–223 [DOI] [PubMed] [Google Scholar]
- 21. Angielski S., Jakubowski Z., Pawelczyk T., Piec G., Redlak M. (1989) Contrib. Nephrol. 73, 52–57 [DOI] [PubMed] [Google Scholar]
- 22. Pawelczyk T., Sakowicz M., Szczepanska-Konkel M., Angielski S. (2000) Arch. Biochem. Biophys. 375, 1–6 [DOI] [PubMed] [Google Scholar]
- 23. Sabra R., Branch R. A. (1991) Antimicrob. Agents Chemother. 35, 2509–2514 [DOI] [PMC free article] [PubMed] [Google Scholar]
- 24. Muruganandan S., Lal J., Gupta P. K. (2005) Toxicology 215, 57–68 [DOI] [PubMed] [Google Scholar]
- 25. Jackson E. K., Mi Z., Zhu C., Dubey R. K. (2003) J. Pharmacol. Exp. Ther. 307, 888–896 [DOI] [PubMed] [Google Scholar]
- 26. Pasuit J. B., Li Z., Kuzhikandathil E. V. (2004) J. Neurochem. 89, 1508–1519 [DOI] [PubMed] [Google Scholar]
- 27. Banday A. A., Hussain T., Lokhandwala M. F. (2004) Am. J. Physiol. Renal Physiol. 287, F109–116 [DOI] [PubMed] [Google Scholar]
- 28. Mishra S. K., Braun N., Shukla V., Füllgrabe M., Schomerus C., Korf H. W., Gachet C., Ikehara Y., Sévigny J., Robson S. C., Zimmermann H. (2006) Development 133, 675–684 [DOI] [PubMed] [Google Scholar]
- 29. Dubey R. K., Gillespie D. G., Mi Z., Jackson E. K. (2000) Hypertension 36, 337–342 [DOI] [PubMed] [Google Scholar]
- 30. Cometti B., Dubey R. K., Imthurn B., Jackson E. K., Rosselli M. (2003) Biol. Reprod. 69, 868–875 [DOI] [PubMed] [Google Scholar]
- 31. Song Z., Sladek C. D. (2005) Brain Res. 1047, 105–111 [DOI] [PubMed] [Google Scholar]
- 32. Zimmermann H. (1992) Biochem. J. 285, 345–365 [DOI] [PMC free article] [PubMed] [Google Scholar]
- 33. Ohkubo S., Kimura J., Matsuoka I. (2000) Jpn. J. Pharmacol 84, 325–333 [DOI] [PubMed] [Google Scholar]
- 34. Jackson E. K., Zacharia L. C., Zhang M., Gillespie D. G., Zhu C., Dubey R. K. (2006) J. Pharmacol. Exp. Ther 317, 1219–1229 [DOI] [PubMed] [Google Scholar]
- 35. Pawelczyk T., Grden M., Rzepko R., Sakowicz M., Szutowicz A. (2005) Am. J. Pathol. 167, 315–325 [DOI] [PMC free article] [PubMed] [Google Scholar]
- 36. Hendy G. N., Tomlinson S., O'Riordan J. L. (1977) Eur. J. Clin. Invest. 7, 155–160 [DOI] [PubMed] [Google Scholar]
- 37. Vekaria R. M., Shirley D. G., Sévigny J., Unwin R. J. (2006) Am. J. Physiol. Renal Physiol. 290, F550–560 [DOI] [PubMed] [Google Scholar]
- 38. Lunkes G. I., Lunkes D., Stefanello F., Morsch A., Morsch V. M., Mazzanti C. M., Schetinger M. R. (2003) Thromb. Res. 109, 189–194 [DOI] [PubMed] [Google Scholar]
- 39. Lunkes G. I., Lunkes D. S., Morsch V. M., Mazzanti C. M., Morsch A. L., Miron V. R., Schetinger M. R. (2004) Diabetes Res. Clin. Pract. 65, 1–6 [DOI] [PubMed] [Google Scholar]
- 40. Jamal Z., Saggerson E. D. (1987) Biochem. J. 245, 881–886 [DOI] [PMC free article] [PubMed] [Google Scholar]
- 41. Nouwen E. J., De Broe M. E. (1994) Kidney Int. Suppl. 47, S43–51 [PubMed] [Google Scholar]
- 42. Hoshi K., Amizuka N., Oda K., Ikehara Y., Ozawa H. (1997) Histochem. Cell. Biol. 107, 183–191 [DOI] [PubMed] [Google Scholar]
- 43. McCoy D. E., Bhattacharya S., Olson B. A., Levier D. G., Arend L. J., Spielman W. S. (1993) Semin. Nephrol. 13, 31–40 [PubMed] [Google Scholar]
- 44. Jacobson K. A., Gao Z. G. (2006) Nat. Rev. Drug Discov. 5, 247–264 [DOI] [PMC free article] [PubMed] [Google Scholar]
- 45. Yaar R., Jones M. R., Chen J. F., Ravid K. (2005) J. Cell. Physiol. 202, 9–20 [DOI] [PubMed] [Google Scholar]


