

Abstract
Glioblastomas are the most common CNS tumors in adults, and they remain resistant to current treatments. ErbB1 signaling is frequently altered in these tumors, which indicates that the erbB receptor family is a promising target for molecular therapy. However, data on erbB signaling in glioblastomas are still sparse. Therefore, we undertook a comprehensive analysis of erbB receptor and ligand expression profiles in a panel of nine glioblastomas that were compared to non-neoplastic cerebral tissue containing neocortex and corresponding portions of subcortical convolutional white matter and we determined the distribution patterns of erbB receptors among the main neural cell types that are present in these tumors, particularly the putative tumoral stem cell population. Using quantitative RT-PCR and western blot analysis, we showed that erbB1 signaling and erbB2 receptors exhibited highly variable deregulation profiles among tumors, ranging from under- to overexpression, while erbB3 and erbB4 were down-regulated. Immunohistochemistry revealed an important inter- and intra-tumoral heterogeneity in all four erbB expression profiles. However, each receptor exhibited a distinct repartition pattern among the GFAP-, Olig2-, NeuN- and CD133-positive populations. Interestingly, while erbB1 immunoreactivity was only detected in small subsets of CD133-positive putative tumoral stem cells, erbB3 immunoreactivity was prominent in this cell population thus suggesting that erbB3 may represent a new potential target for molecular therapy.
Keywords: brain tumors, erbB receptors, EGF ligands, neuroglia, tumoral stem cells, heterogeneity, immunohistochemistry
Keywords: Adolescent; Adult; Aged; Antigens, CD; metabolism; Blotting, Western; Brain Neoplasms; genetics; metabolism; Cells, Cultured; Cerebral Cortex; metabolism; Female; Fluorescent Antibody Technique; Gene Expression Regulation, Neoplastic; Glial Fibrillary Acidic Protein; genetics; metabolism; Glioblastoma; genetics; metabolism; Glycoproteins; metabolism; Humans; Male; Middle Aged; Neoplastic Stem Cells; Peptides; metabolism; RNA, Messenger; genetics; metabolism; Receptor, Epidermal Growth Factor; genetics; metabolism; Receptor, erbB-2; genetics; metabolism; Receptor, erbB-3; genetics; metabolism; Regression Analysis; Reverse Transcriptase Polymerase Chain Reaction
Introduction
Glioblastomas are the most common primary central nervous system (CNS) tumors in adults. They represent the most malignant form of glioma (World Health Organization (WHO) grade IV) and arise either from the progression of a lower grade glioma (secondary glioblastoma) or de novo, without any known history of a preceding tumor (de novo or primary glioblastoma). Glioblastoma is one of the most aggressive human neoplasms, with a median survival ranging from 12 to 15 months (1).
Despite the identification of numerous genetic alterations in glioblastomas, only a few signaling pathways emerge as prominent targets of deregulation. Among them is the erbB family of tyrosine kinase receptors (also called HER in human). This family comprises four members, which are erbB1/EGFR, erbB2/neu, erbB3 and erbB4. ErbB receptors are activated by peptidic growth factors of the EGF (Epidermal Growth Factor) family. In glioblastoma, EGFR is one of the most frequently altered genes. Amplification of EGFR is reported in ~40% cases and is often associated with rearrangements, which leads to the synthesis of constitutively active mutant receptors. All those deregulations result in excessive activation of the EGFR signaling pathway that promotes proliferation, motility, survival and resistance to apoptosis of glioma cells (2). Although there has been extensive literature concerning EGFR in glial tumors, relatively few studies have been conducted on the other members of the erbB family. Overexpression of erbB2 has been reported in variable proportions within glioblastomas (3–6) and appears as a marker of poor prognosis (7–9). Data concerning the neuregulin receptors erbB3 and erbB4 in gliomas are even scarcer, although a few studies have reported their expression in glioblastoma tissues (10, 11). Complex interplay between the members of the erbB family is an essential hallmark of this signaling pathway, and the biological response of a cell to an EGF ligand is dependent on the identity of the ligand, the type of erbB dimers that are recruited and the whole expressed erbB repertoire (12–15). Although few studies have addressed the expression status of the family of erbB receptors in gliomas (10, 11), an integrated analysis of the expression of all erbB receptor and ligand family members in glioblastomas compared to non-neoplastic cerebro-cortical tissues has not been performed so far.
ErbB receptors are essential for nervous system development and function. They regulate key processes such as proliferation, self-renewal and the migration of stem/progenitor cells, and they also regulate their commitment into each of the three main neural lineages (16–19). The cellular heterogeneity of the CNS is recapitulated in glioblastomas, where tumoral cells have been shown to express astrocytic markers, such as GFAP, oligodendroglial markers, such as the Olig proteins (20–23) and neuronal markers, such as the neurofilament protein (NFP) or NeuN (24–27). Moreover, a small population of tumor-initiating cells that express the stem cell marker CD133 and exhibit neural stem cells properties (28–30) has been identified in glioblastomas, which suggested that this phenotypic heterogeneity could arise from aberrant differentiation of the tumoral stem cells (31). Despite the fact that the erbB receptors are key regulatory elements in the emergence and maintenance of the cellular heterogeneity in the normal CNS, their expression in the different phenotypic populations that are present in glioblastomas has never been explored.
Here, we report a comprehensive analysis of the expression of the entire family of erbB receptors in a panel of glioblastomas that were compared to non-neoplastic cerebral tissue containing neocortex and corresponding portions of subcortical convolutional white matter, using quantitative RT-PCR, western blot analysis and immunohistochemistry. The expression profile of the eleven EGF peptide-encoding genes was also evaluated. We determined the distribution profile of the erbB receptors among four major neural cell types that are present in glioblastomas, which were identified using GFAP, Olig2, NeuN and CD133 co-immunolabelings. Quantitative analysis revealed that expression of the erbB receptors and their ligands was deregulated in tumors, with deregulations ranging from underexpression to overexpression when compared to normal tissue. Immunohistochemistry showed a wide heterogeneity in all four erbB expression patterns both between and within samples. However, each receptor exhibited a specific repartition profile among the four neural cell types examined. In particular, erbB3 immunoreactivity was detected in the vast majority of CD133-positive putative cancer stem cells, which suggests that this receptor could represent a novel potential therapeutic target.
Materials and Methods
Tissue specimens
Specimens of nine glioblastomas and four adult cerebral cortices were obtained from the Neurosurgery Clinic of the University Hospital of Lille. The tumors were classified and graded by a neuropathologist according to the World Health Organization classification (WHO) (32). The control samples were non-neoplastic cerebral tissue containing neocortex and corresponding portions of subcortical convolutional white matter. Clinical details (sex, age at surgery, cortical location and pathology) of the four control samples are displayed in Table 1. Seven glioblastoma specimens were retrieved at initial surgery, and two samples were resected at recurrence (Table 2). All specimens were excess brain tissue. Three fetal brains were collected on human fetuses aged between 10 and 12 weeks old obtained after elective abortion from the gynecology department of the University Hospital of Lille. Residual brain tissue was collected by a multicenter European program of intracerebral transplantation of fetal neurons for the treatment of Huntington’s chorea at the University Hospital of Lille. The tissues were made available immediately after sterile retrieval of ganglionic eminences. Written informed consent had been previously obtained from all patients and/or their family members. Permission to utilize human brain tissue was obtained from the French agency on biomedical research (Agence de la Biomédecine, Saint-Denis la Plaine, France). Immediately after surgery, tissue samples (~0.5 mm3–1 cm3) were rinsed in Phosphate Buffer Saline and cut into small pieces (~0.2–0.3 mm3). Some tissue pieces were frozen in liquid nitrogen for RNA and protein extractions, and some were frozen in Tissue Tek® compound for immunohistochemistry. Samples were stored at −80°C until use.
Table 1.
Clinical details of the four control cortical samples analyzed
| Patient code | Sex | Age at surgery (years) | Cortical location | Pathology |
|---|---|---|---|---|
| C1 | F | 73 | Right temporal | Meningioma |
| C2 | M | 14 | Left temporal | Epilepsia |
| C3 | F | 50 | Left temporal | Glioblastoma |
| C4 | M | 65 | Right frontal | Hematoma |
Table 2.
Clinicopathologic characteristics of the nine patients with glioblastoma analyzed
| Patient code | Sex | Age at diagnosis (years) | Status WHOa | Delay 1st symptoms - diagnosis (days) | GBM nature | Tumor location | Extent of surgery | Associated treatment | Delay of recurrence (months) | Follow-up (months) | Survival (months) |
|---|---|---|---|---|---|---|---|---|---|---|---|
| G1 | F | 72 | 1 | 15 | de novo | Frontal | Radical | RC | Uk | Uk | Uk |
| G2 | M | 72 | 1 | 21 | de novo | Parietal | Partial | R | 4 | 17 | 17 |
| G3 | M | 65 | 2 | 60 | de novo | Temporal | Radical | RC | 4 | 5 | 7 |
| G4 | M | 56 | 1 | 30 | de novo | Frontal | Partial | RC | 11 | 17 | 17 |
| G5 | M | 47 | 1 | 21 | de novo | Parietal | Radical | RC | 12 | 18 | 18 |
| G6 | M | 32 | 1 | 21 | de novo | Frontal | Partial | RC | 4 | 18 | 18 |
| G7 | F | 41 | 0 | 90 | de novob | Temporal | Repeated | C | 6 | 14 | Uk |
| G8 | M | 20 | 0 | 60 | de novob | Frontal | Repeated | C | 10 | 17 | 17 |
| G9 | M | 26 | 1 | 30 | secondary | Frontal | Radical | C | 9 | 3 | 30 |
WHO clinical status before surgery was graded as follows: Status WHO 0: Karnofsky = 100, no clinical symptoms; Status WHO 1: 80 < Karnofsky < 90, minor symptoms such as visual amputation or headaches; Status WHO 2: 60 < Karnofsky < 70, confined to bed < 50% of the day; Status WHO 3: 40 < Karnofsky < 50, confined to bed > 50% of the day; Status WHO 4: 20 < Karnofsky < 30, bedridden
Samples retrieved during surgery for recurrence
Abbreviations: GBM, glioblastoma multiforme (WHO IV); M, male; F, Female; RC, radiotherapy with concomitant temozolomide chemotherapy; R, radiotherapy; C, chemotherapy; Uk, unknown.
Clinical data
Data for all patients with newly diagnosed or recurrent glioblastoma were retrospectively analyzed (Table 2). Clinical data (age, performance status), treatment (type of surgery, radiotherapy, chemotherapy) and tumor characteristics (location, nature) were recorded. WHO clinical status grading was used in this study. On clinical grounds, eight glioblastomas were considered to be probable primary (de novo), and one was considered to be probable secondary. Indeed, tumors were categorized as de novo when the patient did not develop any previous cerebral tumor, when the clinical history was short, and when the patient did not undergo any previous epileptic episode. Histological features were also considered, such as absence of oligodendroglioma foci or lower grade foci within the tumor. Seven patients were males, and two were females, with a mean age at diagnosis of 47.8 years (range, 20–72). The mean delay between first symptoms and diagnosis was 38.6 days (range, 15–90). All patients underwent surgery (radical or partial) followed by radio- and/or chemotherapy. The mean follow-up of patients was 17 months. Eight patients developed recurrence, and the ninth was lost. The mean delay of recurrence was 7.5 months (range, 4–12). Among the eight remaining patients, four underwent a second surgery followed by chemotherapy, and all of them experienced a second recurrence with a mean delay of 6.2 months after surgery (range, 4–12). For the seven patients with a complete follow-up, the mean survival time was 17.7 months (range, 7–30) after the initial surgery date.
Cell culture
Primary astrocytes cultures from the cortex and the hypothalamus of human fetuses were prepared as described in detail elsewhere (15). The U251 and U373 human glioblastoma cell lines were cultured in DMEM supplemented with 10% (v/v) fetal calf serum (Invitrogen, France), 1% (v/v) L-glutamine (Invitrogen) and 2% (v/v) antibiotics (penicillin/streptomycin; Invitrogen) under a humid atmosphere of 5% CO2-95% air at 37°C. The T98G cell line was cultured in the same medium supplemented with 1% MEM Non Essential Amino Acids (Invitrogen). Confluent 10 cm diameter dishes were used for RNA and/or protein extraction, and poly-L-lysine (Sigma; Saint Quentin Fallavier, France)-coated glass coverslips from twenty four-well plates were used for immunofluorescent labeling.
Real-time quantitative RT-PCR
The theoretical basis, primers and PCR consumables, RNA extraction, cDNA synthesis and PCR reaction conditions are described in detail elsewhere (33). We quantified transcripts of the gene encoding the TATA box-binding protein (TBP) as the endogenous RNA control, and each sample was normalized on the basis of its TBP content. Results, which were expressed as N-fold differences in target gene expression relative to the TBP gene and termed “Ntarget”, were determined as Ntarget = 2ΔCtsample, where the ΔCt value of the sample was determined by subtracting the average Ct value of the target gene from the average Ct value of the TBP gene. The nucleotide sequences of the oligonucleotide hybridization primers are shown in Supplementary Table 1. Expression of EGF signaling genes in the glioblastomas compared to control tissues was termed “fold mRNA expression” (Fig. 1 and 2F–I) and corresponded to the Ntarget values of the tumoral samples that were subsequently normalized, such that the mean of the four non-neoplastic cortical tissues Ntarget values was 1. “Fold mRNA expression” values between 2 and 3 were considered to represent overexpression, values of 3 or more were considered to represent marked overexpression, values between 0.33 and 0.5 were considered to represent underexpression, and values of 0.33 or less were considered to represent marked underexpression of genes as compared to control tissues. Very low levels of target gene mRNA, which were only detectable but not reliably quantifiable by means of real-time quantitative RT-PCR assays, as based on fluorescence SYBR Green methodology (Ct >35), were considered to be “non-expressed”. Experiments were performed with duplicates for each data point.
Figure 1.

Messenger RNA (mRNA) expression of erbB signaling genes in glioblastomas as compared to control cortices. Real-time quantitative RT-PCR analysis of the four ERBB genes and their eleven ligands (EGF, TGFα, AREG, EPGN, HB-EGF, BTC, EREG, NRG1, NRG2, NRG3 and NRG4) in the nine glioblastoma samples (G1 to G9). Messenger RNA levels of three zinc-dependent matrix metalloproteinases that are involved in ectodomain shedding of erbB ligands (MMP2, MMP9 and ADAM17) and of the KI67 cellular proliferation marker were also evaluated. Results are expressed as the fold increase in gene expression level in the nine glioblastoma samples relative to the mean respective expression level in the four non-neoplastic cortical tissues. Fold expressions were scored as described in the colorimetric scale and the materials and methods section. Note that, although ERBB1 receptor and ligands and ERBB2 receptor mRNA exhibit highly heterogeneous deregulation profiles between tumors, most NRG signaling genes globally show underexpression in our panel of glioblastomas as compared to control cortices. NE, non-expressed.
Figure 2.

Protein expression of erbB receptors in glioblastoma tissues and cell lines and in control samples. (A) Western blot analysis of erbB1-4 receptors expression in control non-neoplastic samples (primary cultures of fetal cortical (Ctx) and hypothalamic (Hyp) astrocytes, fetal brain, and the four cerebral cortex samples C1 to C4) and in neoplastic samples (the nine glioblastomas G1 to G9, and three human glioblastoma cell lines (hGBM cell lines)). Eighty-five micrograms of proteins were loaded into each well. Three primary cultures of fetal cortical, hypothalamic astrocytes and three fetal brains were analyzed. One representative sample of each is shown (B–E) Densitometric analysis of erbB1 (B), erbB2 (C), erbB3 (D) and erbB4 (E) protein expression in the four control cortical tissues (Cortex) and the nine glioblastoma samples. X axis, sample number. Results are expressed as the fold increase in erbB protein expression for each glioblastoma sample (black columns) relative to the mean respective erbB protein expression in the four non-neoplastic cortical tissues (white columns). Horizontal solid line, mean erbB protein expression in the four control cortical samples normalized to 1. Note that erbB1 and erbB2 receptors exhibit highly discrepant expression profiles among tumoral samples, while erbB3 and erbB4 protein contents are consistently down-regulated in our glioblastoma panel. (F–I) For each erbB receptor, the fold mRNA expression values were compared to the respective fold protein expression values across the glioblastoma cohort using a linear regression test. Note the overall correlation between mRNA and protein levels of erbB receptors in tumors relative to control cortices.
Antibodies
Antibodies used for western blot experiments
The four anti-erbB antibodies used for the analysis of all samples and quantifications (Fig. 2) were rabbit polyclonal antibody anti-erbB1 from Upstate Biotechnologies (Lake Placid, NY; 1.5 μg/ml) and rabbit polyclonal antibody anti-erbB2 (sc-284; 1:500), rabbit polyclonal antibody anti-erbB3 (sc-285; 1:100), rabbit polyclonal antibody anti-erbB4 (sc-283; 1:200), all from Santa Cruz Biotechnology (Santa Cruz, CA). Additional experiments (Supplementary Fig. 1 and 2) were performed using the following anti-erbB antibodies: anti-erbB1 antibodies from Upstate Biotechnologies (sheep polyclonal; 1.5 μg/ml), Zymed (San Francisco, CA; mouse monoclonal, clone 31G7; 1:100) and Cell Signaling Biotechnologies (Beverly, MA; rabbit monoclonal, clone 15F8; 1:1000), anti-erbB2 antibodies from DakoCytomation (Denmark; rabbit polyclonal, Nr. A0485; 1:500) and Novocastra Laboratories (Newcastle Upon Tyne, UK; mouse monoclonal, NCL-CB11; 1:100), and anti-erbB3 antibody from Upstate Biotechnologies (mouse monoclonal, clone 2F12; 1:500). The goat polyclonal antibody anti-actin (sc-1616; 1:1000) was from Santa Cruz Biotechnology, and the rabbit polyclonal antibody anti-Akt was from Cell Signaling Biotechnologies (1:1000). Horseradish peroxidase-conjugated secondary antibodies were from Sigma.
Antibodies used for immunohistofluorescence
The antibodies anti-erbB receptors used were mouse monoclonal antibody anti-erbB1, extracellular domain (Zymed; clone 31G7; 1:20), rabbit polyclonal antibody anti-erbB2, cytoplasmic domain (DakoCytomation; Nr. A0485; 1:250), mouse monoclonal antibody anti-erbB3, cytoplasmic domain (Upstate Biotechnologies; clone 2F12; 1:50), mouse monoclonal antibody anti-erbB4, extracellular domain (NeoMarkers, Fremont, CA; Ab-1, clone H4.77.16; 1:100). Neural cell types were identified using rabbit polyclonal antibody anti-GFAP (DakoCytomation; Nr. Z0334; 1:500), mouse monoclonal antibody anti-GFAP (Sigma; Nr. G3893, clone G-A-5; 1:500), mouse monoclonal antibody anti-NeuN, biotin conjugated (Chemicon International, Temecula, CA; MAB377B; 1:100), rabbit polyclonal antibody anti-Olig2 (gift from Dr. H. Chneiweiss, Paris, France; B119 antiserum; 1:500), and rabbit polyclonal antibody anti-CD133 (AbCam, France; ab16518; 1:50). The GFAP and NeuN antibodies were previously described for immunohistochemistry on human sections (27, 34). The anti-Olig2 antibody was produced and characterized by Dr. Hervé Chneiweiss (Inserm U894, University of Paris 5, Hospital Sainte-Anne, Department of Anatomopathology, Paris, France). The specificity of the CD133 antibody was verified by western blot assay, which showed that this antibody yielded a band at the expected molecular weight (~120 kDa) in protein extracts from human fetal brain, while no signal was detected in extracts of adult human cerebral cortex (data not shown). Proliferating cells were identified using rabbit polyclonal antibody anti-Ki67 (AbCam; ab15580; 1:100). The secondary antibodies used were Alexa 568-conjugated goat antirabbit, Alexa 488-conjugated goat anti-rabbit, Alexa 568-conjugated goat anti-mouse and Alexa 488-conjugated goat anti-mouse antibodies (all from Molecular Probes, Eugene, OR, USA; 1:400).
Specificity of anti-erbB antibodies used for western blot experiments
All anti-erbB antibodies yielded a band at the expected molecular weight (171 kDa for erbB1 and 185 kDa for erbB2, erbB3 and erbB4) in protein extracts from human fetal and adult brain, primary cultures of human astrocytes, glioblastoma tissues and cell lines (Fig. 2A, Supplementary Fig. 1 and 2). Consistent with our previous data (15), the four erbB receptors were detected in human fetal brain tissue, erbB3 was undetectable in protein lysates from human fetal hypothalamic astrocytes cultures, and erbB4 was undetectable in protein lysates from human fetal cortical astrocytes cultures (Fig. 2A). The specificity of antibodies was further verified using blocking peptides (Supplementary Fig. 1C). Anti-erbB1, erbB2, erbB3 and erbB4 antibodies were pre-incubated for 5 hours at 4°C with a 10-fold molar excess of erbB1 (BP7628b, Abgent, San Diego, CA), erbB2 (sc-284P, Santa Cruz Biotechnology), erbB3 (sc-285P, Santa Cruz Biotechnology) and erbB4 (sc-283P, Santa Cruz Biotechnology) blocking peptides, respectively, and subsequently immunoblotted with ~100 μg protein extracts from primary cortical astrocytes cultures (for erbB1, erbB2 and erbB3) or fetal brain (for erbB4).
Specificity of anti-erbB antibodies used for immunohistofluorescence
In western blot assay, anti-erbB1, erbB2 and erbB3 antibodies yielded a band at the expected molecular weight in protein extracts from primary cortical astrocytes cultures (Supplementary Fig. 1B) and from cortical and glioblastoma tissues (Supplementary Fig. 2). Of note, the anti-erbB4 antibody (NeoMarkers) did not work in western blot assays. To further verify the specificity of these antibodies, protein extracts from cultured cortical astrocytes (for erbB1, erbB2 and erbB3) or cultured hypothalamic astrocytes (for erbB4) were immunoprecipitated (IPP) with the anti-erbB antibodies used for immunohistofluorescence (see Immunoprecipitation and Western Blot section). Protein lysates (before and after IPP) were immunoblotted with the anti-erbB antibodies used for western blot experiments (Supplementary Fig. 1A). To check for equal protein loading and IPP efficiency, membranes were immunoblotted with anti-Akt antibody.
Immunoprecipitation and Western Blot
Samples were lysed in freshly prepared lysis buffer (25 mM Tris pH 7.4, 50 mM β-glycerophosphate, 1% triton X-100, 1.5 mM EGTA, 0.5 mM EDTA, 1 mM sodium pyrophosphate, 1 mM sodium orthovanadate, 10 μg/ml leupeptin and pepstatin A, 10 μg/ml aprotinin, 100 μg/ml PMSF). For immunoprecipitation of erbB receptors, equal amounts of protein (800–1000 μg) contained in a total volume of 750 μl of lysis buffer were incubated with 4 μg of antibody with gentle rocking overnight at 4°C. Thereafter, 60 μl of protein A-Sepharose (Sigma) 1:1 slurry in lysis buffer was added to the antibody-antigen complex, and incubated for an additional 4 hours at 4°C. The Sepharose beads were collected by centrifugation, washed twice with ice-cold lysis buffer and resuspended in 50 μl of 2X sample buffer. Protein extracts were size-fractionated by SDS-PAGE, as previously described (15, 35, 36). The membranes were exposed overnight at 4°C to primary antibodies diluted in Tris buffer saline (TBS; 0.05 M Tris, pH 7.4, 0.15 M NaCl) containing 0.05% Tween 20 and 5% non-fat milk. Protein expression was densitometrically analyzed using the Scion Image software (Scion Corporation, Maryland, USA). Expression of the erbB receptors for each sample was determined as the densitometric value of the erbB signal divided by the densitometric value of the actin signal revealed on the same membrane. The erbB protein expression values in each glioblastoma sample were subsequently normalized such that the mean of the four control cortical tissues’ expression values was 1, and were termed “fold protein expression” (Fig. 2B–I).
Immunohistochemistry
The Tissue Tek® (Sakura Finetek, Villeneuve d’Ascq, France)-embedded frozen tissues were cut on a cryostat (Leica CM 3050, Nussloch, Germany) in 10 μm sections. The sections were fixed with 1% paraformaldehyde in 0.1 M phosphate buffer saline (PBS) (pH 7.4) for 15 minutes at room temperature (RT). For the erbB2 and CD133 immunostainings, the sections were first fixed in paraformaldehyde and then immersed for 1 minute in a solution of acetone/methanol 1:1 pre-cooled at −20°C. For the Ki67 immunolabeling, the sections were submitted to a microwave pretreatment (4 min at 800 W followed by two 5-min cycles at 400 W in 0.1 M sodium citrate buffer, pH 6) prior to the immunohistochemistry procedure. Nonspecific sites were blocked with PBS containing 0.3% Triton X-100 and 2% normal goat serum for 10 min at RT, and sections were then incubated with antibodies diluted in that same solution. The primary antibodies were applied for two nights at 4°C and the secondary antibodies for 1 hour at RT. Cell nuclei were stained with Hoechst 33258 bi-benzimidine (Molecular Probes; 1:1000). Importantly, to avoid the strong autofluorescence caused by lipofuscin granules usually present in adult human brain tissue, sections were immersed in a solution of 0.3% Sudan Black B (Sigma) in 70% ethanol for 10 min (37). Control sections were incubated in the absence of primary antibody. Immunolabeling of the human glioblastoma cell lines was performed following the procedure used to label tissue sections. Immunofluorescence was examined on a fluorescent microscope (Imager.Z1, Zeiss, Le Pecq, France) with appropriate filters. Images were acquired using an AxioCam MRm camera (Zeiss) driven by AxioVision software (Zeiss).
Immunohistochemistry quantitative analysis
Immunostainings were independently assessed by three of the authors (VDT, VP and AS) on the entire surface of 2–4 sections per tissue specimen. Quantification of the expression of erbB receptors was made by counting the % number of erbB-immunoreactive cells over the total number of Hoechst-positive nuclei. Endothelial cells, identified by the small elongated shape of their nuclei, most often lining the border of a cavity, were excluded from the total cell population count. In most glioblastomas, despite widespread erbB4 immunostaining, absence of erbB4 immunoreactivity in cell bodies precluded quantification of the % number of erbB4-expressing cells. Quantification of the expression of erbB receptors in the different cell types was made by counting the % number of erbB/GFAP-, Olig2-, NeuN- or CD133-co-expressing cells over the total number of GFAP-, Olig2, NeuN- or CD133-positive cells, respectively. The quantitative analysis was made by performing a double-blind assessment of microphotographs taken at the x40 objective on several sections of each tissue specimen. A total of 29 to 106 images, i.e., n = 6411 ± 1792 cells, were counted per tissue specimen. In particular, between 29 and 31 images (i.e., 758 to 1246 cells counted) were analyzed for the quantification of erbB3 and erbB4 expression in each of the control cerebral cortices examined. Due to the intra-tumoral heterogeneity of erbB distribution, a higher number of images were analyzed in glioblastoma samples. Therefore, between 60 and 106 images (i.e., 1409 to 20862 cells counted) were analyzed in each of the nine glioblastoma specimens. To analyze the expression of erbB receptors in endothelial cells, only small and elongated cell nuclei lining the border of a cavity were taken into account.
Statistics
To determine whether the fold erbB expression in tumors relative to control tissues was correlated at the mRNA and protein levels, a linear regression test was performed. The level of significance was set at P < 0.05.
Results
ErbB signaling gene expression was studied in a panel of nine glioblastoma samples in comparison with four non-neoplastic adult cerebral cortex tissues. The clinical characteristics of tissue samples are detailed in Tables 1 and 2.
ErbB receptors mRNA and protein tissue expression in normal brain and in glioblastoma
ERBB signaling genes expression in control cortices and in glioblastoma
Real-time quantitative RT-PCR showed that control cortical tissues expressed the four ERBB receptors and all EGF ligands except AREG and EPGN (Supplementary Table 2).
All tumoral samples exhibited deregulations in the expression of erbB ligand genes compared to control cortical tissues (Fig. 1 and Supplementary Table 2). While EPGN was not detected in any glioblastoma, as in the control cortices, AREG mRNA expression emerged in 5/9 tumor samples. The other erbB1 ligand genes (EGF, TGFα, HB-EGF, BTC, EREG) exhibited highly heterogeneous expression profiles, ranging from underexpression to overexpression, depending on the tumor. In contrast, most NRG genes (NRG2, NRG3 and/or NRG4) were down-regulated in glioblastoma samples. All four ERBB mRNA were detected in each tumor sample. However, while ERBB1 and ERBB2 mRNA expression was highly variable among samples, ranging from underexpression to overexpression, the two NRG receptors, ERBB3 and ERBB4, showed marked underexpression in most glioblastomas. Moreover, genes encoding the two zinc-dependent matrix metalloproteinases MMP2 and MMP9, which are involved, at least in part, in ectodomain shedding of erbB ligands (38), were strongly overexpressed in most glioblastoma samples. All tumors exhibited marked overexpression of the cellular proliferation marker KI67 gene, arguing for the tumoral nature of specimens and the absence of massive necrosis in the tissue pieces analyzed (39, 40).
Western blot analysis of erbB receptors protein expression in control samples and in glioblastoma tissues and cell lines
ErbB protein expression was analyzed in a series of control non-neoplastic samples. As previously reported (15), the four erbB receptors were detected in human fetal brain. Consistent with our previous findings, primary cultures of human fetal cortical astrocytes lacked erbB4 expression, whereas fetal hypothalamic astrocytes were devoid of erbB3 protein (Fig. 2A). All four erbB receptors were detected in the adult cerebral cortex tissues, albeit at varying levels between samples (Fig. 2A, lanes C1 to C4, and B–E, white bars).
ErbB1 and erbB2 receptors were expressed in all glioblastomas, while erbB3 and erbB4 proteins were detected in 7/9 and 8/9 glioblastoma samples, respectively (Fig. 2A, lanes G1 to G9). The panel of tumoral samples exhibited a wide range of erbB1 and erbB2 expression strengths, with glioblastomas presenting lower, similar or higher protein levels than the mean erbB1 and erbB2 content in the four cortical non-neoplastic tissues, respectively (Fig. 2A, B, C). Noteworthy, only two tumors (G1 and G6) exhibited erbB1 protein overexpression compared to the mean erbB1 expression in control cortex samples. A positive correlation was noted between erbB1 and erbB2 expression, both at the protein level (r2 = 0.87; linear regression, P < 0.001) and at the mRNA level (r2 = 0.92; linear regression, P < 0.001) across the glioblastoma series. In tumoral samples, erbB3 and erbB4 receptors were underexpressed compared to control cortices (Fig. 2A, D, E). The erbB protein expression profiles in the glioblastoma and cortical tissues were further confirmed by western blot analysis using a battery of distinct anti-erbB antibodies (Supplementary Fig. 2). Although distinct antibodies showed different detection sensibilities, all antibodies directed against the same erbB receptor yielded a similar expression profile across the samples series (Supplementary Fig. 2). The linear regression test revealed that across the glioblastoma cohort, the mRNA levels positively correlated with the protein levels for each erbB receptor (Fig. 2F–I).
We also evaluated the expression of erbB signaling genes in three human glioblastoma cell lines (T98G, U251 and U373) that are commonly used as model systems for glioma research. While all three cell lines expressed erbB1 and erbB2 both at the protein and mRNA level, none of them expressed erbB3 or erbB4 (Fig. 2A and Supplementary Table 2). Moreover, marked differences were noted in the expression profile of EGF ligands between the glioblastoma cell lines and biopsies, such as emergence of EPGN expression and lack of AREG, EREG, NRG3 and NRG4 mRNA detection in the tumoral cell lines (Supplementary Table 2).
Altogether, these results show that expression of ERBB signaling genes is deregulated in glioblastoma tissues when compared to control cortices. The erbB1 receptor and ligands and the erbB2 receptor exhibited highly heterogeneous deregulation profiles among tumors, but overexpression of erbB1 and erbB2 was limited to a minority of tumors. In contrast, most NRG receptors and ligands showed underexpression in the glioblastomas.
ErbB receptors cellular distribution in the cerebral cortex and in glioblastoma
Adult cerebral cortex
All cerebro-cortical samples presented similar immunoreactivity profiles for the erbB receptors and the GFAP, NeuN and Olig2 cellular markers. The control cerebral cortices stained negatively for erbB1 and erbB2. Strong erbB3 immunostaining was detected in 92.8 ± 2.7% NeuN-positive cells (Fig. 3A–C), in a large fraction of the Olig2-positive cell population, both in the grey and the white matter (64.1 ± 12.8% and 65.6 ± 2.0%, respectively, Fig. 3D–F) and in 72.4 ± 9.9% of GFAP-positive astrocytic cell bodies (Fig. 3G–I). ErbB4 expression was only detected in NeuN-positive cells and was restricted to a small fraction of this cell population (18.7 ± 6.0%, Fig. 3J–L). In contrast to erbB3 immunostaining that was limited to the proximal part of neurites (Fig. 3A), erbB4 staining extended along neuronal processes with a punctuated aspect (Fig. 3J).
Figure 3.

In the human adult cerebral cortex, erbB3 expression is detected in neurons, oligodendrocytes and astrocytes, whereas erbB4 expression is restricted to a sub-population of neurons. (A–I) Double immunofluorescent labeling of erbB3 (green) with NeuN (red), Olig2 (red) or GFAP (red) shows an expression of erbB3 in neurons, oligodendrocytes and astrocytes, respectively (arrows). The asterisks point to an Olig2-positive oligodendrocyte devoid of erbB3 immunoreactivity in the white matter (D–F) and a GFAP-positive astrocyte lacking erbB3 immunoreactivity in the grey matter (G–I). (J–L) Double immunofluorescent labeling of erbB4 (green) and NeuN (red) reveals that erbB4 is expressed in a subset of neurons (arrows) scattered among erbB4-negative neurons (asterisk) in the cortex. Note that NeuN is detected both in the nucleus and the soma cytoplasm of neurons (B, K), as described elsewhere (67). Nuclei were counter-stained with Hoechst (blue). Scale bar = 20 μm.
Glioblastoma
Immunostainings of GFAP, NeuN and Olig2 were seen in all glioblastomas, with distinct aspects compared to non-neoplastic cerebral cortices. Moreover, the staining pattern was highly heterogeneous both between and within tumors. The dense network of GFAP-positive thick filaments (Fig. 4B, 5B) was additionally dotted with numerous hypertrophic astrocytes in four samples (Fig. 6B, right and 7B). Olig2- and NeuN-positive nuclei exhibited a high heterogeneity in their density, repartition, size and shape (Fig. 4E, 5E, H, 6E, H, 7E). In two tumors, the NeuN-immunostaining aspect was reminiscent of that seen in the non-neoplastic cortex (Fig. 5H inset and 6H, main panel).
Figure 4.

ErbB1 expression is detected in all glioblastoma samples with highly variable immunoreactivity profiles but is preferentially expressed in the GFAP- and Olig2-positive cellular contingents. (A–F) Double immunofluorescent labeling of erbB1 (green) with GFAP (red) or Olig2 (red) reveals the presence of erbB1 in a fraction of the GFAP-positive cell population (A–C, arrows) and of the Olig2-positive cell population (D–F, arrows). Nuclei were counter-stained with Hoechst (blue). Scale bar = 20 μm. (G) Quantification of erbB1 expression in the nine glioblastoma samples. Results are expressed as the % number of erbB1-immunoreactive cells over the total number of Hoechst-positive nuclei. Vertical bars represent SEM. (H) Quantification of erbB1 expression in GFAP-, Olig2- and NeuN-positive cell populations (see materials and methods). Bar graph represents the mean % of erbB1-immunoreactive cells on the nine erbB1-immunoreactive (ir) glioblastomas (GBM) in each cell type. Vertical bars represent SEM.
Figure 5.

ErbB2 immunoreactivity is detected in all glioblastoma samples with heterogeneous tissue and cellular expression profiles among samples. (A–I) Double immunofluorescent labeling of erbB2 (green) with GFAP (red), Olig2 (red) or NeuN (red) reveals that erbB2 is expressed in GFAP- (A–C, arrows), Olig2- (D–F, arrows) and NeuN-positive cells (G–I, arrows). Note that erbB2 is detected in NeuN-immunoreactive cells that exhibit a big round nucleus reminiscent of those seen in the normal cortex (G–I, inset) or in NeuN-positive nuclei of small size and heterogeneous shapes (G–I, main panel). Nuclei were counter-stained with Hoechst (blue). Scale bar = 20 μm. (J) Quantification of erbB2 expression in the nine glioblastoma samples. Results are expressed as the % number of erbB2-immunoreactive cells over the total number of Hoechst-positive nuclei. Vertical bars represent SEM. (K) Quantification of erbB2 expression in GFAP-, Olig2- and NeuN-positive cell populations (see materials and methods). Bar graph represents the mean % of erbB2-immunoreactive cells on the nine erbB2-immunoreactive (ir) glioblastomas (GBM) in each cell type. Vertical bars represent SEM.
Figure 6.
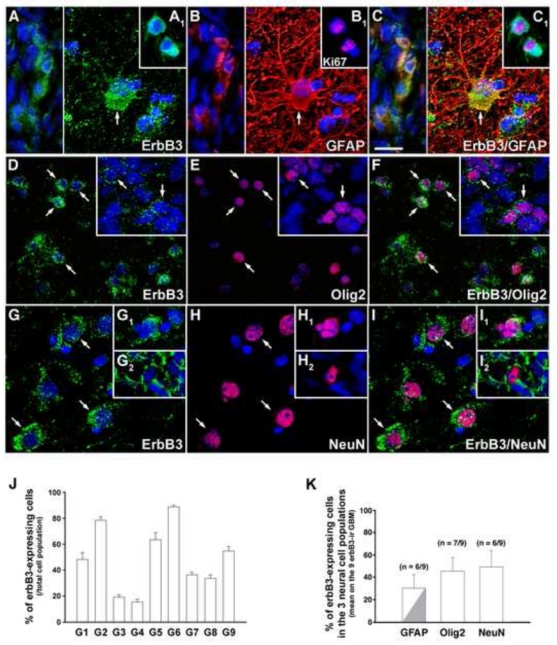
In the glioblastomas, erbB3 is expressed in significant fractions of the GFAP-, Olig2- and NeuN-positive cell populations. (A–I) Double immunofluorescent labeling of erbB3 (green) with GFAP (red), Olig2 (red) or NeuN (red) reveals the presence of erbB3 in GFAP- (A–C, arrow and left panel), Olig2- (D–F, arrows) and NeuN-positive cells (G–I, arrows and insets). (A1–C1) Double immunofluorescent labeling of erbB3 (green) with the proliferation marker Ki67 (red). Note that erbB3 is detected in Olig2- and NeuN-positive cells of various sizes and shapes and is expressed in GFAP-positive cells exhibiting small and irregular morphologies (A–C, left) or an hypertrophic shape reminiscent of reactive astrocytes (A–C, arrow). In tumors, all Ki67-positive cells were also immunoreactive for erbB3 (A1–C1). Nuclei were counter-stained with Hoechst (blue). Scale bar = 20 μm. (J) Quantification of erbB3 expression in the nine glioblastoma samples. Results are expressed as the % number of erbB3-immunoreactive cells over the total number of Hoechst-positive nuclei. Vertical bars represent SEM. (K) Quantification of erbB3 expression in GFAP-, Olig2- and NeuN-positive cell populations (see materials and methods). Bar graph represents the mean % of erbB3-immunoreactive cells on the nine erbB3-immunoreactive (ir) glioblastomas (GBM) in each cell type. A fraction of the erbB3/GFAP co-expressing cell population corresponded to hypertrophic reactive astrocytes (grey). Vertical bars represent SEM.
Figure 7.

ErbB4 immunoreactivity is preferentially distributed in neuronal-like elements in the glioblastomas and is also occasionally detected in hypertrophic astrocytes. (A–F) Double immunofluorescent labeling of erbB4 (green) with GFAP (red) or NeuN (red). ErbB4 immunoreactivity mainly appeared as a bright punctuated staining of fine cell processes (A–C, arrowheads). Rare erbB4/NeuN co-expressing cells were detected in some tumors (D–F, inset). An atypical immunostaining profile consisting of numerous erbB4-weakly immunoreactive cell processes deprived of the usual punctuated aspect (D–F, main panel, arrows) was seen in a glioblastoma in association with abnormal NeuN-positive nuclei. ErbB4 immunoreactivity was occasionally detected in GFAP-positive hypertrophic astrocytes (A–C, arrows). Note that the erbB4 immunolabeling did not exhibit a punctuate aspect in GFAP-positive soma and cell processes. Nuclei were counter-stained with Hoechst (blue). Scale bar = 20 μm. (G) Quantification of erbB4 expression in GFAP-, Olig2- and NeuN-positive cell populations (see materials and methods). Bar graph represents the mean % of erbB4-immunoreactive cells on the eight erbB4-immunoreactive (ir) glioblastomas (GBM) in each cell type. Note that although all erbB4-expressing tumors contained erbB4-immunoreactive cell processes, only 3/8 exhibited erbB4/NeuN co-expressing soma. ErbB4/GFAP-positive elements only consisted of hypertrophic astrocytes (grey). Vertical bars represent SEM.
ErbB1
ErbB1-immunoreactive cells were seen in all tumors at highly variable densities both between (Fig. 4G) and within tumors. ErbB1-positive cells were distributed as scattered isolated cells (Fig. 4A) or as dense clusters of various sizes (Fig. 4D). Consistent with the western blot analysis, the strongest immunoreactivity for erbB1 was seen in two samples, G1 and G6, which presented an intense staining of most cells (Fig. 4G). ErbB1 was expressed in significant fractions of the GFAP- (Fig. 4A–C, H) and Olig-2-positive cell compartments (Fig. 4D–F, H) in 9/9 and 8/9 tumors, respectively. In contrast, co-immunolabeling of erbB1 and NeuN was seen in only two samples and was restricted to a small fraction of the NeuN-positive cell population (Fig. 4H).
ErbB2
ErbB2 immunoreactivity was detected in all tumoral samples in variable proportions of cells between tumors (Fig. 5A, D, G, J). Co-localization of erbB2 with GFAP (Fig. 5A–C), Olig2 (Fig. 5D–F) and NeuN (Fig. 5G–I) was seen in 6/9, 4/9 and 1/9 glioblastomas, respectively, and was globally limited to small populations of cells (Fig. 5K). As for erbB1, erbB2 was preferentially co-expressed with GFAP and Olig2 across the glioblastomas cohort (n = 7/9 samples). However, erbB2 distribution among the three neural cell types was heterogeneous among the glioma series. Only three samples expressed erbB2 both in GFAP- and Olig2-positive cell populations. None of them expressed erbB2 in all three cell types.
ErbB3
ErbB3 immunoreactivity was detected in all tumoral samples. The majority of tumors exhibited erbB3 immunoreactivity on most to the whole tissue surface in variable proportions of cells (Fig. 6A, D, G, J). Notably, the two samples that expressed ERBB3 mRNA but lacked detectable erbB3 protein by western blot (G5 and G6; Fig. 2A, D) showed a highly heterogeneous density of erbB3-positive cells across the tissue, with large areas devoid of staining. ErbB3 expression was detected in significant fractions of the GFAP- (Fig. 6A–C), Olig2- (Fig. 6D–F) and NeuN-positive cell populations (Fig. 6G–I) in 6/9, 7/9 and 6/9 tumors, respectively (Fig. 6K). ErbB3 immunoreactive cells exhibited heterogeneous sizes and shapes (Fig. 6A–I). ErbB3/GFAP-co-expressing cells corresponded to hypertrophic reactive astrocytes (Fig. 6A–C, right) or to small irregular cells (Fig. 6A–C, left). Consistent with previous reports (41, 42), only few scattered cells were immunoreactive for the proliferation marker Ki67 in tumors. Noticeably, all Ki67-positive cells also expressed erbB3 (Fig. 6A1–C1).
ErbB4
Consistent with western blot data, erbB4 immunoreactivity was not detected in the G5 sample. In all erbB4-expressing glioblastomas, the staining appeared as a bright punctuated labeling of fine cell processes, as in neuronal elements of the cerebral cortex (Fig. 7A–C, arrowheads), but the density of immunoreactive cell processes was highly variable across the glioblastoma cohort. Rare erbB4/NeuN co-expressing cell bodies were seen in three tumors (Fig. 7D–F inset, G). A glioblastoma (G4) exhibited an atypical expression profile with areas presenting a dense network of erbB4-immunoreactive cell processes devoid of the usual punctuated aspect, associated with numerous NeuN-positive nuclei of heterogeneous sizes and shapes (Fig. 7D–F, main panel). ErbB4 immunoreactivity was also detected in small subsets of GFAP-positive hypertrophic astrocytes in 3/8 tumors (Fig. 7A–C, G). We never saw any erbB4 immunoreactivity in Olig2-positive cells (Fig. 7G).
ErbB1, erbB2 and erbB3, but not erbB4, were also detected in endothelial cells in 5/9, 6/9 and 7/9 tumors, respectively. Most tumors (6/9) contained both erbB-positive and erbB-negative blood vessels (data not shown).
Altogether, our results show that erbB1 and erbB2 are preferentially detected in the GFAP- and Olig2-positive cell populations in glioblastoma, albeit with different distribution profiles across the cohort. ErbB3 is expressed in significant fractions of the GFAP-, Olig2- and NeuN-positive cell contingents while erbB4 mainly exhibits a “neuronal-type” expression profile. Both neuregulin receptors are occasionally seen in small subsets of hypertrophic astrocytes.
Glioblastoma cell lines
The U251 and U373 cell lines exhibited a strong GFAP immunolabeling in most cells (Supplementary Fig. 3). Surprisingly, we did not detect any GFAP expression in the T98G cell line (Supplementary Fig. 3). None of the three cell lines exhibited Olig2, NeuN and CD133 immunoreactivity. Consistent with the quantitative RT-PCR and western blot analyses, the three cell lines showed a strong immunoreactivity for erbB1 (Supplementary Fig. 3), thereby demonstrating their ability to respond to erbB1 ligands.
ErbB1 and erbB3 receptors, but not erbB4 receptors, are expressed in CD133- immunoreactive cells
We performed double immunohistochemical staining of CD133 and erbB1, erbB3 or erbB4 to evaluate the erbB ligands responsiveness of the population of CD133-positive tumoral cells. CD133-immunoreactivity was detected in small populations of cells in 7/9 glioblastomas (Fig. 8B, E, G). Those cells were seen in restricted tumor areas and often appeared as clusters, with some located at the vicinity of blood vessels (Fig. 8B). In all CD133-immunoreactive tumors, erbB3 was detected in most CD133-positive cells (Fig. 8D–F, H). In 6/7 samples, CD133-immunoreactive cells stained positively for erbB1 (Fig. 8A–C), but the extent of erbB1 expression was limited to a small fraction of the CD133-positive cell contingent (Fig. 8H). Expression of erbB4 was never detected in CD133-immunoreactive cells (Fig. 8H). Altogether, these results show that most glioblastomas of our series contain CD133-positive cells able to respond to all erbB ligands. While a limited fraction of the CD133-positive cell population can respond to erbB1 ligands, the vast majority of this cell population can respond to neuregulins. Interestingly, some CD133-expressing cells were also seen in restricted zones of the peritumoral cortical sample, i.e., at the margin of the resected glioma. Noticeably, they were also immunoreactive for erbB3 (data not shown).
Figure 8.

ErbB1 and erbB3 receptors are expressed in subsets of CD133-immunoreactive cells. (A–F) Double immunofluorescent labeling of erbB1 (A, C, green) and erbB3 (D, F, green) with CD133 (red) shows the presence of erbB1 (A–C, arrows) and erbB3 (D–F, arrows) in CD133-positive cells. Some CD133-positive cells were occasionally seen at the vicinity of blood vessels (A–C, asterisk). Nuclei were counter-stained with Hoechst (blue). Scale bar = 20 μm. (G) Quantification of CD133 expression in the nine glioblastoma samples. Results are expressed as the % number of CD133-immunoreactive cells over the total number of Hoechst-positive nuclei in CD133-positive tumoral areas. Vertical bars represent SEM. (H) Quantification of erbB1, erbB3 and erbB4 expression in the CD133-positive cell populations (see materials and methods). Bar graph represents the mean % of erbB-immunoreactive cells in the CD133-positive cell population on the seven CD133-immunoreactive (ir) glioblastomas (GBM). Vertical bars represent SEM.
Discussion
Deregulations of erbB1 signaling are among the most frequent anomalies encountered in glioblastomas, and represent promising targets for molecular therapy. Although other members of the erbB receptor family participate in the complex interplay that defines the outcome of erbB signaling, they have been the subject of fewer studies in glioblastomas. Moreover, the expression of erbB receptors among the main neural cell types present within these tumors has never been explored. Using several methodological approaches, we have shown that most erbB ligands and receptors are deregulated in glioblastomas when compared to control cortices. Each erbB receptor exhibits a distinct distribution profile among the main neural cell types expressed in glioblastomas. In particular, while overall erbB3 expression is down-regulated in tumors, this receptor is prominently expressed in the CD133-positive putative tumor stem cell compartment. This suggests that erbB3 may be important in cancer stem cell biology and may thus represent a new candidate for targeted molecular therapy.
Methodological considerations in the analysis of erbB receptor expression
We used quantitative RT-PCR and western blot analysis to quantify total mRNA and protein levels of erbB receptors in tissue extracts. Variations in erbB receptor expression in tumors compared to control cortices showed an overall positive correlation between mRNA and protein levels. However, some discrepancies occurred while comparing protein expression data obtained by western blot analysis and those obtained by immunohistochemistry. Two glioblastomas contained both erbB3 mRNA and erbB3-immunoreactive cells, while no signal was detected on immunoblots. Since the distribution of erbB3 immunoreactivity was more heterogeneous in these samples than in the others, it is possible that the analysis of different tissue pieces from the same tumor might have resulted in the discrepancy. Our observation that all glioblastoma specimens contained erbB1- and erbB2-immunoreactive cells, while control cortical tissues lacked detectable erbB1 and erbB2 immunoreactivity suggests that both receptors are overexpressed in glioblastomas. However, immunoblotting experiments using the same antibodies as those used for immunohistochemistry, as well as a battery of other antibodies to erbB1 and erbB2, showed that most tumors expressed levels of erbB1 and/or erbB2 protein similar to or lower than those in control tissues. This observation suggests that increased immunoreactivity is not an absolute indicator of protein overexpression. Epitope availability for antibody recognition depends on protein conformation. The dimerization and activation status of erbB receptors influence receptor conformation (43, 44) and hence may modify their antigenicity. Besides the well-documented constitutive activation of the EGFRvIII mutant receptor (45), increased tyrosine phosphorylation of wild-type erbB1 (46), erbB2 (47, 48) and erbB3 receptors (49) has been reported in glioma biopsies and cell lines. Therefore, in the absence of gene amplification, the increased immunoreactivity of glioblastomas for erbB receptors may indicate a higher activation status and/or modified dimerization profile rather than overexpression at the protein level. Interestingly, the vast majority of studies devoted to the analysis of erbB receptor expression in gliomas have used immunohistochemical techniques. Quantitative data are nonetheless available concerning ERBB1 gene amplification, which is detected in ~40% of glioblastomas and leads to increased erbB1 mRNA levels (50). It should be mentioned that, despite the small number of samples analyzed, the overexpression of erbB1 mRNA was detected in 4/9 cases (44%) in our series of glioblastomas. Comparing immunostaining data with the quantitative evaluation of erbB expression levels may be informative when interpreting the molecular profiles of tumors. Indeed, even though high-throughput profiling using microarrays can reveal molecular signatures, it may fail to reveal highly immunoreactive tumors that exhibit hyper-active erbB signaling, because of low expression levels.
The expression of erbB receptors and ligands is deregulated in glioblastomas
All glioblastoma samples exhibited a deregulation of the different molecular components of the erbB signaling pathway, when compared to control cortices. Quantitative RT-PCR experiments revealed substantial heterogeneity in the deregulation profiles of erbB ligand mRNAs between samples. Current data regarding EGF ligand expression in gliomas are scattered and sparse, with most studies focusing on receptors. However, the development of autocrine/paracrine loops through the combined overexpression of erbB receptors and ligands is a mechanism commonly used by tumoral cells to promote cancer growth. Several human glioma cell lines are known to display TGFα/erbB1- or HB-EGF/erbB1-driven autocrine loops with a growth-promoting action that can be inhibited by neutralizing antibodies directed against the ligands (51–53). In our series of glioblastomas, all samples exhibiting an up-regulation of erbB1 mRNA levels also showed an increased expression of one or several erbB1 ligands, thereby demonstrating the molecular components that allow for the establishment of a growth-promoting autocrine/paracrine loop. The determination of both EGF ligand and receptor repertoires may thus help to identify gliomas that use erbB trophic loops to enhance their tumorigenicity.
The erbB receptor expression profile was highly heterogeneous in glioblastomas, ranging from a marked underexpression to a marked overexpression when compared to control tissues, depending on the receptor and the tumor sample. Immunohistochemistry also revealed great variability both in the percentage of erbB-immunoreactive cells between samples and in the intra-tissue distribution of erbB immunoreactivity. The detection of the four erbB receptors in glioblastomas with highly variable expression levels between samples is in agreement with previous studies (5, 10, 11, 54–57). Despite this heterogeneity, our series of tumors revealed certain preferential phenotypic profiles among erbB-expressing cells. Both erbB1 and erbB2 were preferentially expressed in GFAP- and Olig2-positive cells, while co-expression with NeuN was rarely seen. Although erbB1 was detected in both the GFAP- and Olig2-immunoreactive compartments in the majority of tumors, the distribution of erbB2 varied between these two cell types and did not exhibit any preferential profile. Thus, even though the mRNA and protein levels of erbB1 and erbB2 were positively correlated overall in our glioblastoma panel, such a correlation was not seen in their cellular distribution. ErbB3 immunoreactivity was detected in significant fractions of the GFAP-, Olig2- and NeuN-positive populations across the cohort of glioblastomas. Interestingly, while erbB3 was expressed in the three cell types in each control cerebral cortex, erbB3 distribution pattern was restricted to one or two neural cell categories in most tumors. Moreover, the extent of erbB3 expression among these neural cell types was more limited in tumors than in control samples. It should be noted that GFAP and Olig2 are not only expressed in mature glial cells but also in neural stem cells/progenitors (58, 59), and GFAP- and Olig2-positive cells may hence also correspond to undifferentiated cells within tumors. Importantly, since GFAP, Olig2 and NeuN are expressed both in the normal CNS and in tumoral cells, labeling with these markers does not allow tumoral elements to be distinguished from non-neoplastic indigenous brain cells trapped within primary tumors. Noticeably, some erbB3/GFAP co-expressing cells corresponded to hypertrophic reactive astrocytes, i.e., non-tumoral cells. However, erbB1, erbB2 and erbB3 immunoreactivity was mostly detected in GFAP-, Olig2- and/or NeuN-positive cells with abnormal sizes and shapes, and erbB immunoreactivity was also detected in Ki67-positive cells, arguing for their tumoral nature. Thus, the primary expression of erbB1, erbB2 and erbB3 receptors in non-neoplastic elements trapped within primary tumors appears unlikely. In contrast, the staining pattern of erbB4 in glioblastomas mainly resembled that observed in neurons of the normal cortex. In addition, erbB4 immunoreactivity was seen in subsets of hypertrophic reactive astrocytes within some tumors, as already reported by others (11). Therefore, our observations suggest that, in most cases, erbB4 may not be expressed by tumoral elements and may not play a prominent role in the biology of glioblastoma cells.
Although erbB1, erbB2 and most EGF ligands were detected in the three human glioblastoma cell lines, as in primary tumors, there appeared to be some discrepancy between cell lines and tumor biopsies in the expression profile of erbB receptors and ligands. In particular, while erbB3 and erbB4 were expressed in most primary tumors, these receptors were not detected in glioblastoma cell lines, as previously described by others (10). In contrast to primary tumors that contain heterogeneous populations of cells, glioblastoma cell lines represent a homogeneous population of tumoral cells. We failed to detect Olig2, NeuN and CD133 in the three glioblastoma cell lines examined, possibly due to our culture conditions. Thus, glioblastoma cell lines did not recapitulate the heterogeneous phenotypic profile seen in primary tumors. The absence of these different tumoral subpopulations in our culture conditions may explain the lack of erbB3 expression in cell lines, a possibility that will require further exploration. Noticeably, immunostaining of erbB3 in primary tumors showed that all erbB3-immunoreactive specimens contained both erbB3-positive and erbB3-negative tumoral cell populations, raising the possibility that erbB3-negative cell lines may be derived from these tumors. Interestingly, our observation that erbB4 immunoreactivity in tumor biopsies was mostly seen in non-tumoral elements is in agreement with the lack of erbB4 expression in the glioblastoma cell lines.
Expression of erbB receptors in the CD133-positive cell population
Our results show that CD133-positive cells express specific members of the erbB receptor family. While erbB4 was never detected in this population, erbB1 and erbB3 were found to be expressed in subsets of CD133-positive cells. ErbB1 plays key roles in the control of the proliferation, differentiation, survival and migration of neural stem cells and progenitors within the normal CNS (16). Recent studies have shown that tumor-initiating cells isolated from human glioblastomas express erbB1 in vitro and require the activation of erbB1 signaling for self-renewal and proliferation (60, 61). These studies have also demonstrated that several erbB1 kinase inhibitors (AG1478, gefitinib, erlotinib) inhibit proliferation and induce apoptosis in cancer stem cells in vitro. The present study indicates that erbB1/CD133 co-expressing cells are indeed present in glioblastomas in vivo. However, these cells were not detected in all tumors, and, when present, represented only a small fraction of the CD133-positive population, suggesting that inhibitors of erbB1 signaling only target a limited number of cancer stem cells in vivo. On the other hand, the expression of erbB3, and hence the ability to respond to neuregulins, occurred in the vast majority of CD133-positive cells in all CD133-immunoreactive glioblastomas. It is worth noting that the population of CD133-immunoreactive cells only accounted for 7.2 ± 1.8 % of the total cell population, located within discrete areas of the tumors. Therefore, the erbB3 protein content of the CD133-positive cell population may not have had a significant impact on the global erbB3 protein content of large tissue pieces, thus explaining why erbB3 was underexpressed in glioblastomas as a whole when compared to control cortices, despite its prominent expression in the CD133-positive cell fraction. Although NRG1 has been shown to promote the proliferation and survival of neural stem cells/progenitors (62), the consequences of the activation of neuregulin/erbB3 signaling in cancer stem cells remain to be explored. Interestingly, we saw CD133/erbB3 co-expressing cells in areas of the peritumoral cortical sample corresponding to the margin of the resected glioma. The observation of CD133-positive cells in the macroscopically non-neoplastic peritumoral cortex raises the possibility that these tumoral cells migrate to give birth to tumor recurrences. Whether erbB3 signaling may be involved in the migratory properties of these putative cancer stem cells is yet to be elucidated.
Even though inhibitors of erbB1 and erbB2 signaling have significantly improved the survival of patients with several types of cancers, their efficacy in gliomas remains limited (63). Studies conducted on breast, gastric cancer and glioma cell lines have shown that tumoral cells escape the pro-apoptotic and anti-proliferative effects of inhibitors of erbB1 and erbB2 signaling by the activation of the erbB3/PI3K/Akt pathway (64–66). Efficient recovery of the pro-apoptotic effect is observed upon siRNA-mediated gene knock-down of erbB3 expression (66). These data, along with our present visualization of erbB3 immunoreactivity in most glioblastoma cell types and particularly in the CD133-positive population, suggest that it may be important to assess erbB3 expression in glioblastomas, and that targeting this receptor, in association with other molecules, may be a therapeutic strategy of interest.
In conclusion, the present study provides the first assessment of erbB expression in the main neural cell types present in glioblastomas, particularly in CD133-positive putative tumoral stem cells. While the determination of global mRNA and protein content may be useful in defining molecular signatures, the identification of the nature of erbB-expressing cells within tumors could provide insights into the possible involvement of erbB receptors in the biology of glioblastomas and yield valuable information for the development of therapeutic strategies.
Supplementary Material
Acknowledgments
This research was supported by Inserm Grants U816 (VP) and U837 (VP), the University of Lille 2 (VP), the Institut National du Cancer (INCa) (VP), the Agence National pour la Recherche (ANR, France) (VP), the Fondation pour la Recherche Médicale (Equipe FRM, France) (VP), a PHRC (SB; MB), and the Imaging Core of IFR114 (VP). AS was a postdoctoral fellow supported by the Région Nord Pas de Calais and the FRM.
We thank Dr. H. Chneiweiss (Inserm U894, University of Paris 5, Hospital Sainte-Anne, Department of Anatomopathology, Paris, France) for his generous gift of the anti-Olig2 antibody and Florian Gillet for technical help. We thank Dr. D. Joubert for fruitful collaboration through a INCa (Institut National du Cancer) project. We are grateful to Dr. M-P. Junier and Dr. J-C. Beauvillain for careful reading of the manuscript.
Abbreviations and Acronyms
- ADAM
a disintegrin and metalloproteinase
- AREG
amphiregulin
- BTC
betacellulin
- CNS
central nervous system
- Ct
cycle threshold
- EGF
epidermal growth factor
- EPGN
epigen
- EREG
epiregulin
- GFAP
glial fibrillary acidic protein
- GBM
glioblastoma
- HB-EGF
heparin-binding EGF
- IHC
immunohistochemistry
- MMP
matrix metalloproteinase
- NFP
neurofilament protein
- NRG
neuregulins
- RT-PCR
reverse transcriptase-polymerase chain reaction
- TBP
TATA box binding protein
- TGFA
transforming growth factor-α
- WHO
World Health Organization
References
- 1.Wen PY, Kesari S. Malignant gliomas in adults. N Engl J Med. 2008;359:492–507. doi: 10.1056/NEJMra0708126. [DOI] [PubMed] [Google Scholar]
- 2.Nicholas MK, Lukas RV, Jafri NF, et al. Epidermal growth factor receptor - mediated signal transduction in the development and therapy of gliomas. Clin Cancer Res. 2006;12:7261–7270. doi: 10.1158/1078-0432.CCR-06-0874. [DOI] [PubMed] [Google Scholar]
- 3.Bernstein JJ, Anagnostopoulos AV, Hattwick EA, et al. Human-specific c-neu proto-oncogene protein overexpression in human malignant astrocytomas before and after xenografting. J Neurosurg. 1993;78:240–251. doi: 10.3171/jns.1993.78.2.0240. [DOI] [PubMed] [Google Scholar]
- 4.Dietzmann K, von Bossanyi P. Coexpression of epidermal growth factor receptor protein and c-erbB-2 oncoprotein in human astrocytic tumors. An immunohistochemical study. Zentralbl Pathol. 1994;140:335–341. [PubMed] [Google Scholar]
- 5.Schlegel J, Stumm G, Brandle K, et al. Amplification and differential expression of members of the erbB-gene family in human glioblastoma. J Neurooncol. 1994;22:201–207. doi: 10.1007/BF01052920. [DOI] [PubMed] [Google Scholar]
- 6.Schwechheimer K, Laufle RM, Schmahl W, et al. Expression of neu/c-erbB-2 in human brain tumors. Hum Pathol. 1994;25:772–780. doi: 10.1016/0046-8177(94)90246-1. [DOI] [PubMed] [Google Scholar]
- 7.Koka V, Potti A, Forseen SE, et al. Role of Her-2/neu overexpression and clinical determinants of early mortality in glioblastoma multiforme. Am J Clin Oncol. 2003;26:332–335. doi: 10.1097/01.COC.0000020922.66984.E7. [DOI] [PubMed] [Google Scholar]
- 8.Potti A, Forseen SE, Koka VK, et al. Determination of HER-2/neu overexpression and clinical predictors of survival in a cohort of 347 patients with primary malignant brain tumors. Cancer Invest. 2004;22:537–544. doi: 10.1081/cnv-200026523. [DOI] [PubMed] [Google Scholar]
- 9.Mineo JF, Bordron A, Baroncini M, et al. Low HER2-expressing glioblastomas are more often secondary to anaplastic transformation of low-grade glioma. J Neurooncol. 2007;85:281–287. doi: 10.1007/s11060-007-9424-1. [DOI] [PubMed] [Google Scholar]
- 10.Andersson U, Guo D, Malmer B, et al. Epidermal growth factor receptor family (EGFR, ErbB2–4) in gliomas and meningiomas. Acta Neuropathol. 2004;108:135–142. doi: 10.1007/s00401-004-0875-6. [DOI] [PubMed] [Google Scholar]
- 11.Torp SH, Gulati S, Johannessen E, et al. Coexpression of c-erbB 1–4 receptor proteins in human glioblastomas. An immunohistochemical study. J Exp Clin Cancer Res. 2007;26:353–359. [PubMed] [Google Scholar]
- 12.Riese DJ, Kim ED, Elenius K, et al. The epidermal growth factor receptor couples transforming growth factor-alpha, heparin-binding epidermal growth factor-like factor, and amphiregulin to Neu, ErbB-3, and ErbB-4. J Biol Chem. 1996;271:20047–20052. doi: 10.1074/jbc.271.33.20047. [DOI] [PubMed] [Google Scholar]
- 13.Lenferink AE, Pinkas-Kramarski R, van de Poll ML, et al. Differential endocytic routing of homo- and hetero-dimeric ErbB tyrosine kinases confers signaling superiority to receptor heterodimers. Embo J. 1998;17:3385–3397. doi: 10.1093/emboj/17.12.3385. [DOI] [PMC free article] [PubMed] [Google Scholar]
- 14.Ma YJ, Hill DF, Creswick KE, et al. Neuregulins signaling via a glial erbB-2-erbB-4 receptor complex contribute to the neuroendocrine control of mammalian sexual development. J Neurosci. 1999;19:9913–9927. doi: 10.1523/JNEUROSCI.19-22-09913.1999. [DOI] [PMC free article] [PubMed] [Google Scholar]
- 15.Sharif A, Duhem-Tonnelle V, Allet C, et al. Differential erbB signaling in astrocytes from the cerebral cortex and the hypothalamus of the human brain. Glia. 2009;57:362–379. doi: 10.1002/glia.20762. [DOI] [PubMed] [Google Scholar]
- 16.Wong RW, Guillaud L. The role of epidermal growth factor and its receptors in mammalian CNS. Cytokine Growth Factor Rev. 2004;15:147–156. doi: 10.1016/j.cytogfr.2004.01.004. [DOI] [PubMed] [Google Scholar]
- 17.Junier MP. What role(s) for TGFalpha in the central nervous system? Prog Neurobiol. 2000;62:443–473. doi: 10.1016/s0301-0082(00)00017-4. [DOI] [PubMed] [Google Scholar]
- 18.Buonanno A, Fischbach GD. Neuregulin and ErbB receptor signaling pathways in the nervous system. Curr Opin Neurobiol. 2001;11:287–296. doi: 10.1016/s0959-4388(00)00210-5. [DOI] [PubMed] [Google Scholar]
- 19.Sun Y, Goderie SK, Temple S. Asymmetric distribution of EGFR receptor during mitosis generates diverse CNS progenitor cells. Neuron. 2005;45:873–886. doi: 10.1016/j.neuron.2005.01.045. [DOI] [PubMed] [Google Scholar]
- 20.Ohnishi A, Sawa H, Tsuda M, et al. Expression of the oligodendroglial lineage-associated markers Olig1 and Olig2 in different types of human gliomas. J Neuropathol Exp Neurol. 2003;62:1052–1059. doi: 10.1093/jnen/62.10.1052. [DOI] [PubMed] [Google Scholar]
- 21.Yokoo H, Nobusawa S, Takebayashi H, et al. Anti-human Olig2 antibody as a useful immunohistochemical marker of normal oligodendrocytes and gliomas. Am J Pathol. 2004;164:1717–1725. doi: 10.1016/S0002-9440(10)63730-3. [DOI] [PMC free article] [PubMed] [Google Scholar]
- 22.Ligon KL, Alberta JA, Kho AT, et al. The oligodendroglial lineage marker OLIG2 is universally expressed in diffuse gliomas. J Neuropathol Exp Neurol. 2004;63:499–509. doi: 10.1093/jnen/63.5.499. [DOI] [PubMed] [Google Scholar]
- 23.Mokhtari K, Paris S, Aguirre-Cruz L, et al. Olig2 expression, GFAP, p53 and 1p loss analysis contribute to glioma subclassification. Neuropathol Appl Neurobiol. 2005;31:62–69. doi: 10.1111/j.1365-2990.2004.00612.x. [DOI] [PubMed] [Google Scholar]
- 24.Franke FE, Schachenmayr W, Osborn M, et al. Unexpected immunoreactivities of intermediate filament antibodies in human brain and brain tumors. Am J Pathol. 1991;139:67–79. [PMC free article] [PubMed] [Google Scholar]
- 25.Wharton SB, Chan KK, Whittle IR. Microtubule-associated protein 2 (MAP-2) is expressed in low and high grade diffuse astrocytomas. J Clin Neurosci. 2002;9:165–169. doi: 10.1054/jocn.2001.1055. [DOI] [PubMed] [Google Scholar]
- 26.Varlet P, Soni D, Miquel C, et al. New variants of malignant glioneuronal tumors: a clinicopathological study of 40 cases. Neurosurgery. 2004;55:1377–1391. doi: 10.1227/01.neu.0000143033.36582.40. discussion 1391–1372. [DOI] [PubMed] [Google Scholar]
- 27.Preusser M, Laggner U, Haberler C, et al. Comparative analysis of NeuN immunoreactivity in primary brain tumours: conclusions for rational use in diagnostic histopathology. Histopathology. 2006;48:438–444. doi: 10.1111/j.1365-2559.2006.02359.x. [DOI] [PubMed] [Google Scholar]
- 28.Singh SK, Hawkins C, Clarke ID, et al. Identification of human brain tumour initiating cells. Nature. 2004;432:396–401. doi: 10.1038/nature03128. [DOI] [PubMed] [Google Scholar]
- 29.Salmaggi A, Boiardi A, Gelati M, et al. Glioblastoma-derived tumorospheres identify a population of tumor stem-like cells with angiogenic potential and enhanced multidrug resistance phenotype. Glia. 2006;54:850–860. doi: 10.1002/glia.20414. [DOI] [PubMed] [Google Scholar]
- 30.Bao S, Wu Q, McLendon RE, et al. Glioma stem cells promote radioresistance by preferential activation of the DNA damage response. Nature. 2006;444:756–760. doi: 10.1038/nature05236. [DOI] [PubMed] [Google Scholar]
- 31.Clarke MF. Neurobiology: at the root of brain cancer. Nature. 2004;432:281–282. doi: 10.1038/432281a. [DOI] [PubMed] [Google Scholar]
- 32.Kleihues P, Burger PC, Collins VP, et al. Pathology and genetics of tumours of the nervous system. In: Kleihues P, Cavenee WK, editors. Glioblastoma. Lyon: IARC; 2000. pp. 29–39. [Google Scholar]
- 33.Bieche I, Onody P, Tozlu S, et al. Prognostic value of ERBB family mRNA expression in breast carcinomas. Int J Cancer. 2003;106:758–765. doi: 10.1002/ijc.11273. [DOI] [PubMed] [Google Scholar]
- 34.Baroncini M, Allet C, Leroy D, et al. Morphological evidence for direct interaction between gonadotrophin-releasing hormone neurones and astroglial cells in the human hypothalamus. J Neuroendocrinol. 2007;19:691–702. doi: 10.1111/j.1365-2826.2007.01576.x. [DOI] [PubMed] [Google Scholar]
- 35.Sharif A, Prevot V, Renault-Mihara F, et al. Transforming growth factor alpha acts as a gliatrophin for mouse and human astrocytes. Oncogene. 2006;25:4076–4085. doi: 10.1038/sj.onc.1209443. [DOI] [PubMed] [Google Scholar]
- 36.Sharif A, Legendre P, Prevot V, et al. Transforming growth factor alpha promotes sequential conversion of mature astrocytes into neural progenitors and stem cells. Oncogene. 2007;26:2695–2706. doi: 10.1038/sj.onc.1210071. [DOI] [PubMed] [Google Scholar]
- 37.Romijn HJ, van Uum JF, Breedijk I, et al. Double immunolabeling of neuropeptides in the human hypothalamus as analyzed by confocal laser scanning fluorescence microscopy. J Histochem Cytochem. 1999;47:229–236. doi: 10.1177/002215549904700211. [DOI] [PubMed] [Google Scholar]
- 38.Sanderson MP, Dempsey PJ, Dunbar AJ. Control of ErbB signaling through metalloprotease mediated ectodomain shedding of EGF-like factors. Growth Factors. 2006;24:121–136. doi: 10.1080/08977190600634373. [DOI] [PubMed] [Google Scholar]
- 39.Lu SY, Sontag DP, Detillieux KA, et al. FGF-16 is released from neonatal cardiac myocytes and alters growth-related signaling: a possible role in postnatal development. Am J Physiol Cell Physiol. 2008;294:C1242–1249. doi: 10.1152/ajpcell.00529.2007. [DOI] [PMC free article] [PubMed] [Google Scholar]
- 40.Ozen M, Ittmann M. Increased expression and activity of CDC25C phosphatase and an alternatively spliced variant in prostate cancer. Clin Cancer Res. 2005;11:4701–4706. doi: 10.1158/1078-0432.CCR-04-2551. [DOI] [PubMed] [Google Scholar]
- 41.Kleihues P, Soylemezoglu F, Schauble B, et al. Histopathology, classification, and grading of gliomas. Glia. 1995;15:211–221. doi: 10.1002/glia.440150303. [DOI] [PubMed] [Google Scholar]
- 42.Abrey LE, Mason WP. Brain Tumors. Health Press; (UK): 2003. [Google Scholar]
- 43.Schlessinger J. Ligand-induced, receptor-mediated dimerization and activation of EGF receptor. Cell. 2002;110:669–672. doi: 10.1016/s0092-8674(02)00966-2. [DOI] [PubMed] [Google Scholar]
- 44.Citri A, Skaria KB, Yarden Y. The deaf and the dumb: the biology of ErbB-2 and ErbB-3. Exp Cell Res. 2003;284:54–65. doi: 10.1016/s0014-4827(02)00101-5. [DOI] [PubMed] [Google Scholar]
- 45.Huang HS, Nagane M, Klingbeil CK, et al. The enhanced tumorigenic activity of a mutant epidermal growth factor receptor common in human cancers is mediated by threshold levels of constitutive tyrosine phosphorylation and unattenuated signaling. J Biol Chem. 1997;272:2927–2935. doi: 10.1074/jbc.272.5.2927. [DOI] [PubMed] [Google Scholar]
- 46.Thomas CY, Chouinard M, Cox M, et al. Spontaneous activation and signaling by overexpressed epidermal growth factor receptors in glioblastoma cells. Int J Cancer. 2003;104:19–27. doi: 10.1002/ijc.10880. [DOI] [PubMed] [Google Scholar]
- 47.Kristt DA, Yarden Y. Differences between phosphotyrosine accumulation and Neu/ErbB-2 receptor expression in astrocytic proliferative processes. Implications for glial oncogenesis. Cancer. 1996;78:1272–1283. doi: 10.1002/(SICI)1097-0142(19960915)78:6<1272::AID-CNCR16>3.0.CO;2-Y. [DOI] [PubMed] [Google Scholar]
- 48.Wickremesekera A, Hovens CM, Kaye AH. Expression of ErbB-1 and 2 in vestibular schwannomas. J Clin Neurosci. 2007;14:1199–1206. doi: 10.1016/j.jocn.2007.05.009. [DOI] [PubMed] [Google Scholar]
- 49.Ritch PS, Carroll SL, Sontheimer H. Neuregulin-1 enhances survival of human astrocytic glioma cells. Glia. 2005;51:217–228. doi: 10.1002/glia.20197. [DOI] [PMC free article] [PubMed] [Google Scholar]
- 50.Arjona D, Bello MJ, Alonso ME, et al. Molecular analysis of the EGFR gene in astrocytic gliomas: mRNA expression, quantitative-PCR analysis of non-homogeneous gene amplification and DNA sequence alterations. Neuropathol Appl Neurobiol. 2005;31:384–394. doi: 10.1111/j.1365-2990.2005.00653.x. [DOI] [PubMed] [Google Scholar]
- 51.Tang P, Steck PA, Yung WK. The autocrine loop of TGF-alpha/EGFR and brain tumors. J Neurooncol. 1997;35:303–314. doi: 10.1023/a:1005824802617. [DOI] [PubMed] [Google Scholar]
- 52.Mishima K, Higashiyama S, Asai A, et al. Heparin-binding epidermal growth factor-like growth factor stimulates mitogenic signaling and is highly expressed in human malignant gliomas. Acta Neuropathol. 1998;96:322–328. doi: 10.1007/s004010050901. [DOI] [PubMed] [Google Scholar]
- 53.Ramnarain DB, Park S, Lee DY, et al. Differential gene expression analysis reveals generation of an autocrine loop by a mutant epidermal growth factor receptor in glioma cells. Cancer Res. 2006;66:867–874. doi: 10.1158/0008-5472.CAN-05-2753. [DOI] [PubMed] [Google Scholar]
- 54.Chaffanet M, Chauvin C, Laine M, et al. EGF receptor amplification and expression in human brain tumours. Eur J Cancer. 1992;28:11–17. doi: 10.1016/0959-8049(92)90374-b. [DOI] [PubMed] [Google Scholar]
- 55.Schlegel J, Merdes A, Stumm G, et al. Amplification of the epidermal-growth-factor-receptor gene correlates with different growth behaviour in human glioblastoma. Int J Cancer. 1994;56:72–77. doi: 10.1002/ijc.2910560114. [DOI] [PubMed] [Google Scholar]
- 56.Etienne MC, Formento JL, Lebrun-Frenay C, et al. Epidermal growth factor receptor and labeling index are independent prognostic factors in glial tumor outcome. Clin Cancer Res. 1998;4:2383–2390. [PubMed] [Google Scholar]
- 57.Feldkamp MM, Lala P, Lau N, et al. Expression of activated epidermal growth factor receptors, Ras-guanosine triphosphate, and mitogen-activated protein kinase in human glioblastoma multiforme specimens. Neurosurgery. 1999;45:1442–1453. doi: 10.1097/00006123-199912000-00034. [DOI] [PubMed] [Google Scholar]
- 58.Doetsch F. The glial identity of neural stem cells. Nat Neurosci. 2003;6:1127–1134. doi: 10.1038/nn1144. [DOI] [PubMed] [Google Scholar]
- 59.Kriegstein AR, Gotz M. Radial glia diversity: a matter of cell fate. Glia. 2003;43:37–43. doi: 10.1002/glia.10250. [DOI] [PubMed] [Google Scholar]
- 60.Soeda A, Inagaki A, Oka N, et al. Epidermal growth factor plays a crucial role in mitogenic regulation of human brain tumor stem cells. J Biol Chem. 2008;283:10958–10966. doi: 10.1074/jbc.M704205200. [DOI] [PubMed] [Google Scholar]
- 61.Griffero F, Daga A, Marubbi D, et al. Different Response of Human Glioma Tumor-initiating Cells to Epidermal Growth Factor Receptor Kinase Inhibitors. J Biol Chem. 2009;284:7138–7148. doi: 10.1074/jbc.M807111200. [DOI] [PMC free article] [PubMed] [Google Scholar]
- 62.Calaora V, Rogister B, Bismuth K, et al. Neuregulin signaling regulates neural precursor growth and the generation of oligodendrocytes in vitro. J Neurosci. 2001;21:4740–4751. doi: 10.1523/JNEUROSCI.21-13-04740.2001. [DOI] [PMC free article] [PubMed] [Google Scholar]
- 63.Mischel PS, Cloughesy TF. Targeted molecular therapy of GBM. Brain Pathol. 2003;13:52–61. doi: 10.1111/j.1750-3639.2003.tb00006.x. [DOI] [PMC free article] [PubMed] [Google Scholar]
- 64.Motoyama AB, Hynes NE, Lane HA. The efficacy of ErbB receptor-targeted anticancer therapeutics is influenced by the availability of epidermal growth factor-related peptides. Cancer Res. 2002;62:3151–3158. [PubMed] [Google Scholar]
- 65.Contessa JN, Abell A, Mikkelsen RB, et al. Compensatory ErbB3/c-Src signaling enhances carcinoma cell survival to ionizing radiation. Breast Cancer Res Treat. 2006;95:17–27. doi: 10.1007/s10549-005-9023-9. [DOI] [PubMed] [Google Scholar]
- 66.Sergina NV, Rausch M, Wang D, et al. Escape from HER-family tyrosine kinase inhibitor therapy by the kinase-inactive HER3. Nature. 2007;445:437–441. doi: 10.1038/nature05474. [DOI] [PMC free article] [PubMed] [Google Scholar]
- 67.Lind D, Franken S, Kappler J, et al. Characterization of the neuronal marker NeuN as a multiply phosphorylated antigen with discrete subcellular localization. J Neurosci Res. 2005;79:295–302. doi: 10.1002/jnr.20354. [DOI] [PubMed] [Google Scholar]
Associated Data
This section collects any data citations, data availability statements, or supplementary materials included in this article.