

Abstract
The incidence of bovine tuberculosis (BTB) is increasing in Great Britain, exacerbated by the temporary suspension of herd testing in 2001 for fear of spreading the much more contagious foot and mouth disease. The transmission pathways of BTB remain poorly understood. Current hypotheses suggest the disease is introduced into susceptible herds from a wildlife reservoir (principally the Eurasian Badger) and/or from cattle purchased from infected areas, while the role of climatic factors in transmission has generally been ignored. Here, we show how remotely sensed satellite data, which provide good indicators of a variety of climatic factors, can be used to describe the distribution of BTB in Great Britain in 1997, and suggest how such data could be used to produce BTB risk maps for the future.
Bovine tuberculosis (BTB), which is caused by Mycobacterium bovis, was once widespread in Great Britain, but is now focused in south-west England, south-west Wales and parts of the Midlands (Fig. 1). Scattered cases occur throughout the mainland and outbreaks have been reported recently in mid-Wales. The distribution of BTB is routinely monitored by the Department for Environment, Food and Rural Affairs (DEFRA), although a coherent management strategy has yet to be framed within a descriptive model of disease transmission. The development of such models is hampered by the fact that our knowledge of the M. bovis transmission pathways is incomplete. The biology of the host undoubtedly plays a major role in transmission and although the effect of climate on the natural history of the pathogen in the field is largely unknown, it is likely to have a significant influence on the disease [1]. Potential correlations between climatic factors and the occurrence of BTB, which so far have not been investigated extensively, can be obtained at a fairly fine spatial resolution (Box 1) from satellite observations [2,3]. Satellite data have already been used to describe the distribution and abundance of several diseases in many countries worldwide, including malaria [4,5], schistosomiasis [6], trypanosomiasis [7–9], tick-borne diseases [10], West Nile Virus in the USA [11], the vectors of African horse sickness in South Africa [12] and blue tongue in the Mediterranean basin [13]. Given these successes with vector-borne or indirectly transmitted diseases, we assessed the use of the same approach to describe the distribution of BTB in Great Britain, as a potential complement to existing monitoring procedures.
Fig. 1.

Predicted distribution of bovine tuberculosis (BTB) in southwest Great Britain, 1997. The inset shows the recorded presence.
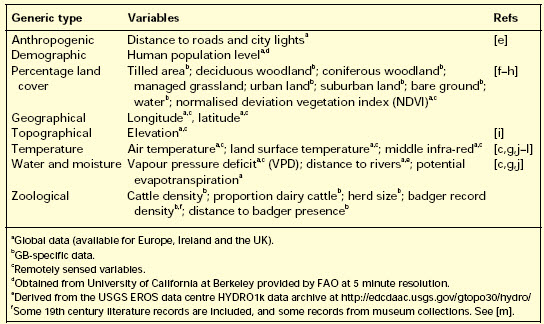
Box 1. Environmental predictor data used in the analyses.
The predictor variables used are summarized in Table I. Remotely sensed data were derived from daily 1 km resolution imagery of the Advanced Very High Resolution Radiometer (AVHRR) on the National Oceanographic and Atmospheric Administration satellite and processed by the Pathfinder program [a,b] to remove cloud and other atmospheric contamination. Data are available only within the period 1992/3–1995/6, and so were combined into monthly averages to provide complete temporal coverage of a nominal calendar year, then further processed to produce variables additional to the original imagery (Table 1) using the algorithms described in [c].
The monthly data were subjected to temporal Fourier processing, known to provide descriptive and explanatory variables associated with distributions of vectors and diseases. These describe the seasonal cycle in terms of sinusoidal annual, bi-annual and tri-annual components, each with an amplitude and phase (i.e. timing of the first peak) [d]. Additional data layers were produced showing the Fourier-fitted (i.e. essentially smoothed) maximum and minimum signal value and the contribution of each of the annual, bi-annual and tri-annual cycles to the overall variance of the seasonal signal.
A variety of land-use and land-cover data were extracted from the Countryside Information System (CIS) CD-ROM. These data record the percentage cover of each land-use class at 1 km resolution. Overall map accuracy is quoted as 80–85%.
Cattle figures for 1999 were obtained aggregated by administrative areas for Scotland and Wales, and by 20 km grid for England. These data had been screened to ensure confidentiality, but were combined to use as an indicative measure of cattle density.
Publicly available badger data are patchy at best. The most complete information, from the CIS, contains 1 km resolution information on distribution from the Mammal Society, the Biological Records Centre and the British Deer Society surveys between 1965 and 1990. Even aggregated to 10 km, these data appear unlikely to provide a very realistic distribution but, in the absence of any alternative, were included in the predictor data set.
Table I. Predictor variables
References
- a.Eidenshink JC, Faundeen JL. The 1km AVHRR global land data set – 1st stages in implementation. Int. J. Remote Sensing. 1994;15:3443–3462. [Google Scholar]
- b.Teillet PM, et al. An evaluation of the global 1-km AVHRR land dataset. Int. J. Remote Sensing. 2000;21:1987–2021. [Google Scholar]
- c.Hay SI, Lennon JJ. Deriving meteorological variables across Africa for the study and control of vector-borne disease: a comparison of remote sensing and spatial interpolation of climate. Trop. Med. Int. Health. 1999;4:58–71. doi: 10.1046/j.1365-3156.1999.00355.x. [DOI] [PMC free article] [PubMed] [Google Scholar]
- d.Rogers DJ. Satellites, space, time and the African trypanosomiases. Adv. Parasitol. 2000;47:129–171. doi: 10.1016/s0065-308x(00)47008-9. [DOI] [PubMed] [Google Scholar]
- e.Dobson JE, et al. Landscan: a global population database for estimating populations at risk. Photogrammetric Engineering and Remote Sensing. 2000;66:849–857. [Google Scholar]
- f.Hay SI. An overview of remote sensing and geodesy for epidemiology and public health application. Adv. Parasitol. 2000;47:1–35. doi: 10.1016/s0065-308x(00)47005-3. [DOI] [PMC free article] [PubMed] [Google Scholar]
- g.Goetz SJ, et al. Advances in satellite remote sensing of environmental variables for epidemiological applications. Adv. Parasitol. 2000;47:289–307. doi: 10.1016/s0065-308x(00)47012-0. [DOI] [PubMed] [Google Scholar]
- h.Myneni RB, et al. Optical remote sensing of vegetation: modeling, caveats, and algorithms. Remote Sensing of Environment. 1995;51:169–188. [Google Scholar]
- i.Gesch DB, Larson KS. Techniques for Development of Global 1-kilometer Digital Elevation Models. United States Geological Survey; 2000. [Google Scholar]
- j.Green RM, Hay SI. The potential of Pathfinder AVHRR data for providing surrogates of climatic variables across Africa and Europe for epidemiological applications. Remote Sensing of Environment. 2002;79:165–175. doi: 10.1016/S0034-4257(01)00270-X. [DOI] [PMC free article] [PubMed] [Google Scholar]
- k.Price JC. Land surface temperature measurements from the split window channels of the NOAA 7 advanced very high resolution radiometer. J. Geophys. Res. 1984;89:7231–7237. [Google Scholar]
- l.Boyd DS, Curran PJ. Using remote sensing to reduce uncertainties in the global carbon budget: the potential of radiation acquired in the middle infrared wavelengths. Remote Sensing Reviews. 1998;16:293–327. [Google Scholar]
- m.Arnold HR. Atlas of Mammals in Britain. HMSO; London: 1993. [Google Scholar]
Data, images and image processing
BTB data were derived from the VETNET database for the period 1988–1997. These are the geo-referenced BTB monitoring data for the whole of mainland Great Britain, covering >80 000 holdings annually, and thus provide a reliable indication of BTB distribution. Analyses were restricted to the presence or absence of the disease within a herd as it proved impossible to estimate incidence or prevalence reliably from the database. Only data for 1997 were used, giving approximately 500 infected sites. Disease data are often spatially clustered, which reduces the statistical significance of distribution models. A subset of the data from the southern Midlands was therefore examined for such spatial autocorrelation, which appeared to be minimal beyond distances of about 2 or 3 km. This suggested that autocorrelation in the BTB data would be reduced by amalgamating the records into spatial units of >3 km, so the data indicating the presence or absence of BTB were aggregated into 5 km grid squares before analysis. A broad range of anthropogenic, biological, demographic, climatic and topographic variables was assessed as predictors (Box 1).
Data extraction and model construction
All predictor data were converted to 0.01 degree resolution and stored in IDRISI (geographical analysis software; http://www.idrisi.clarku.edu) raster images in latitude/longitude format. From each image, data values were extracted for a series of data points corresponding to BTB-positive and BTB-negative locations for 1997. After filtering to remove any records with incomplete data, and then adjusting absence sample sizes to give approximately equal numbers of observations of positive and negative sites, the data were subjected to step-wise forward logistic regression analysis using the Statistical Package for the Social Sciences (SPSS; http://www.spss.com) to establish the relationship between the predictor variables and the presence or absence of disease. Although this method partially compensates for correlations between predictor variables, possible co-linearity means that the precise order in which variables are included in the model should be treated with some caution. The output of logistic regression models, as widely used in distribution studies [14], is a prediction of the probability of presence for each sample site. The threshold probability that most accurately distinguishes presence from absence in logistic regression tends to vary with the relative numbers of presence and absence observations used; with equal sample sizes, a threshold of 0.5 is likely to provide a reasonable balance between minimising the prediction of false negatives and false positives, and is thus appropriate for an exploratory model such as this. The accuracy of the various logistic regression models was assessed using the Kappa index of agreement [15], which ranges from 0 (no predictive skill) to 1 (perfect prediction), with values >0.4 regarded as acceptable and >0.75 as excellent [16].
Once the best models had been determined, they were applied to the full 1 km resolution imagery to produce output maps predicting the probability of BTB presence throughout Great Britain.
Results
Three models of the presence of BTB in Great Britain in 1997 were developed (Table 1). The first used all the GB-specific variables and the satellite variables, elevation data and population distribution data. The acceptable fit of this model (Kappa = 0.68) (Fig. 1) predicts the major observed foci in Wales, the south Midlands, Devon and Cornwall, as well as some of the smaller outbreaks in the north Midlands. There are, however, areas of false positive predictions along the Menai Straits in North Wales and the northern Marches, which might indicate areas that are environmentally suitable for BTB and so ‘potentially at risk’.
Table 1.
Logistic regression summary statistics and first ten predictors for models of BTB in 1997a
| Statistic | Model 1 | Model 2 | Model 3 |
|---|---|---|---|
| Variables included in analysis | All | Only global variables | All |
| Distance to BTB in 1995 | No | No | Yes |
| Variables available to model | 96 | 80 | 97 |
| Variables included in model | 54 | 70 | 85 |
| Correct absence % | 83.67 | 82.05 | 85.00 |
| Correct presence % | 84.76 | 81.11 | 82.80 |
| Overall correct % | 84.15 | 81.64 | 83.90 |
| Kappa | 0.68 | 0.63 | 0.67 |
| Predictor 1 | VPD P2b,d | VPD P2b,d | Distance to BTB in 1995 |
| Predictor 2 | Longitude | Longitude | VPD mind |
| Predictor 3 | VPD D/V1b,d | VPD mean | Cattle density |
| Predictor 4 | VPD P1b,d | VPD P1b,d | Badger presence (10 km) |
| Predictor 5 | Air temperature A1b,c | VPD varianceb,d | Human population density |
| Predictor 6 | Air temperature rangec | Middle infra-red P3b,c | Longitude |
| Predictor 7 | Cattle density | Air temperature A1b,c | Potential evapotranspirationd |
| Predictor 8 | Air temperature A3b,c | Air temperature rangeb,c | VPD P1b,d |
| Predictor 9 | Middle infra-red P3b,c | Distance to roads | Badger (distance) |
| Predictor 10 | VPD meand | Air temperature A3b,c | VPD A3b,d |
Abbreviations: 0, 1, 2 and 3 refer to the Fourier-fitted, annual, bi-annual and tri-annual cycles; A, amplitude; BTB, bovine tuberculosis; D/V, proportion of total variance associated with each harmonic/total variance; P, phase; VPD, vapour pressure deficit.
Fourier timing and/or seasonality variables, highlighted in bold.
Temperature variables.
Water/moisture variables.
The second model was similar to the first, but removed all GB-specific variables – and thus most of the land-use and agricultural data (Box 1) – from the predictor set (leaving essentially only the satellite, elevation and population distribution data), with a view to applying the results to other European countries. The satisfactory predictions (Kappa = 0.63) suggest that reliable models of BTB presence could be constructed using generic data sets for other countries, although we caution that the model parameters will almost certainly differ between broad geographical regions.
The selected key predictors of these first two models (Table 1) suggest that atmospheric dryness [indicated by vapour pressure deficit (VPD)] and thermal (middle infra-red and air temperature) variables, particularly their timing and variability, are associated with areas at high risk of BTB; briefly, the VPD mean values are lower and reach a peak later in the year, and both VPD and air temperature are less variable, in BTB-positive than in BTB-negative areas.
The third model was similar to the first, but also incorporated proximity to BTB presence in 1995 (taken as indicating past risk of infection). This did not improve the fit of the model relative to the first model (Kappa = 0.67), even though it used more of the available variables, but had the important effect of shifting emphasis away from purely climatic variables towards the biotic variables such as cattle, badger and human density. The better fit of the first model suggests that the risk of BTB can be predicted satisfactorily using only intrinsic climatic and environmental variables with no information on previous infections (Table 1, Box 1).
Discussion and conclusions
This preliminary study demonstrates conclusively that environmental data, including Fourier-processed, multi-temporal satellite data, can be used to describe the distribution of BTB in Great Britain with reasonable accuracy. Such predictions could be used to adjust the targeting and intensity of existing conventional monitoring programmes; to estimate distributions (for this and similar diseases) where monitoring is sparse; and could feasibly be developed to track or even predict changes in the distribution of BTB over time.
An important question arising from this study, however, is whether it is the disease, the cattle or the distribution of farmlands highly suited to cattle production (and so perhaps BTB) that is being modelled. The last two suggestions could be ruled out by expressing the BTB data as disease incidence or prevalence, but unfortunately the herd size data were somewhat inconsistent. The available cattle data suggest that the BTB risk map shown here is sufficiently different from the cattle abundance map to confirm that we have captured some independent factor in the risk of BTB. As more data are made available, especially from the period of recent increase in BTB in Great Britain, and with more complete cattle data, it should become easier to model disease prevalence.
Temperature- and moisture-related climatic indicators, especially their timing and variability, appear to be more important predictors of BTB in England and Wales than do variables related to vegetation or land-use. The occurrence of BTB is therefore likely to be closely linked to the seasonality and sequence of ecological events during the year, and probably sensitive to changes in this seasonality from one year to the next. This aspect of epizootiology is rarely incorporated into statistical models of disease distribution and points to the type of process-based biological model that will be most appropriate for BTB.
Satellite data therefore help us describe the distribution of BTB in Great Britain, to begin to understand the climatic conditions conducive to disease persistence over time, and to predict areas suitable for BTB transmission that are not yet experiencing the disease. The arrival of BTB in a new area by inward movement of infected animals, or from possible reservoir hosts, is almost impossible to anticipate, although routine monitoring should pick up both sorts of events. Nevertheless, after its appearance in any area, its likely persistence and even the intensity of infection can be predicted using the sorts of analyses presented here. The global coverage of such satellite data provides an opportunity for both developed and developing countries to monitor the spread of an increasing variety of diseases through space and time.
Acknowledgements
This exploratory study was funded by DEFRA Research Contract CSA 5800/SE3023: Environmental Correlates of BTB Distribution. We are grateful to Matthew Baylis, Peter Roeder, Jan Slingenbergh and Pete Hudson for their valuable comments and to Andy Mitchell and Miles Templeton for help with the BTB and cattle data they provided. S.I.H. is currently supported as an Advanced Training Fellow by the Wellcome Trust (#056642). S.E.R. is a Natural Environment Research Council (UK) Senior Research Fellow (#341).
Contributor Information
G.R. William Wint, Environmental Research Group Oxford, PO Box 346, Oxford, UK OX1 3QE.
Timothy P. Robinson, United Nations Food and Agriculture Organization, Viale delle Terme di Caracalla, 00100 Rome, Italy
David M. Bourn, Environmental Research Group Oxford, PO Box 346, Oxford, UK OX1 3QE
Peter A. Durr, Dept of Epidemiology, Veterinary Laboratories Agency, Weybridge, Surrey, UK KT15 3NB
Simon I. Hay, Dept of Zoology, University of Oxford, South Parks Road, Oxford, UK OX1 3PS
Sarah E. Randolph, Dept of Zoology, University of Oxford, South Parks Road, Oxford, UK OX1 3PS
David J. Rogers, Dept of Zoology, University of Oxford, South Parks Road, Oxford, UK OX1 3PS
References
- 1.Krebs J, et al. Bovine Tuberculosis in Cattle and Badgers. Report by the Independent Scientific Review Group Ministry of Agriculture, Fisheries and Food. 1997.
- 2.Hay SI, et al. Remotely sensed surrogates of meteorological data for the study of the distribution and abundance of arthropod vectors of disease. Annals Trop. Med. Parasitol. 1996;90:1–19. doi: 10.1080/00034983.1996.11813021. [DOI] [PubMed] [Google Scholar]
- 3.Hay SI. An overview of remote sensing and geodesy for epidemiology and public health application. Adv. Parasitol. 2000;47:1–35. doi: 10.1016/s0065-308x(00)47005-3. [DOI] [PMC free article] [PubMed] [Google Scholar]
- 4.Hay SI, et al. Earth observation, geographic information systems and Plasmodium falciparum malaria in sub-Saharan Africa. Adv. Parasitol. 2000;47:173–215. doi: 10.1016/s0065-308x(00)47009-0. [DOI] [PMC free article] [PubMed] [Google Scholar]
- 5.Rogers DJ, et al. Satellite imagery in the study and forecast of malaria. Nature. 2002;415:710–715. doi: 10.1038/415710a. [DOI] [PMC free article] [PubMed] [Google Scholar]
- 6.Brooker S, et al. Tools from ecology: useful for evaluating infection risk models. Trends Parasitol. 2002;18:70–74. doi: 10.1016/s1471-4922(01)02223-1. [DOI] [PMC free article] [PubMed] [Google Scholar]
- 7.Rogers DJ. Satellites, space, time and the African trypanosomiases. Adv. Parasitol. 2000;47:129–171. doi: 10.1016/s0065-308x(00)47008-9. [DOI] [PubMed] [Google Scholar]
- 8.Robinson T, et al. Mapping tsetse habitat suitability in the common fly belt of Southern Africa using multivariate analysis of climate and remotely sensed vegetation data. Med. Vet. Entomol. 1997;11:235–245. doi: 10.1111/j.1365-2915.1997.tb00401.x. [DOI] [PubMed] [Google Scholar]
- 9.Hendrickx G, et al. The spatial pattern of trypanosomosis prevalence predicted with the aid of satellite imagery. Parasitology. 2000;120:121–134. doi: 10.1017/s0031182099005338. [DOI] [PubMed] [Google Scholar]
- 10.Randolph SE. Ticks and tick-borne disease systems in space and from space. Adv. Parasitol. 2000;47:217–243. doi: 10.1016/s0065-308x(00)47010-7. [DOI] [PubMed] [Google Scholar]
- 11.Rogers DJ, et al. Predicting the distribution of West Nile fever in North America using satellite sensor data. Photogrammetric Engineering and Remote Sensing. 2002;68:112–114. [Google Scholar]
- 12.Baylis M, et al. A preliminary attempt to use climate data and satellite imagery to model the abundance and distribution of Culicoides imicola (Diptera: Ceratopogonidae) in southern Africa. J. South African Vet. Assoc. 1999;70:80–89. doi: 10.4102/jsava.v70i2.759. [DOI] [PubMed] [Google Scholar]
- 13.Baylis M, et al. Prediction of areas around the Mediterranean at risk of blue tongue by modelling the distribution of its vector using satellite imaging. Vet. Rec. 2001;149:639–643. [PubMed] [Google Scholar]
- 14.Manel S, et al. Alternative methods for predicting species distributions: an illustration with Himalayan river birds. J. Appl. Ecol. 1999;36:734–747. [Google Scholar]
- 15.Carstensen LW. A measure of similarity for cellular maps. The American Cartographer. 1987;14:345–358. [Google Scholar]
- 16.Landis JR, Koch GC. The measurement of observer agreement for categorical data. Biometrics. 1977;33:159–174. [PubMed] [Google Scholar]