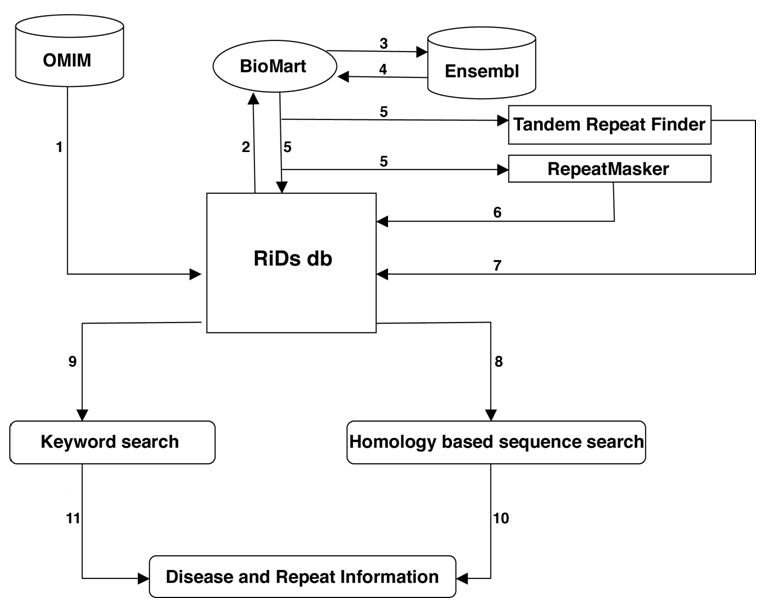
Figure 1.

Data flow diagram: The figure describes the input and output for RiDs db. 1) Disease related information from OMIM db; 2-5) disease gene sequences from Ensembl via BioMart subjected to repeat identification using RepeatMasker and TRF; 6, 7) repeat output in RiDs db; 8, 9) modes of search; 10, 11 result.
