Abstract
Folding of the cerebral cortex is a critical phase of brain development in higher mammals, but the biomechanics of folding remain incompletely understood. During folding, growth of the cortical surface is heterogeneous and anisotropic. We developed and applied a new technique to measure spatial and directional variations in surface growth from longitudinal magnetic resonance imaging (MRI) studies of a single animal or human subject. MRI provides high resolution 3-D image volumes of the brain at different stages of development. Surface representations of the cerebral cortex are obtained by segmentation of these volumes. Estimation of local surface growth between two times requires establishment of a point-to-point correspondence (“registration”) between surfaces measured at those times. Here we present a novel approach for the registration of two surfaces in which an energy function is minimized by solving a partial differential equation on a spherical surface. The energy function includes a strain energy term due to distortion and an “error energy” term due to mismatch between surface features. This algorithm, implemented with the finite element method, brings surface features into approximate alignment while minimizing deformation in regions without explicit matching criteria. The method was validated by application to three simulated test cases and applied to characterize growth of the ferret cortex during folding. Cortical surfaces were created from MRI data acquired in vivo at 14, 21 and 28 days of life. Deformation gradient and Lagrangian strain tensors describe the kinematics of growth over this interval. These quantitative results illuminate the spatial, temporal, and directional patterns of growth during cortical folding.
Keywords: brain development, registration, MRI
Introduction
Abnormal folding of the cerebral cortex is associated with neurological disease and dysfunction [1], but even normal folding is incompletely understood. Quantitative measurements are needed to understand the underlying mechanisms of cortical folding [2]. An essential step is to characterize the kinematics of cortical growth: How does the cortical surface change shape and size? Ideally, fiducial markers could be tracked to measure displacements. However, markers are not readily available in the live, developing brains of animals with a folded cortex. Instead we acquire anatomical MR images at different stages of development, and create surface representations of the cortex at each time point. In order to calculate growth between cortical surface representations at different time points, surfaces must be registered to one another. Many algorithms have been developed for surface registration (e.g., [3–17];). However, these algorithms may introduce artificial distortions from “mis-registration” between corresponding points on the two surfaces. Such artifacts can overwhelm estimates of actual strains due to physical growth.
In this paper we introduce a method to register closed surfaces in 3-D; the method is based on the matching of surface features and the minimization of deformation in regions lacking such features. Our approach follows from ideas presented in Shi et al. [10] and Litke et al. [9], and is aimed specifically at longitudinal studies of cortical development. We denote this method by the acronym LACROSS (LAndmark Correspondence and Relaxation Of Surface Strain). The finite element method is used to find the displacement field that minimizes the sum of a strain energy term (which measures distortion required to deform one surface into another) and an “error energy” term that characterizes the alignment of matching features on cortical surfaces obtained at two different ages.
2. Methods
2.1 Theory
2.1.1 Surfaces
This study is restricted to closed surfaces in three dimensional (3-D) Euclidean space. These surfaces contain no edges, and their topology is equivalent to the topology of a sphere. The proposed method is intended to characterize surfaces created from images acquired at different stages of development, which is reflected in our naming convention for each of the surfaces.
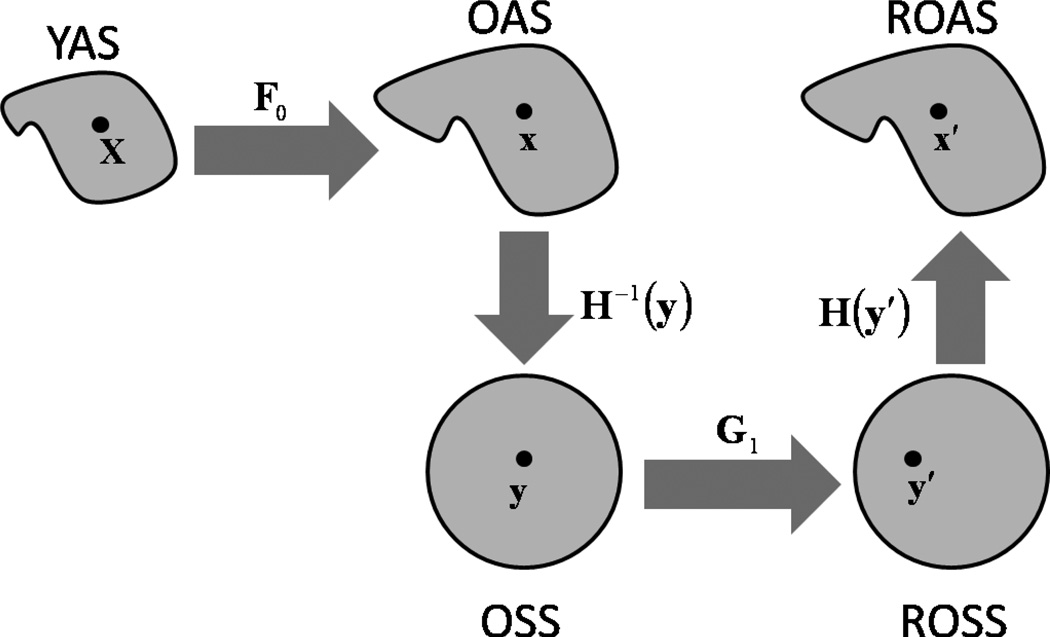
The set of surfaces we consider are shown in Fig. 1. Let YAS be the younger anatomical surface, with coordinates X, and OAS be the older anatomical surface, with coordinates x, where X,x ∈ ℛ3. In the terminology of mechanics, the younger surface corresponds to the “reference” configuration while the older surface corresponds to the “deformed” configuration. Because both YAS and OAS have the topology of a sphere, they can be parameterized to a sphere. We do this using CARET software [15], but many other algorithms exist. Let YSS be the younger spherical surface representation of YAS, with coordinates Y, and let OSS be the older spherical surface representation of OAS, with coordinates y, where Y,y ∈ ℛ3. We assume that a point-to-point correspondence has been established between YAS and OAS but that the initial correspondence is not correct (it does not reflect the true correspondence between material points at the two ages).
Figure 1.
Surfaces and surface relationships. YAS is the younger anatomical surface, OAS is the older anatomical surface, ROAS is the relaxed older anatomical surface, OSS is the older spherical surface and ROSS is the relaxed older spherical surface. F0 is the deformation gradient between OAS and YAS, H is the deformation gradient between OSS and OAS (as well as DOSS and DOAS) and G1 is the deformation gradient between ROSS and OSS. The deformation gradient between ROAS and YAS is given by the tensor product F = H · G1 · H−1 · F0. The deformation gradient tensor G1 characterizes the displacement between ROSS and OSS. Displacements are calculated by using the finite element method to solve the equation of motion of an elastic membrane subject to viscous body force. The solution minimizes distortions between YAS and ROAS while aligning features on the two surfaces.
The goal of the algorithm is to solve for displacements on OSS that align matching features on the anatomical surfaces YAS and OAS when such features can be identified, but that minimize distortions between the anatomical surfaces when no definitive information is available. This is accomplished by moving the coordinates on OSS, and thereby moving points on OAS with respect to YAS. Let ROSS be the relaxed older spherical surface, with coordinates y′, and let ROAS be the relaxed older anatomical surface, with coordinates x′, where x′,y′ ∈ ℛ3. The displaced material points are constrained to remain on the surface OSS, so ROSS retains the same shape as OSS. ROAS still has the same shape as OAS, and corresponds to a new deformed anatomical configuration. The difference between OAS and ROAS is that points on ROAS that correspond to points on YAS have moved (“slid”) on the older anatomical surface to improve feature matching and reduce distortion. ROAS is the result of the registration algorithm; our final estimates of growth are the deformations required to transform YAS into ROAS.
2.1.2 Kinematics
The mathematical relationships between the surfaces are necessary to quantify distortions between the anatomical surfaces, which drive movements on the spherical surfaces. The deformation gradient associated with the change in shape from YAS to ROAS is given by [18] as
| (1) |
The deformation gradient F can also be described from the relationships between the other surfaces. The surface coordinates of OSS are related to those of ROSS by
| (2) |
where v is the displacement vector. The deformation gradient tensor associated with the deformation of OSS into ROSS is
| (3) |
which can also be written in terms of displacement as [19]
| (4) |
The deformation gradient that relates YAS and OAS is
| (5) |
and the deformation gradient between the surfaces OSS and OAS is
| (6) |
Eq. (1) can thus be written as
| (7) |
Note that H is evaluated at x and x′. From here on, let H(x) = H and H(x′) = H′. Substituting Eq. (4) into Eq. (7) gives an expression for F in terms of the displacements between OSS and ROSS:
| (8) |
2.1.3 Constitutive relations
In order to associate deformation with energy, a constitutive relationship is needed, specifically a relationship that handles large strains. For a hyperelastic material the first Piola-Kirchhoff (PK) stress tensor on ROAS with respect to YAS is given by [20, 21] as
| (9) |
A neo-Hookean material is described by a simple strain-energy density function that approximates the response of a rubber-like material; the strain-energy density function of a nearly incompressible neo-Hookean material is given by [21] as
| (10) |
where μ is the shear modulus, κ is the bulk modulus and
| (11) |
Here, I1 and I3 are strain invariants and are given by [19] as
| (12) |
Motion on the spherical surfaces must be driven by a stress that depends on deformation of anatomical surfaces. It is useful to write the first PK stress in terms of the deformation gradient (G1) describing the relationship between the two spherical surfaces (see Appendix 1 for derivation).
| (13) |
Eq. (13) describes the first PK stress on ROAS with respect to YAS. Now we need an expression for the first PK stress on ROSS that gives the same rate of internal mechanical work as the first PK stress on ROAS during deformation. The rate of internal mechanical work on ROAS is equal to the stress power per unit volume [19]:
| (14) |
The stress power ė is equal to . To obtain the same rate of internal mechanical work on ROSS,
| (15) |
where Q is the first PK stress on the surface ROSS with respect to OSS. Combining Eqs. (14) and (15) gives
| (16) |
Using the definition of F in Eq. (8) and useful relationships in [20], Eq. (16) is solved for Q:
| (17) |
Substituting Eq. (13) into Eq. (17) gives the first PK stress on the spherical surface ROSS as
| (18) |
Note that the stress Q acts on the spherical surface in response to the distortion of the anatomical surface.
2.1.4 Equation of motion
The equation of motion governing displacements between YAS and ROAS be obtained from the equation for momentum conservation in a hyperelastic solid [19]
| (19) |
where u is the displacement vector, ρ is the density and f0 is the body force. Let inertia be neglected, and the net body force be given by
| (20) |
Here, f is a matching force and is a viscous force that opposes motion (v is a “damping coefficient”). By substituting Eq. 20 into 19 we obtain
| (21) |
. The stationary solution to this equation of motion represents a local minimum of the strain-energy function. The equation of motion in terms of forces on ROSS can be derived in the same manner as Eq. (19), and is given by
| (22) |
where g is the body force on ROSS and ∇̃ is the gradient operator on OSS . Eq. (22) should lead to the same final solution as Eq. (19), and will minimize the same energy function, but is numerically tractable since it is solved on a sphere rather than a convoluted surface.
2.1.5 Body force
The body force, f, is used to align different features between the surfaces. To achieve this we represent the body force term as
| (23) |
where f1 and f2 are continuous, smooth functions of the spatial coordinates of YAS and ROAS, respectively. The body force g acts on the surface ROSS, while the body force f acts on the anatomical surface ROAS. These two forces are related by the deformation gradient H:
| (24) |
Eq. (23) is derived from the term [10]
| (25) |
A total energy function that takes into account the strain-energy density function as well as the energy due to features on the surfaces is given by
| (26) |
2.1.6 Use of the weak form
It is advantageous to write Eq. (22) in its weak form. By computing the weak form, the order of spatial derivatives in the stress divergence term is reduced, which reduces, in implementation, the numerical error due to the estimation of derivatives. We follow the approach described in Szabó and Babuška [22] in deriving the weak form of the equation of equilibrium (Appendix 2). Using Cartesian coordinates and indicial notation, the weak form of equation of equilibrium can be written as
| (27) |
where w is a test function. Note that Latin indices take the value of 1, 2, 3. The usual summation convention with respect to repeated indices is implied, while a comma followed by an index represents a spatial derivative.
2.2 Numerical methods
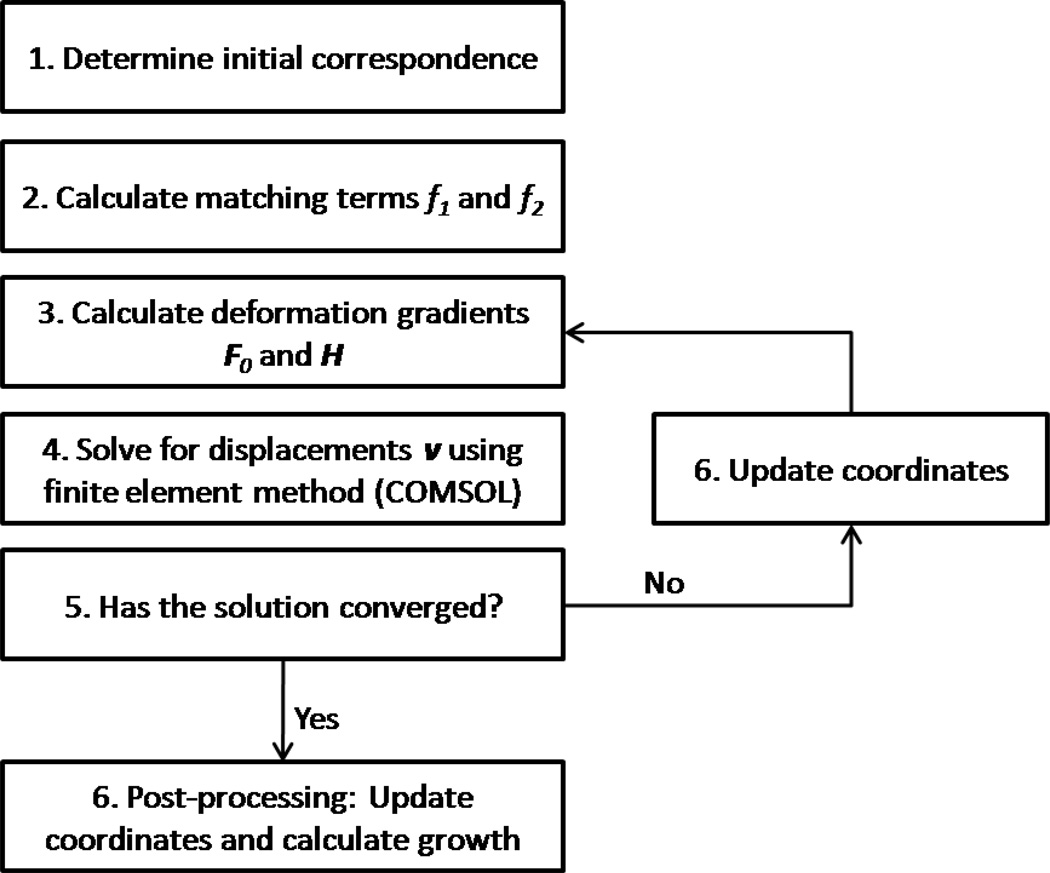
In this section we describe in detail the implementation of the theory presented in the previous section. The finite element method is applied to solve Eq. (27) for displacements v on the spherical surface OSS. We used COMSOL Multiphysics v3.4 (COMSOL Inc, Burlington, MA) software which interfaces smoothly with our custom Matlab functions, however, in theory this method could be implemented with any finite element software. A flow chart (Fig. 2) illustrates the registration algorithm.
Figure 2.
The LACROSS registration algorithm: An initial correspondence is determined between YAS and OAS. The matching terms f1 and f2, along with the deformation gradients F0 and H are calculated. The finite element method is used to solve Eq. (27) for displacements on OSS. Two measures of convergence are checked. If the convergence criterion is not met, then the coordinates are updated, and steps 3–5 are repeated. Once the convergence criterion is met, the coordinates are updated and the surfaces are analyzed.
2.2.1 Initial correspondence
An initial point-to-point correspondence between YAS, OAS and OSS is required. For test cases the initial relationship between all of the surfaces is known a priori. When analyzing surfaces created from MR images acquired at different time points, this initial correspondence is not known. Various published algorithms such as CARET [15], or FreeSurfer [3] can be used for this purpose. We used a custom–written (Matlab) surface registration algorithm to provide the initial correspondence. The deformation gradient between the anatomical surfaces YAS and OAS, F0, is estimated using a custom Matlab function based on the approach in Filas, Knutsen et al. [23].
2.2.2 Finite element method implementation
To use the finite element method, the tensor and scalar fields F0, H, f1 and f2 need to be interpolated onto the mesh. We imported these fields into COMSOL using two different approaches depending on whether the values at a material point change during the simulation. The quantities H and f2 both depend on the spatial coordinates on the surface ROAS, and therefore the values of H and f2 at a material point will change as it moves. The components of these fields (H and f2) are thus updated at each time step using the ‘Function’ capability in COMSOL. In contrast, the fields F0 and f1 depend only on the location of the material point on YAS (which do not change with time). These fields are initialized like dependent field variables (i.e., like displacements), but are not allowed to change. Both F0 and f1 are imported into COMSOL using custom functions written in Matlab.
The finite element mesh is generated in COMSOL. The appropriate mesh density depends on the spatial frequency with which F0 and H vary over the surface (this is discussed in more detail in Section 4.1). The solution (v) to the equation of motion (Eq. 27) was obtained using the generalized minimum residual (GMRES) linear time-dependent solver [24] with Incomplete LU preconditioning. The projection of spatial derivatives onto the tangent plane was performed using built-in COMSOL functions. The tangential components of the spatial gradient are given by
| (28) |
where n is the normal vector on OSS. Displacements are constrained to remain on the surface by forcing the radius of the sphere to remain constant as the solution is calculated.
After the solution has approximately converged (below) to an equilibrium solution, the displacements v on the sphere are mapped into displacements, u on the older anatomical surface, to obtain the “relaxed” older anatomical surface configuration, ROAS. The total displacement field from the younger anatomical surface (YAS) to ROAS is analyzed to estimate the deformation gradient, areal expansion, stretch, and strain.
2.2.3 Convergence
To evaluate convergence of the simulation, the total energy function (Eq. 26) is tracked as a function of the time parameter. The total energy function decays exponentially towards a constant, which is non-zero in general. As the energy function decays, a time constant is estimated, and the simulation is then run for a total of three time constants. To prevent the accumulation of numerical errors, the simulation is reinitialized twice (i.e., steps 4–6 in Fig. 2 are repeated).
2.3 Experimental methods
The ferret provides an excellent animal model in which to study the developing brain. Its cortex folds post-natally over a period of less than four weeks, it fits into bore of typical small animal MRI scanners, and it is less expensive and more convenient than primate models. MR images of two ferret kits were acquired at weekly intervals during the first month of life, and surface representations of the cortex were analyzed to quantify its heterogeneous and anisotropic growth.
2.3.1 Image acquisition
A ferret litter was obtained from the commercial vendor Marshal Bioresources (North Rose, NY). The litter contained a mother and 4 female kits. The kits were delivered at postnatal day 5 (P5) to a dedicated animal facility at Washington University (WU). The ferrets were stored at the animal facility for the duration of the study. Two kits (Kit A.1 and A.2) were chosen randomly to be scanned serially by MRI. The kits were imaged at days 14, 21 and 28 of life. Each kit was initially anesthetized using 3.5% isoflurane in O2 in a vented anesthesia chamber. The ferret was then placed in a nose cone with a pallet bar or tooth bar, depending on its age. Anesthesia was maintained with 1.5% isoflurane in O2 (1.0 L/min). The animal’s head was kept still in the prone position using a custom-made head support. Pulse rate and oxygen saturation levels were monitored continuously by a MRI-compatible pulse-oximeter (Nonin Medical, Plymouth, MN) taped to one of the back paws. Pulse rate and oxygen saturation levels were recorded at 15 minute intervals, along with the percentage of isoflurane. Body temperature was maintained by flowing temperature controlled water through tubing underneath the animal. The kit was kept anesthetized for a total of 120–180 minutes. All procedures were performed in accordance with NIH and institutional guidelines for the care and use of animals, and approved by the Washington University Animal Studies Committee.
Images were acquired on an 11.7T small animal scanner with Varian INOVA console equipped with a separate transmit and receive coil. T2-weighted images were acquired using a standard spin-echo pulse sequence. The imaging parameters TE (echo time) and TR (repetition time) were chosen to maximize signal to noise and contrast to noise in the images at each age [25]. Images were acquired at a resolution of 250×250×250 µm, which provided adequate signal-to-noise ratio while still allowing for the structure of the cortex to be identified. The number of averages acquired depended on the amount of time available during each scan and the length of time for a single acquisition. The larger the brain, the more time was needed for a single acquisition. The MR image acquisition parameters are listed in Table 1.
Table 1.
Postnatal age in days at time of scan; echo time (TE) in ms; pulse repetition time (TR) in s; number of averages acquired (nt); resolution of voxels in microns.
| Age (days) | TE (ms) | TR (s) | nt | Resolution (µm) |
|---|---|---|---|---|
| 14 | 60 | 4 | 8 | 250×250×250 |
| 21 | 58 | 4.4 | 4 | 250×250×250 |
| 28 | 55 | 4.4 | 4 | 250×250×250 |
2.3.2 Image segmentation and surface generation
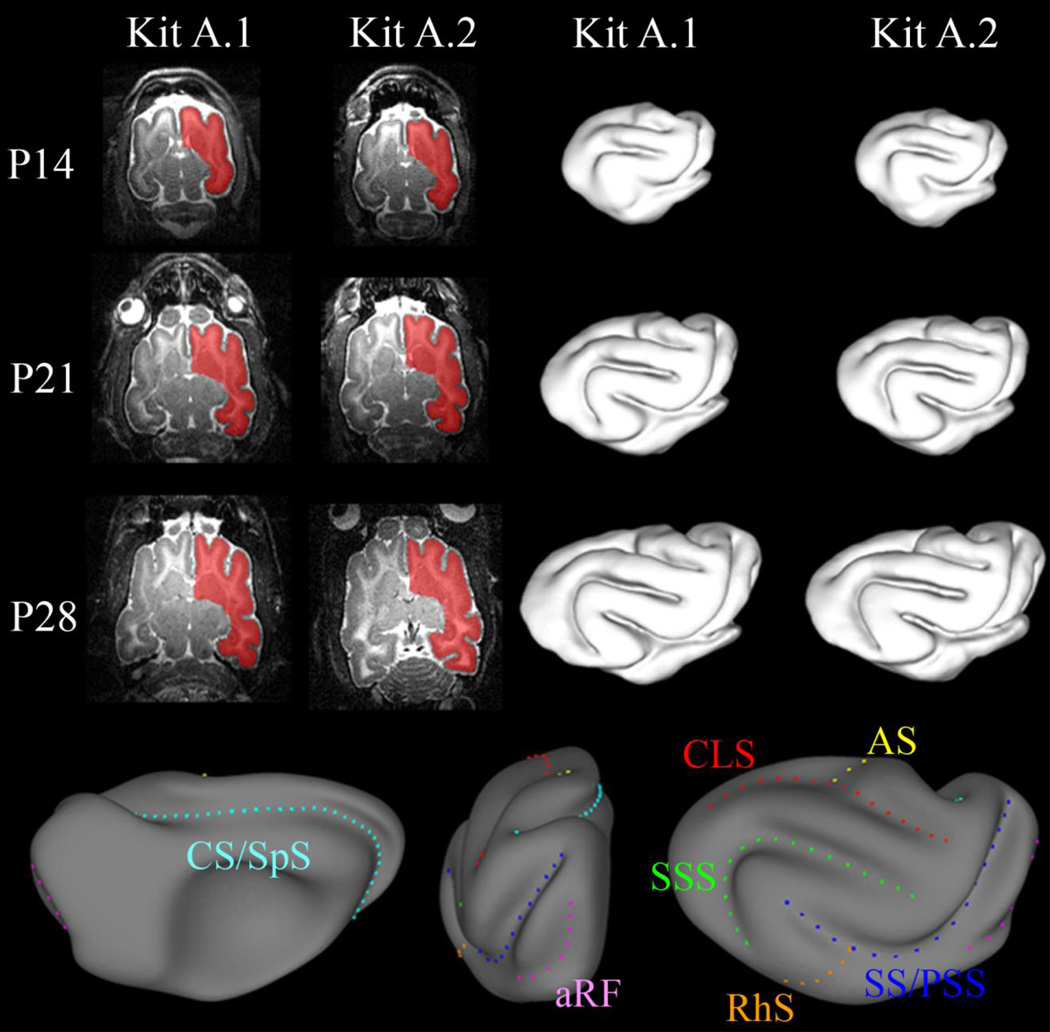
All operations in this section were performed using CARET software [15]. All images were segmented manually to generate mesh-based representations of the cortical surface. The boundary (pial surface) between gray matter, (GM) and cerebrospinal fluid (CSF) was chosen to be the edge of the segmentation. The segmentation volume was eroded by one voxel so that the boundary of the segmentation was inside the cortex, approximating a mid-cortical surface. A single slice from the segmentation volume of the right hemisphere from each of the image acquisitions is shown in Fig. 3.
Figure 3.
T2-weighted MR images of the live ferret brain acquired using a spin-echo pulse sequence at postnatal days 14, 21 and 28. Using CARET software (Van Essen et al., 2001) images were manually segmented at the boundary of GM and CSF. Cortical surface representations were created from the segmentation volumes. Sulci in the ferret brain: coronolateral sulcus (CLS, red); sylvian sulcus/presylvian sulcus (SS/PSS, dark blue); suprasylvian sulcus (SSS, green); cruciate sulcus/splenial sulcus (CS/SpS, cyan); anterior rhinal fissure (aRF, pink); rhinal sulcus (RhS, orange); ansate sulcus (AS, yellow).
A mesh representation of each cortical surface was generated from the segmentation volume, and a smoothing filter (strength=0.1; iterations=15) was applied to the surfaces. The cortical surfaces from both hemispheres are shown in Fig. 3. Each surface consisted of approximately 10000–30000 points in space connected by a triangular mesh of approximately 20000–60000 faces. Spherical representations of the cortical surfaces were created using default settings in CARET [15].
The medial wall was manually identified using both the anatomical MR images and the cortical surface. The coordinates that lie on the medial wall are not part of the cortex, and were not of interest to our analysis. Surface registration was performed with the medial wall intact, but the boundary was used as a “feature” to be matched. The names of the sulci on the ferret brain are shown in Fig. 3.
2.3.3 Surface feature matching terms
The surface feature matching terms f1 and f2 determine the body force g, as described in Eq. 24, and can be any function of X and x, respectively. We postulate that regions of similar mean curvature should be drawn together, as should known, fixed boundaries. Accordingly, f1 and f2 were created from the sum of two terms: a function of mean curvature, fc, and a function of distance from manually identified landmarks, fd:
| (29) |
Let Ky and Ko be the mean curvature estimates on YAS and OAS, respectively. The matching terms due to curvature are given by
| (30) |
The second term is a function of the geodesic distance of the surface coordinates from the landmark points. This term was intended to match the boundary of the medial wall, which is not readily identified from mean curvature. Using the anatomical MRI, the medial wall was identified manually and projected onto the cortical surface. The geodesic distance is calculated between every surface point and the nearest landmark point. This term is intended to have a high value when the geodesic distance is small, and to decrease to zero as the distance becomes larger. This is achieved by the functions
| (31) |
where a1 and a2 are constants, d1 is the geodesic distance from coordinate X to the nearest landmark point on the YAS and d2 is the geodesic distance from coordinate x to the nearest landmark point on the OAS. Using a custom function in Matlab, both f1 and f2 were iteratively smoothed (strength=0.1; iterations=50) over the surface before matching.
3. Results
First we present three test cases to demonstrate and validate our approach. For the first case a sphere with distortions introduced by mis-registration was registered to itself, and surface matching terms used to align regions. The second case is the registration of a sphere to a lobed (pumpkin) shape. The third case looks at a locally smoothed region on a ferret cortical surface. Our approach is then applied to ferret cortical surfaces created from MRI images of the brains of two ferret kits at three ages (P14, P21, and P28).
Growth is visualized by areal expansion (dilatation ratio), which is calculated from the determinant of the deformation gradient F, and by the principal values of the Lagrangian strain tensor, which is estimated using the approach presented in Filas, Knutsen et al. [23].
3.1 Registration test cases
3.1.1 Case 1: Registration of a sphere to itself with the introduction of artificial distortions and matching surface features
The surface YAS was a sphere of radius 1 defined by a triangular mesh with 7542 vertices and 15080 faces. Displacements were applied to YAS in spherical coordinates to generate a distorted (mis-registered) OAS:
| (32) |
The coordinates for OSS were given by
| (33) |
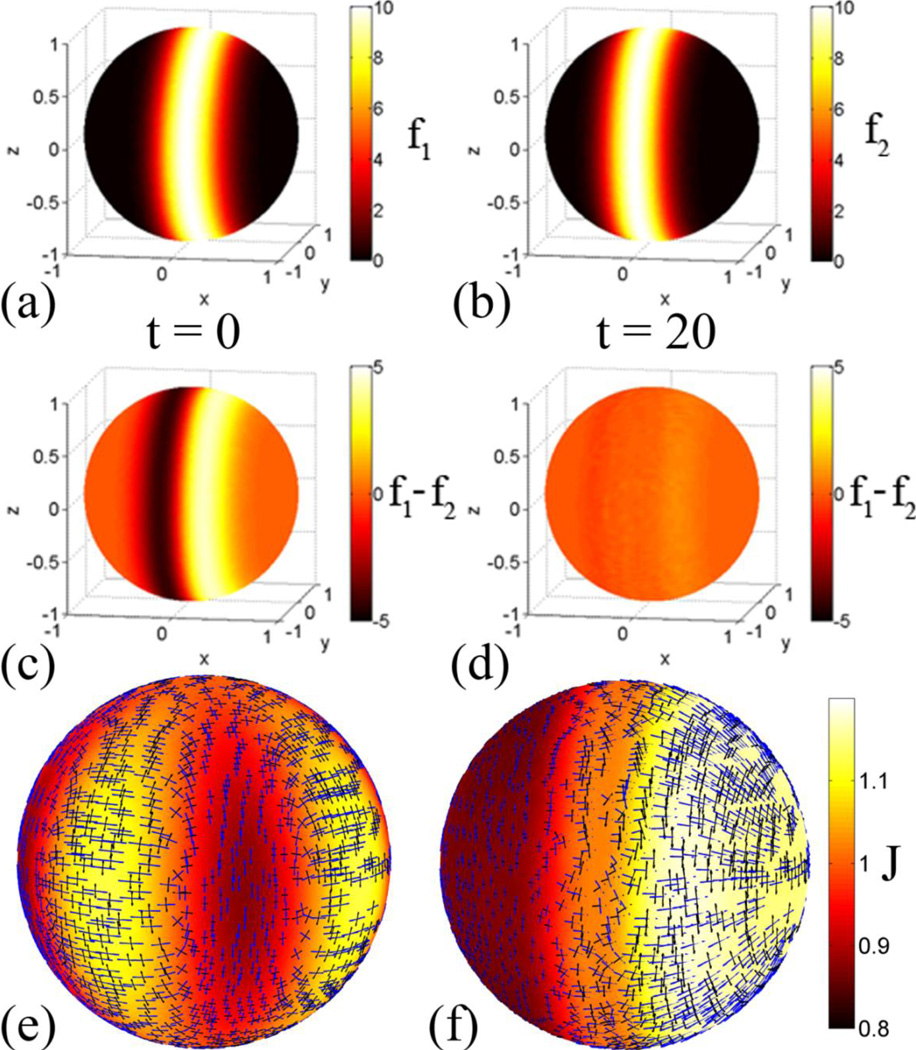
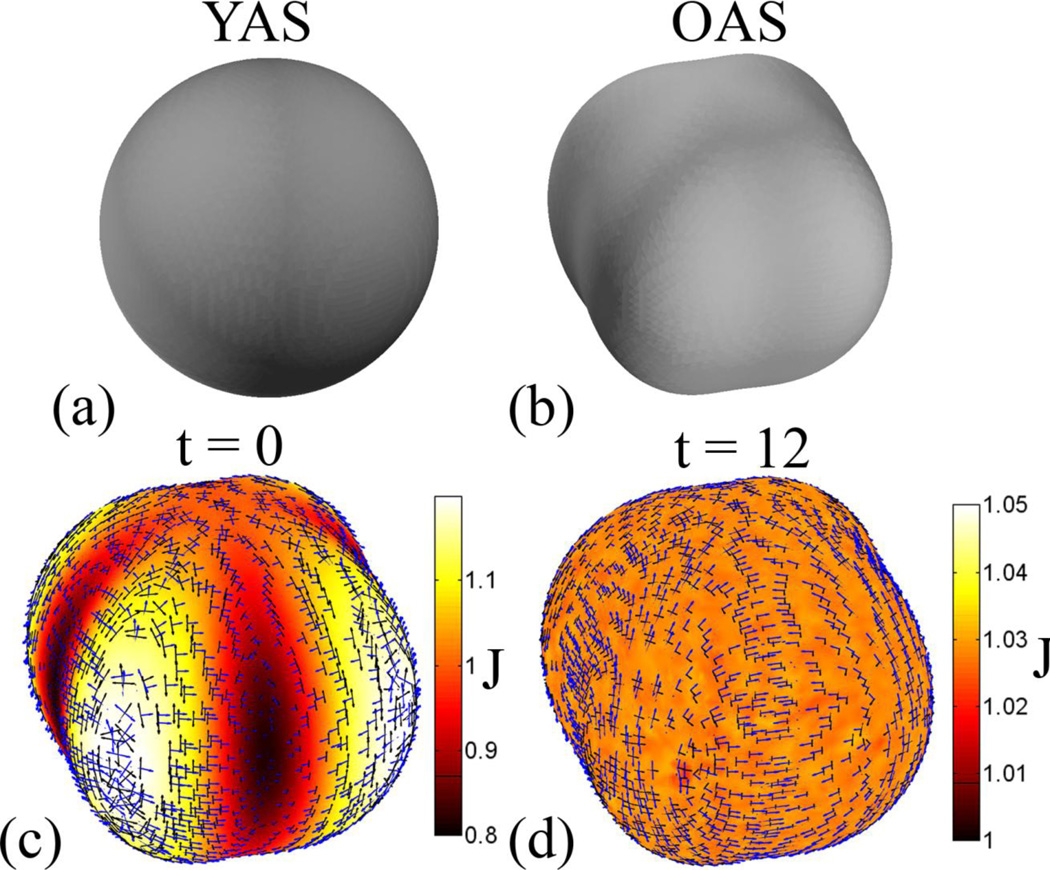
The initial distortions are visualized by areal expansion and by the eigenvectors of the Lagrangian strain tensor, scaled by the corresponding principal stretches (Fig. 4e). The applied displacements create an alternating pattern of regions of expansion and compression; principal strain estimates add information on the directions of stretching and shrinking.
Figure 4.
Registration of a sphere to itself with surface feature matching: (a,b) The surface matching term f1 contains a band of high intensity on the sphere that is offset in the x-direction from f2. (c,d) The initial difference between the surface matching terms is reduced by approximately one order of magnitude after the solution converges. (e) Initial distortions are visualized by areal expansion (the dilatation ratio, J) between YAS and OAS. Also the eigenvectors associated with first (blue) and second (green) principal strain are plotted. The vectors are scaled by the principal stretch magnitudes. Only the vectors at every fourth point on the surface are displayed. After convergence of the algorithm the initial distortions have been relaxed away. For the surface matching terms to align, the coordinates need to shift in the negative x-direction, which causes expansion on the right (x > 0) side of the sphere and compression on the left (x < 0) side. (f) After relaxation the areal expansion between YAS and OAS is almost uniform in each of three regions: the right (x > 0) side of the sphere where expansion has occurred, the left (x < 0) side of the sphere where compression has occurred and the center (x ≈ 0) region, which remains relatively undeformed.
Surface matching terms f1 and f2 were defined by
| (34) |
and are shown in Fig. 4(a,b). The goal of the registration algorithm is to remove distortions due to mis-registration while aligning f1 and f2.
The finite element mesh used to register these surfaces consisted of 1240 elements. A list of the parameters used for this test case is found in Table 2. Two iterations were performed; the total run time in COMSOL was 48.8 minutes (not including pre-and post-processing steps performed in Matlab). Measures of convergence and summary statistics are listed in Table 2.
Table 2.
List of parameters used for the registration test cases 1 and 2 and for the registration of ferret cortical surfaces: the shear modulus, μ, bulk modulus, κ, damping coefficient, v, the number of elements in the finite element mesh, N, and the total run time in COMSOL.
| Case | μ (Pa) | κ (Pa) | v (N-s/m3) | N | Time (hours) |
|---|---|---|---|---|---|
| 1 | 0.01 | 10 | 100 | 1240 | 0.81 |
| 2 | 0.01 | 10 | 100 | 1234 | 0.18 |
| 3 | 0.01 | 10 | 1000 | 3852 | 1.5 |
| A.2 P14=>P21 | 0.1 | 10 | 100 | 9068 | 4.1 |
| A.2 P21=>P28 | 0.1 | 10 | 100 | 9068 | 5.4 |
| A.1 P14=>P21 | 0.1 | 10 | 100 | 9068 | 5.4 |
| A.1 P21=>P28 | 0.1 | 10 | 100 | 9068 | 4.1 |
Once the solution converged, the calculated displacements were applied to update the coordinates of OSS and OAS (i.e., to ROSS and ROAS). Initial distortions relax away during the registration process, while the difference between the surface matching terms decreases by approximately one order of magnitude (Fig. 4c,d). “Physical” deformations (distortions necessary to match surface features) are conserved, however. Because the surface features align with one another, the positive x side of the sphere expands, while the negative x side of the sphere contracts. This pattern is visualized in the plots of areal expansion and principal strain (Fig. 4f).
3.1.2 Case 2: Registration of a spherical surface to a “pumpkin” shape
The second test case involves a sphere expanded and folded into a lobed spheroid (a pumpkin). No surface matching terms were used. YAS was a sphere of radius 1 described by a triangular mesh with 7542 vertices and 15080 faces. Displacements in the radial direction were applied to the reference coordinates to create the deformed surface. The initial deformation gradient was calculated and imported into COMSOL.
| (35) |
The finite element mesh for this problem consisted of 1240 elements. A list of the parameters used for this test case is found in Table 2. The total run time in COMSOL was 11 minutes. Measures of convergence and summary statistics are listed in Table 2.
As shown in Fig. 5(c,d), areal expansion relaxes from a non-uniform pattern to a stable, approximately uniform value on the surface. The initial strain field, shown in Fig. 5(c), shows large principal strains in areas of high negative curvature. After registration, the magnitudes of the principal strains are reduced, but still show some spatial variation, as the surface necessarily deforms non-uniformly to accommodate the change in shape. In this example, because there are no surface features to match, the solution with minimum strain energy is found.
Figure 5.
Registration of a sphere to a pumpkin: The deformed surface was created by growth and folding of the reference surface. (a) A sphere of radius one was used for the YAS (b) The OAS surface was created by adjusting the radius as a function of the spherical coordinates θ and ϕ (c) Initial distortions are visualized by areal expansion (dilatation ratio, J) and the eigenvectors associated with first (blue) and second (green) principal strains. The eigenvectors are scaled by their corresponding principal stretches. (d) After relaxation, the resulting areal expansion is uniform over the surface, but the eigenvectors associated with stretch show the necessary anisotropic expansion required for the sphere to grow into the lobed surface.
3.1.3 Case 3: Registration of a locally smoothed P14 cortical surface to an unsmoothed P14 cortical surface
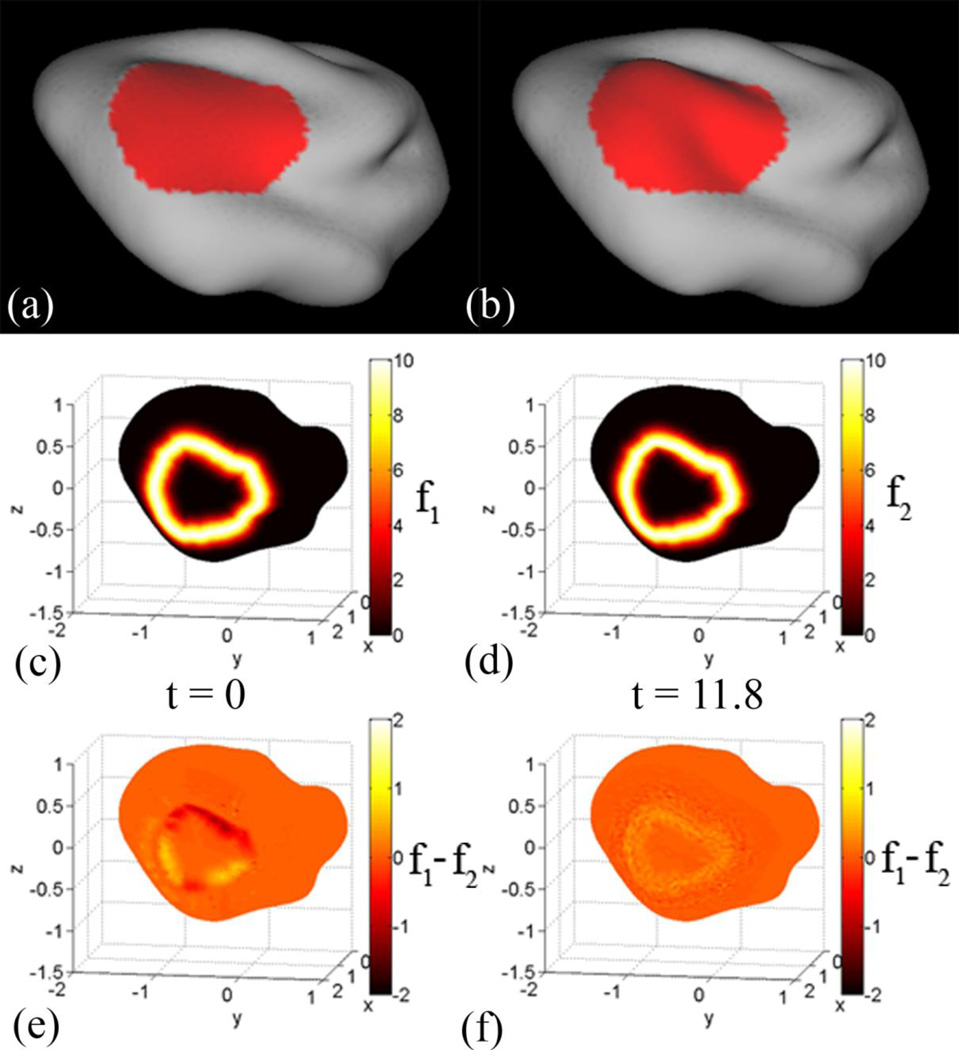
For the third test case, OAS was a P14 cortical surface. To create YAS, a closed region was selected on OAS and smoothed for 500 iterations in CARET. The surfaces are shown in Fig. 6(a,b), with the selected region highlighted in red. The P14 cortical surface contained 10744 vertices and 21484 faces. A spherical representation of OAS was generated in CARET and was set to OSS.
Figure 6.
Smoothing of a local region on P14 cortical surface: The red region was identified on the P14 cortical surface of Kit A.2, and was iteratively smoothed for 500 iterations in CARET software. The smoothed region mimics a less mature cortex in the selected region. (a) The smoothed surface was set to be YAS. (b) The original surface is set to be OAS. (c,d) The feature matching terms f1 and f2 were created from the border that was used to bind the region that was smoothed. (e) The initial difference between the two matching terms was small because the landmark was at the same spatial location on each surface. (f) After applying the registration approach, the difference between the matching terms remains small.
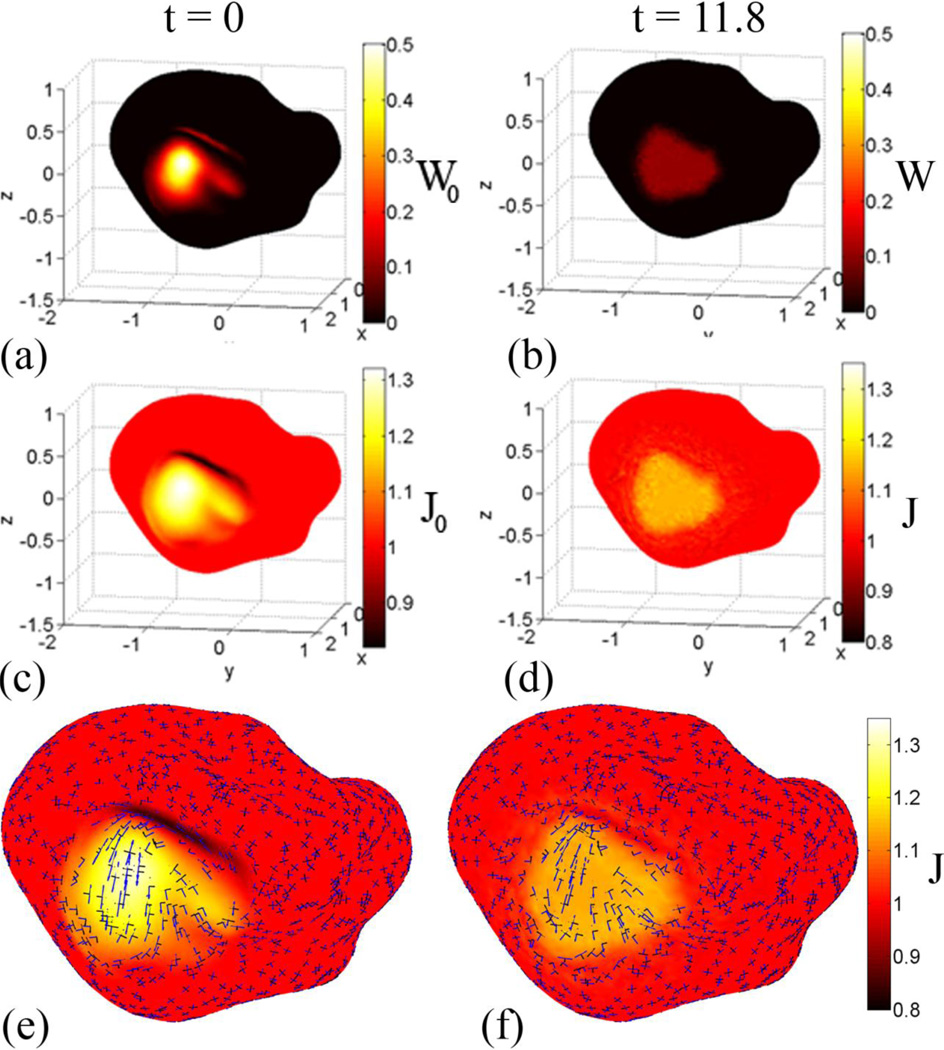
The border between the smoothed and unsmoothed region was used to create the surface matching terms f1 and f2, which are shown in Fig. 6(c,d). The initial difference between f1 and f2 is small because the boundary of the region is at the same spatial coordinates on both surfaces, and decreases after the solution converged. The initial distortions are visualized in Fig. 7(a,c) by the strain-energy density function and the change in area from the deformed surface to the reference surface.
Figure 7.
Registration of a P14 cortical surface to itself with smoothing applied to a local region: The goal of this test case is to be able to identify local growth on a complex surface. (a,c) Initial distortions are visualized by the strain-energy density function and the areal expansion (dilatation ratio, J) between YAS and OAS. Only the coordinates within the patch were adjusted, so W0 and J0 are constant outside of the patch and vary within it. (e,f) Eigenvectors associated with first (blue) and second (black) principal stretches are plotted with the dilatation ratio as an underlay.
For this case, the finite element mesh consisted of 3852 elements. A list of the parameters used for this test case is found in Table 2. The algorithm was applied for three iterations before convergence was obtained. The total run time in COMSOL was 93 minutes. Measures of convergence and summary statistics for each iteration are listed in Table 2.
After relaxation, the strain-energy density function becomes almost uniform inside the selected region and remains at approximately zero outside of the region. The same pattern holds true for the dilatation ratio, which approaches a constant of 1.13 within the selected region and remains at 1.00 outside of the region. The eigenvectors associated with the principal strains are shown in Fig. 7(e,f). This example demonstrates the key properties of this approach: where features can be defined, they are matched, but where features are lacking, strains are assumed to be as uniform and small as possible.
3.2 Cortical growth during development
3.2.1 Registration of the P14 and P21 ferret cortical surfaces
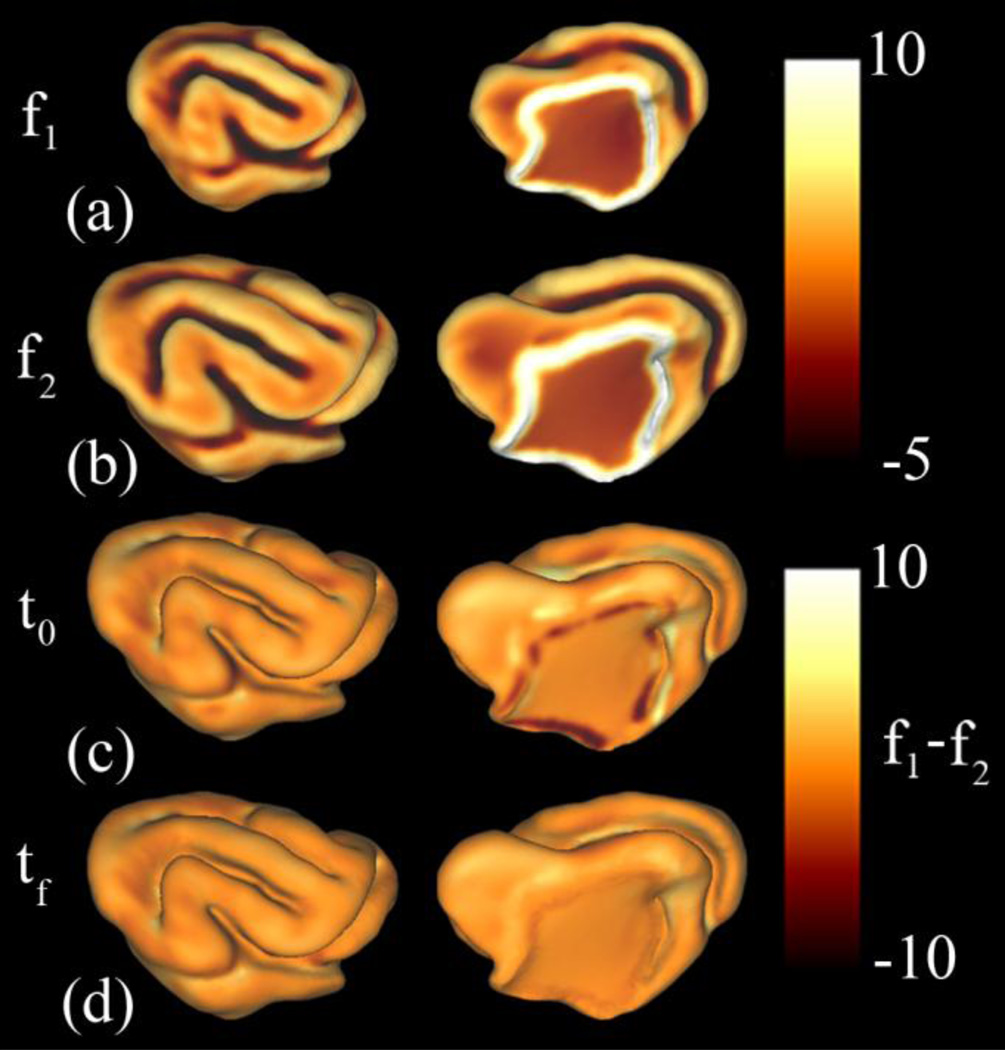
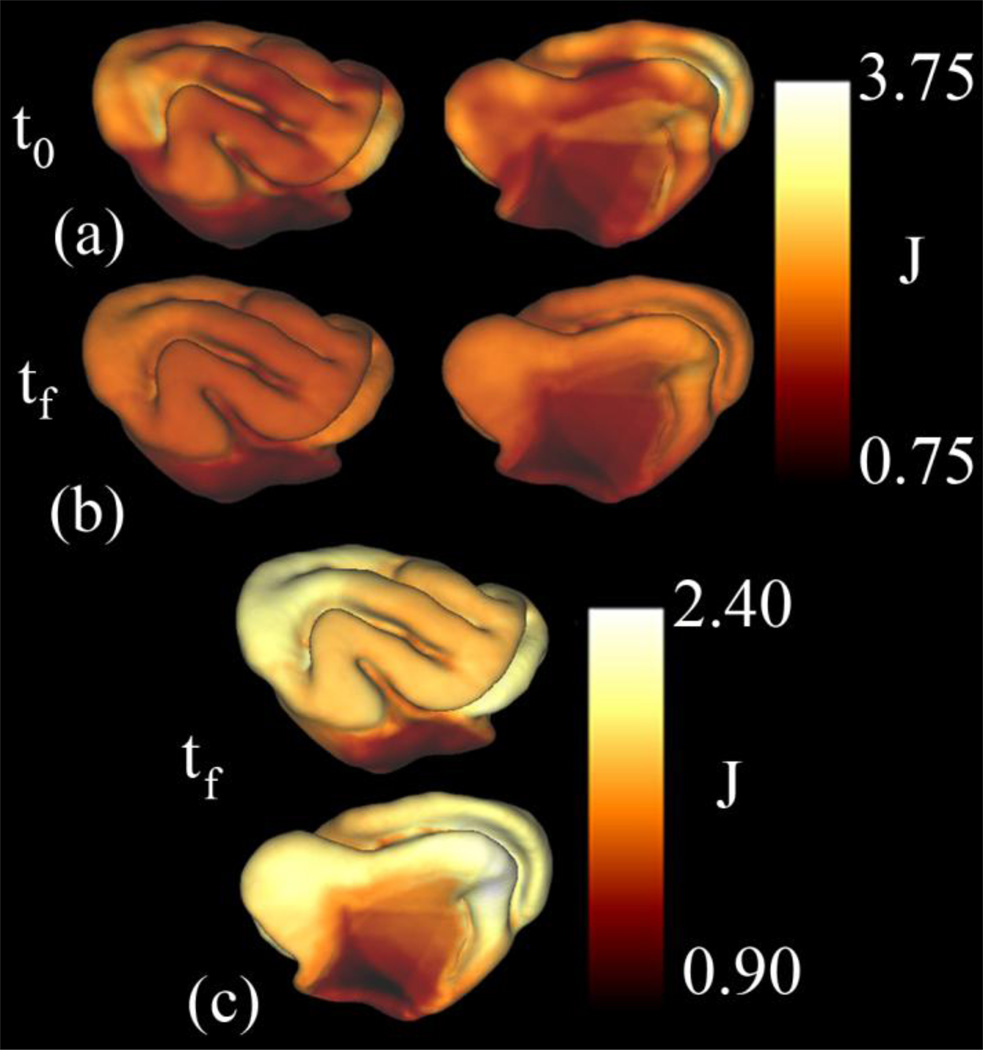
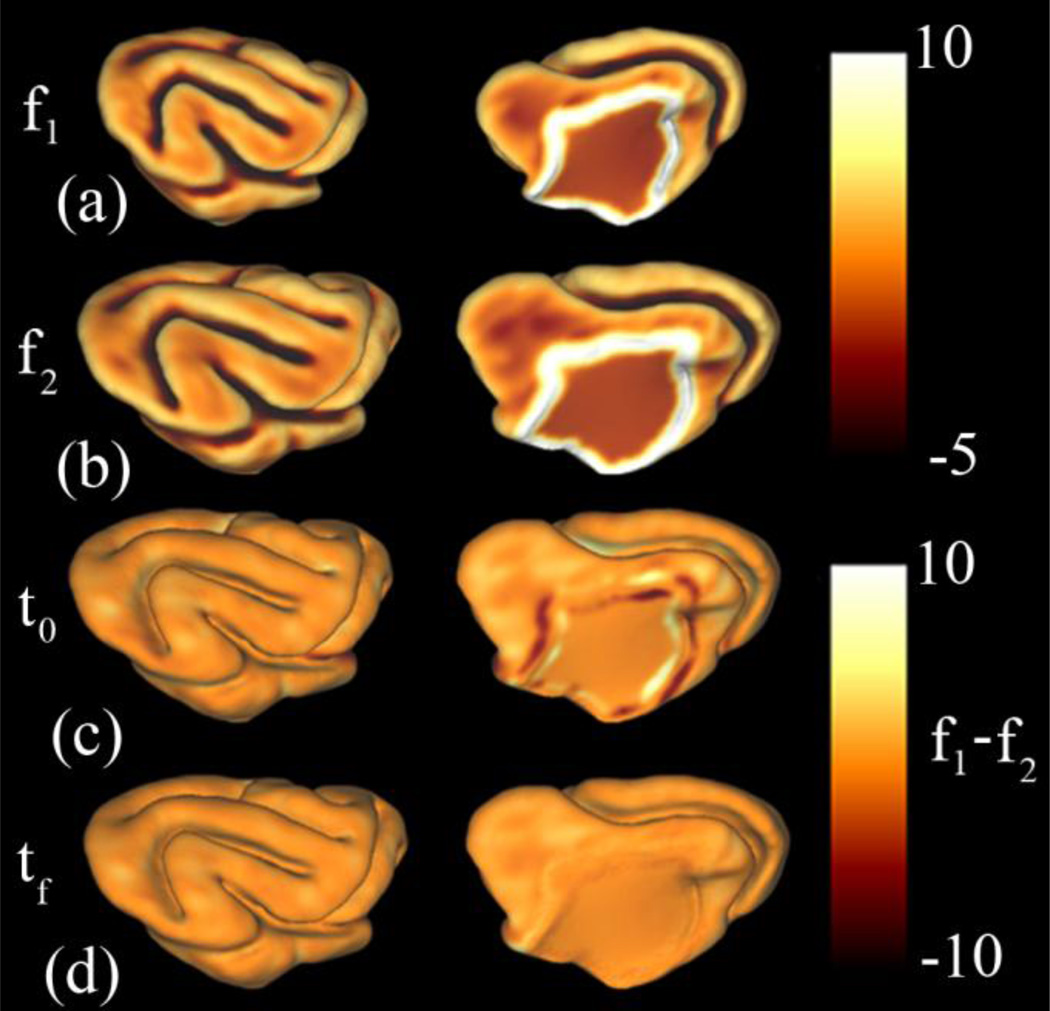
Surface matching functions for the P14 and P21 ferret brains are shown in Fig. 8(a,b). Fig. 9(a) shows areal expansion from the initial correspondence, which contains artificially high values of expansion and contraction due to mis-registration. The parameters used for registration are listed in Table 2. The finite element mesh consisted of 9068 elements, and the total run time in COMSOL was 4.1 hours. The combination of both pre- and post-processing in Matlab required a similar time investment.
Figure 8.
Surface feature matching terms for registration of the P14 and P21 ferret brain (Kit A.2): Mean curvature and geodesic distance from the medial wall were used to calculate the surface matching terms f1 and f2. (a): surface feature term f1 on YAS. (b): function f2 on OAS. (c): The difference between matching terms (f1 – f2) at the initial time t0. (d): The difference between matching terms (f1 – f2) at the final time tf.The initial differences between f1 and f2 are reduced after the application of the relaxation algorithm. In particular, marked reductions are seen around the medial wall.
Figure 9.
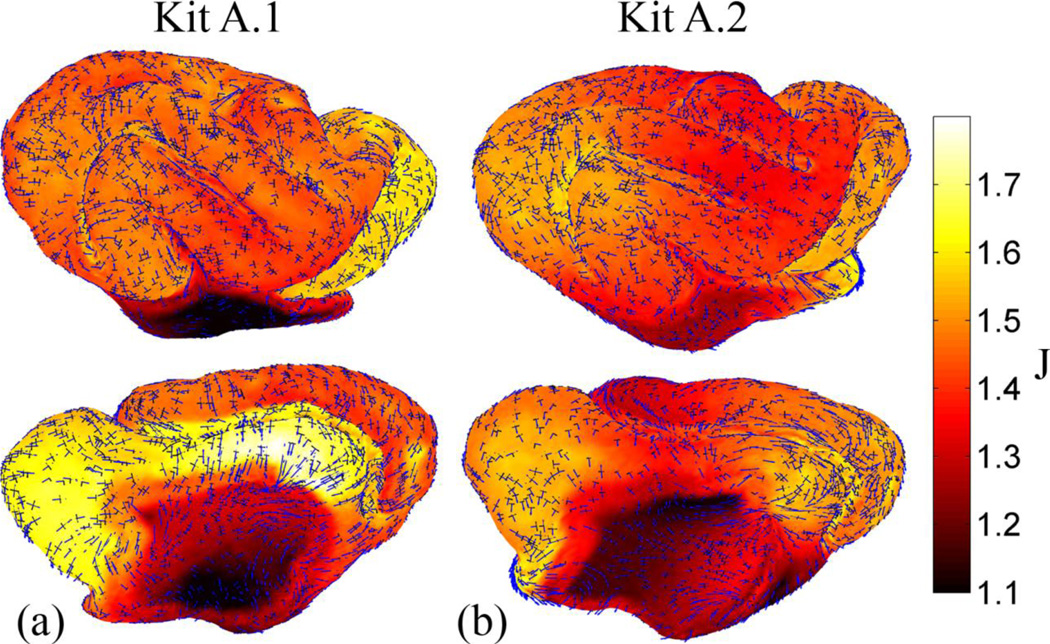
Areal expansion associated with cortical growth in the ferret from P14 to P21 (Kit A.2): The dilatation ratio, J, was calculated before (a) and after (b) the relaxation algorithm was applied. (c) Expansion of the color scale provides more detail into the differences in growth within the cortex (medial and lateral views).
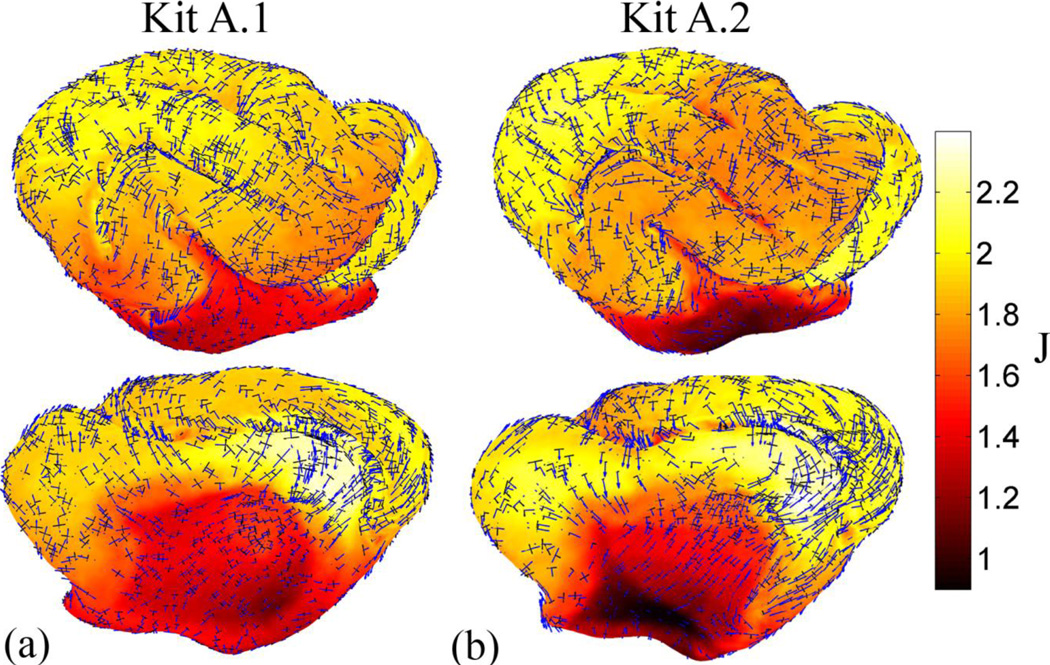
After relaxation, the surface matching functions become more aligned (Fig. 8c,d) and much of the initial distortion is removed (Fig. 9b). Plotting the areal expansion using a smaller range illustrates what we believe to be true (physical) spatial variations in growth between P14 and P21 (Fig. 9c). The average dilatation ratio is 1.87 with a standard deviation of 0.22 (not including the medial wall). Almost no growth is seen in the allocortex.. The largest amount of growth is seen on the medial side of the brain, inferior to the anterior end of the cruciate/splenial sulcus (Fig. 3, CS/SpS). The eigenvectors corresponding to the first and second principal strains are shown in Fig. 10, scaled by the principal stretches; growth is typically larger in the direction of maximum curvature (perpendicular to gyral folds).
Figure 10.
Areal expansion and principal stretch fields associated with cortical surface growth in the ferret from P14 to P21 (both kits): plotted over the dilation ratio, J, are the eigenvectors associated with first (blue) and second (black) principal stretches. Vectors are scaled by their corresponding principal stretch value, and were plotted for every fifth point on the surface. The primary direction of growth tends to be across gyri (i.e., perpendicular to sulci).
3.3.2 Registration of P21 and P28 ferret cortical surfaces
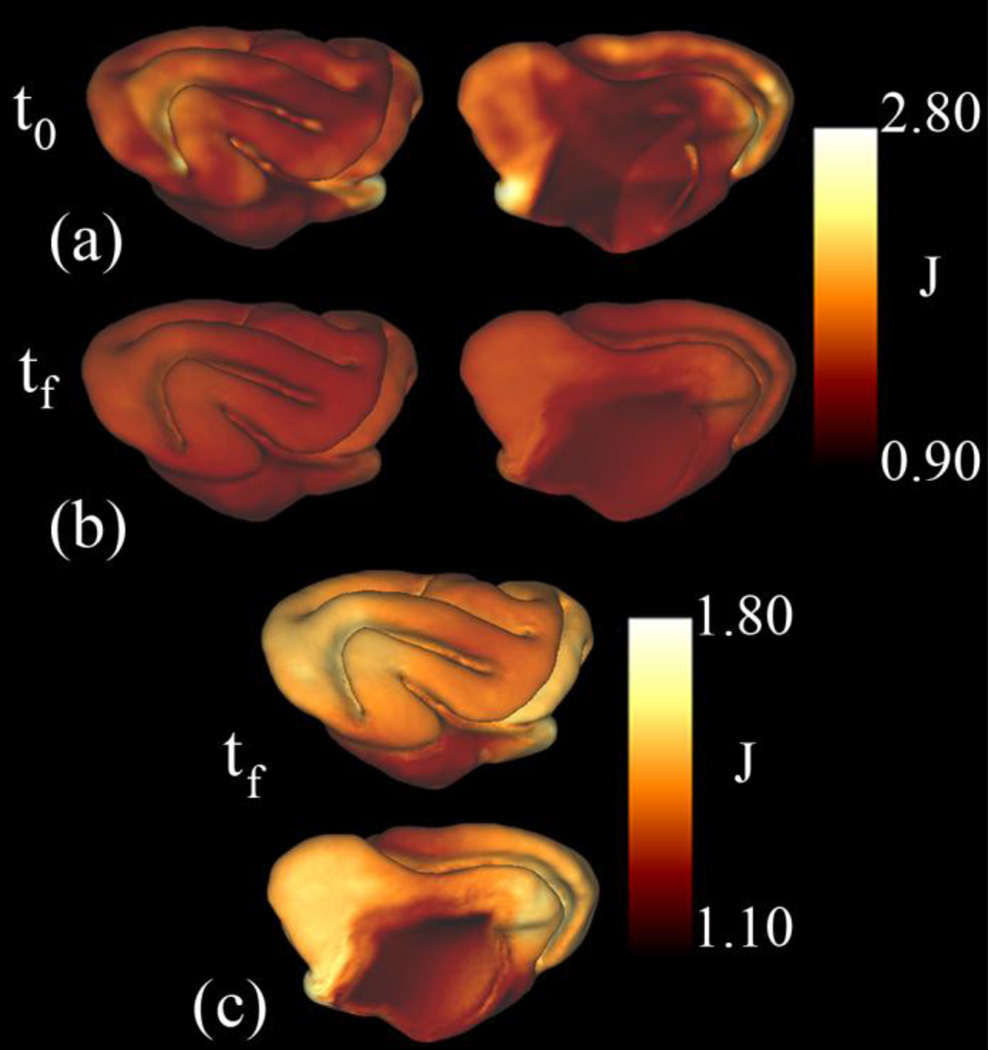
The surface matching functions for the P21 and P28 ferret brains are shown in Fig. 11(a,b). The areal expansion before relaxation is shown in Fig. 12(a). The parameters used for registration are listed in Table 2. The finite element mesh consisted of 9068 elements and the total run time in COMSOL was 5.4 hours.
Figure 11.
Surface feature matching terms for registration of P21 to P28 ferret cortical surfaces (Kit A.2): Mean curvature and geodesic distance from the medial wall were used to calculate the surface matching terms f1 and f2. (a): Surface feature function f1 on YAS. (b): function f2 on OAS. (c): The difference between matching terms (f1 – f2) at the initial time t0. (d): The difference between matching terms (f1 – f2) at the final time tf. The initial differences between f1 and f2 are reduced after the application of the relaxation algorithm. As from P14 to P21, the largest reductions are seen around the medial wall.
Figure 12.
Areal expansion results for P21 to P28 (Kit A.2): The dilatation ratio, J, was calculated before (a) and after (b) the relaxation algorithm was applied. (c) Expansion of the color scale provides more detail into the differences in growth within the cortex. Again, a similar pattern of growth is seen in kit A.1. Also, the pattern of growth is similar to the pattern seen from P14 to P21. However, the total amount of growth and the variability in growth throughout the cortex are reduced from P21 to P28.
After relaxation, the surface matching functions become more closely aligned (Fig. 11c,d) and much of the initial distortion is removed (Fig. 12b). Plotting areal expansion over a smaller range allows true physical variations in growth to be detected (Fig. 12c). The average amount of areal expansion is smaller than from P14 to P21 (1.45), and the standard deviation is much lower (0.085) (the medial wall is not included in these statistics). The scaled eigenvectors corresponding to the first and second principal strain, scaled by the principal stretches, are shown in Fig. 13.
Figure 13.
Areal expansion and principal strain fields from P21 to P28 (both kits): plotted over the dilatation ration, J, are the eigenvectors associated with first (blue) and second (black) principal stretches. Vectors are scaled by their corresponding principal stretch value, and were plotted for every fifth point on the surface. Growth is smaller and more uniform during this period compared to the interval from P14 to P21, and it appears to be more isotropic.
4. Discussion
We introduce a method to register matching, closed anatomical surfaces in 3-D (representing two configurations of the same surface) by solving a partial differential equation on a spherical representation of the “deformed” surface. The solution of this equation minimizes distortion in areas where limited information is available to guide registration, while matching surface features where they can be identified. Simple test cases illustrate the approach and demonstrate its efficacy. Solving the equation of motion on an anatomical surface (i.e., OAS) is difficult to implement in practice. An easier approach is to solve it on a simple shape such as a sphere (OSS) that has a defined relationship to the anatomical surface (OAS). The trick is to take into account the deformations that are induced in mapping the anatomical (OAS) to the spherical surface (OSS), and to then determine how the displacement vector field on the spherical surface affects the strain-energy density function associated with the deformation from the younger (YAS) to the older (OAS) anatomical surfaces.
The numerical solution of the equation of motion identifies a minimum of the objective function. The current approach is not guaranteed to find a global minimum, so that initial conditions are important. For the test cases analyzed above, the initial conditions were specified to induce moderate distortions. For the actual data, the initial correspondence is estimated by selecting a series of landmarks on both the younger and older anatomical surfaces. In all test cases the solution converged to the appropriate state, and in the application to the ferret the results are consistent and physically sensible.
The procedure is implemented in the COMSOL/Matlab environment. The number of vertices in the original surface influences the amount of time required to run through the entire registration process. The density of the finite element mesh (not necessarily the same as the original surface mesh) also affects computational requirements, specifically memory and processing time.
4.1 Density of the finite element mesh
The numerical values of the curvature, the deformation gradient tensor and the Jacobian are interpolated into COMSOL at each of the finite element mesh node points. The finite element mesh must be fine enough to resolve the spatial variations in these fields. The elements of the finite element mesh are described by second order basis functions. So, the fields of surface parameters must be described reasonably well by a second order basis function over the span any given element. This is checked visually and numerically by interpolating the surface measures from the finite element mesh back onto the original surface coordinates in Matlab, and comparing with the original data.
4.2 Growth in the neonatal ferret brain
The average growth between P14 to P21 is greater than from P21 to P28. In addition the regional variation in growth from P14 to P21 is higher than it is between P21 to P28. Between both sets of time points, very little growth occurs in the allocortex (inferior to the RhS sulcus and part of the SS/SPS sulcus, Fig 3). The allocortex is thought to develop earlier than the rest of the cortex [26]. From P14 to P21, the region of largest growth is seen around the CS/SpS sulcus (Fig. 3). This sulcus contains a very smooth region at P14 that has developed into a deep fold by P21. Between P21 and P28, growth is closer to regionally uniform over the surface, but the general patterns of spatial variation persist.
5. Conclusions
In this paper we present an approach for the registration of two anatomical surfaces which uses mechanics to minimize an objective (energy) function. This function includes a strain energy term due to distortion and an “error energy” term due to mismatch between surface features, so that minimization of this function will bring surface features into approximate registration with as little deformation as possible in other regions. To find this solution, the finite element method is applied to solve a partial differential equation for motion on the surface.
A surface registration algorithm that minimizes physical distortions during registration of brain surfaces from an individual is a useful tool. This approach leads to conservative estimates of variations in growth during brain development. Initial results show regional, directional and temporal variations in expansion of the cortex from P14 to P28 in the ferret. We plan to extend our analysis to cortical surfaces from a larger cohort of neonatal ferrets at more ages, and to characterize brain development in the premature human infant.
Acknowledgements
Funding was provided by NSF Grant DMS-0540701 (LAT) and NIH Grant R21 EB005834 (PVB). We are grateful for helpful discussions with David Van Essen, Jeffrey Neil and Terrie Inder.
Funding provided by NSF Grant DMS-0540701 (LAT) and NIH Grant EB005834 (PVB)
Appendix 1
The derivation of Eq. (13) begins with the relationship
| (36) |
Remembering the relationship in Eq. (7), let E = G1,A = H′−1,B = F,, D = H, and write
| (37) |
Using indicial notation, Eq. (37) becomes
| (38) |
The derivative of G1 with respect to F is
| (39) |
where δ is the Kronecker delta, and is defined as
| (40) |
Substituting Eq. (39) into Eq. (36) gives
| (41) |
Eq. (41) can be rewritten in tensor notation to give
| (42) |
Finally, substituting the original variables back into the expression gives
| (43) |
Appendix 2
To obtain the weak form, multiply Eq. (22) by a test function wi and integrate over the area:
| (44) |
Consider first the integral that contains the stress tensor Qij. Applying the product rule allows us to rewrite the product of the stress tensor and the test function as
| (45) |
The Divergence Theorem can then be applied:
| (46) |
Here nj is the normal vector in the outward direction on the surface, and C is the boundary. The surface is closed, so
| (47) |
Substituting Eqs. (45–47) into Eq. (44) and combining all of the terms into a single integral gives
| (48) |
References
- 1.Pang T, Atefy R, Sheen V. Malformations of cortical development. The Neurologist. 2008;14:181–191. doi: 10.1097/NRL.0b013e31816606b9. [DOI] [PMC free article] [PubMed] [Google Scholar]
- 2.Van Essen DC. A tension-based theory of morphogenesis and compact wiring in the central nervious system. Nature. 1997;385:313–317. doi: 10.1038/385313a0. [DOI] [PubMed] [Google Scholar]
- 3.Fischl B, Sereno MI, Tootell RBH, Dale AM. High-resolution intersubject averaging and a coordinate system for the cortical surface. Human Brain Mapping. 1999;8:272–284. doi: 10.1002/(SICI)1097-0193(1999)8:4<272::AID-HBM10>3.0.CO;2-4. [DOI] [PMC free article] [PubMed] [Google Scholar]
- 4.Glaunes J, Vaillant M, Miller MI. Landmark matching via large deformation diffeomorphisms on the sphere. Journal of Mathematical Imaging and Vision. 2004;20:179–200. [Google Scholar]
- 5.Joshi A, Leahy R, Toga AW, Shattuck D. A framework for brain registration via simultaneous surface and volume flow. IPMI 2009, LNCS 5636. 2009:576–588. doi: 10.1007/978-3-642-02498-6_48. [DOI] [PMC free article] [PubMed] [Google Scholar]
- 6.Lui T, Shen D, Davatzikos C. Deformable registration of cortical structures via hybrid volumetric and surface warping. NeuroImage. 2004;22:1790–1801. doi: 10.1016/j.neuroimage.2004.04.020. [DOI] [PubMed] [Google Scholar]
- 7.Postelinicu G, Zollei L, Fischl B. Combined volumetric and surface registration. IEEE Transactions on Medical Imaging. 2009;28(4):508–522. doi: 10.1109/TMI.2008.2004426. [DOI] [PMC free article] [PubMed] [Google Scholar]
- 8.Qui A, Albert M, Younes L, Miller MI. Time sequence diffeomorphic metric mapping and parallel transport track time-dependent shape changes. NeuroImage. 2009;45:S51–S60. doi: 10.1016/j.neuroimage.2008.10.039. [DOI] [PMC free article] [PubMed] [Google Scholar]
- 9.Litke N, Droske M, Rumpf M, Schroder P. An image processing approach to surface matching; Eurographics Symposium on Geometry Processing Vienna, Austria; 2005. [Google Scholar]
- 10.Shi Y, Thompson PM, Dinov I, Osher S, Toga AW. Direct cortical mapping via solving partial differential equations on implicit surfaces. Medical Image Analysis. 2007;11:207–223. doi: 10.1016/j.media.2007.02.001. [DOI] [PMC free article] [PubMed] [Google Scholar]
- 11.Oguz I, Cates J, Fletcher T, Whitaker R, Cool D, Aylward S, Styner M. Cortical correspondence using entropy-based particle systems and local features; Proceedings of the 5th IEEE International Symposium on Biomedical Imaging: From Nano to Macro; 2008. pp. 1637–1640. [Google Scholar]
- 12.Terzopoulos D, Platt J, Barr A, Fleischer K. Elastically deformable models. Computer Graphics. 1987;21(4):205–214. [Google Scholar]
- 13.Thompson PM, Toga AW. A surface-based technique for warping three-dimensional images of the brain. IEEE Transactions on Medical Imaging. 1996;15(4):402–417. doi: 10.1109/42.511745. [DOI] [PubMed] [Google Scholar]
- 14.Vaillant M, Glaunes J. Surface matching via currents. Information Processing for Medical ImagingCO. 2005 doi: 10.1007/11505730_32. [DOI] [PubMed] [Google Scholar]
- 15.Van Essen DC, Drury HA, Dickson J, Harwell J, Hanlon D, Anderson CH. An integrated softweard suite for surface-based analyses of cerebral cortex. Journal of the American Medical Informatics. 2001;8(5):443–459. doi: 10.1136/jamia.2001.0080443. [DOI] [PMC free article] [PubMed] [Google Scholar]
- 16.Xue H, Srinivasan L, Jiang S, Rutherford M, Edwards AD, Rueckert D, Hajnal J. Longitudinal cortical registration for developing neonates. MICCAI 2007, Part II, LNCS. 2007:127–135. doi: 10.1007/978-3-540-75759-7_16. [DOI] [PubMed] [Google Scholar]
- 17.Yeo B, Sabuncu M, Vercauteren T, Ayache N, Fischl B, Golland P. Spherical demons: fast surface registration. MICCAI 2008, Part I, LNCS 5241. 2008:745–753. doi: 10.1007/978-3-540-85988-8_89. [DOI] [PMC free article] [PubMed] [Google Scholar]
- 18.Ogden RW. Non-linear elastic deformations. Mineola, NY: Dover Publications; 1984. [Google Scholar]
- 19.Taber LA. Nonlinear theory of elasticity: Applications in biomechanics. Singapore: World Scientific; 2004. [Google Scholar]
- 20.Holzapfel GA. Nonlinear solid mechanics: a continuum approach for engineering. West Sussox, England: John Wiley and Sons; 2000. [Google Scholar]
- 21.Bonnet J, Wood RD. Nonlinear continuum mechanics for finite element analysis. Cambridge: Cambridge University Press; 2008. [Google Scholar]
- 22.Szabo BA, Babuska I. Finite element analysis. New York: Wiley; 1991. [Google Scholar]
- 23.Filas BA, Knutsen AK, Bayly PV, Taber LA. A new method for measuring deformation of folding surfaces during morphogenesis. Journal of Biomechanical Engineering. 2008;130:061010–061011. 061019. doi: 10.1115/1.2979866. [DOI] [PMC free article] [PubMed] [Google Scholar]
- 24.Saad Y, Schultz MH. GMRES: A generalized minimal residual algorithm for solving nonsymmetric linear systems. SIAM Journal on Scientific and Statistical Computing. 1986;7:856–869. [Google Scholar]
- 25.Barnette AR, Neil JJ, Kroenke CD, Griffith JL, Epstein AA, Bayly PV, Knutsen AK, Inder TE. Characterization of brain development in the ferret via MRI. Pediatric Research. 2009;66(1):80–84. doi: 10.1203/PDR.0b013e3181a291d9. [DOI] [PMC free article] [PubMed] [Google Scholar]
- 26.Kroenke CD, Taber EN, Leigland LA, Knutsen AK, Bayly PV. Regional patterns of cerebral cortical differentiation determined by diffusion tensor MRI. Cerebral Cortex. 2009;19:2916–2929. doi: 10.1093/cercor/bhp061. [DOI] [PMC free article] [PubMed] [Google Scholar]


