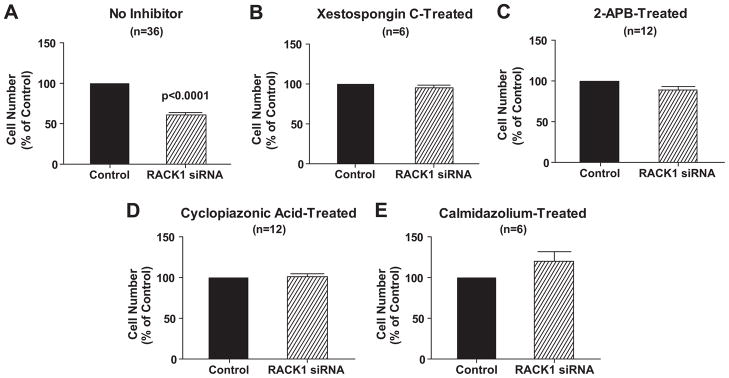
Figure 4.
Bar graph depicts effects of RACK1 siRNA versus negative control siRNA (Control) in preglomerular vascular smooth muscle cells on cell number under high serum (2.5%) conditions in the absence (panel A) and presence of xestospongin C (5 μM; panel B), 2-aminoethoxydiphenyl borate (2-APB, 100 μM; panel C), cyclopiazonic acid (5 μM; panel D) or calmdiazolium (1 μM; panel E). Cell numbers for RACK1 siRNA-treated are expressed as a % of the average cell number for corresponding Control cells (A: 209,375; B: 176,042; C: 118,229; D: 135,417; E 145,833). Values represent means ± SEM, and p-values are from unpaired Student’s t-test.

