

Abstract
Background
Deep brain stimulation (DBS) to the internal globus pallidus is an effective treatment for primary dystonia. The optimal clinical effect often occurs only weeks to months after starting stimulation. To better understand the underlying electrophysiological changes in this period we assessed longitudinally two pathophysiological markers of dystonia in patients prior to and in the early treatment period (1,3,6 months) after DBS-surgery.
Methods
Transcranial magnetic stimulation was used to track changes in short latency intracortical inhibition (SICI), a measure of excitability of GABAA-ergic corticocortical connections and long-term potentiation-like synaptic plasticity (as a response to paired associative stimulation, PAS). DBS remained ON for the duration of the study.
Results
Prior to surgery, inhibition was reduced and plasticity increased in patients compared to healthy controls. Following surgery and commencement of DBS, SICI increased towards normal levels over the following months with the same monotonic time course as the patients' clinical benefit. In contrast, synaptic plasticity changed rapidly following a non-monotonic time course: it was absent early (1 month) after surgery, and then over the following months increased towards levels observed in healthy individuals.
Conclusion
We postulate that before surgery pre-existing high levels of plasticity form strong memories of dystonic movement patterns. When DBS is turned ON, it disrupts abnormal basal ganglia signals resulting in the absent response to PAS at one month. Clinical benefit is delayed because engrams of abnormal movement persist and take time to normalise. Our observations suggest that plasticity may be a driver of long term therapeutic effects of DBS in dystonia.
Keywords: dystonia, deep brain stimulation, plasticity, longitudinal, human, excitability, mechanism
Introduction
Although medical treatment options for dystonia are limited, surgical intervention with deep brain stimulation (DBS) to the globus pallidus internus (GPi) can be highly effective.1 DBS of the same region is also successful in Parkinson's disease, particularly in patients with drug-induced dyskinesias. Similar parameters of stimulation are used in both conditions, yet in Parkinson's disease the maximal clinical response occurs within hours of switching ON the device, whereas it can take weeks or months to achieve maximal clinical benefit in dystonia2,3,4. We investigated possible mechanisms for the slow time course by examining longitudinal changes in two electrophysiological measures that are often reported to be abnormal in dystonia: short latency intracortical inhibition (SICI), a measure of excitability of GABAA-ergic corticocortical connections and long-term potentiation (LTP)-like synaptic plasticity in the cortex, which can be quantified as the response to paired associative stimulation (PAS)5,6. It is more difficult to evoke inhibition in dystonia compared with healthy controls7–12 whereas plasticity is increased13–17. Reduced inhibition may contribute to the excessive muscle activity and overflow characteristic of dystonia. Excess LTP-like plasticity might lead to the formation of inappropriate connections between inputs and outputs in the motor system that are difficult to correct, and which accumulate over time to cause excess involuntary movement.
On starting DBS spinal reciprocal inhibition and blink reflex inhibition, which are also reduced in dystonia, normalize progressively over six months in parallel with clinical improvement3,4. At 6 months, when clinical effects had reached a plateau, a companion cross-sectional study examined how LTP-like plasticity (assessed with the PAS protocol) was affected by turning OFF DBS18. With DBS turned ON, plasticity was less than normal; with DBS OFF plasticity increased towards normal. Pre-DBS plasticity levels had not been measured in these patients. The speculation was that 6 months continuous DBS had reduced the expected excess plasticity typical of dystonia.
The aim of the present longitudinal study in primary dystonia patients was to test: (1) whether continuous DBS reduces excess pre-surgical levels of plasticity; (2) whether the reduction in PAS induced plasticity follows the same time course as clinical improvement; and (3) whether motor cortical inhibition behaves in the same way as spinal reciprocal and blink reflex inhibition.
In contrast to the progressive time course of effects on clinical status and inhibition, we find that DBS treatment quickly abolishes the effects of PAS induced plasticity and that it then recovers slowly towards normal levels at 6 months. The findings provide the basis for a hypothesis to explain the progressive build-up of clinical improvement with DBS in dystonia.
Methods
Subjects
Data were available from 8 primary dystonia patients (six female, mean age 45.3 years, SD 11.9)(see table 1). Normative data on these measures are widely available, but were confirmed here in a series of age matched controls (see supplementary material). Participants gave written informed consent. No patient or subject experienced adverse events due to the TMS procedure. Following stimulation, implanted pulse generator (IPG) parameters, impedance, current drain and the number of activations were rechecked and confirmed to be unchanged. Research was approved by the Research Ethics Committee of the Institute of Neurology. Experiments conformed with the Declaration of Helsinki.
Table 1.
Clinical patient data
| patient | gender | age (decade) | duration (years) | DYT1-status | distribution | medication | DBS setting (all monopolar) | electrode position |
|---|---|---|---|---|---|---|---|---|
| 1 | w | 4 | 28 | + | generalized | none | L:0- and 1-,3.5V,60μsec,130Hz; R:4- and 5-,3.5V,60μsec,130Hz |
L: GPi R: GPi |
| 2 | w | 5 | 20 | − | neck, L+R UL, trunk, L+R LL | Benzhexol | L:0-,3.5V,120μsec,130Hz; R:4-,3.5V,120μsec,130Hz |
L: GPi R: GPi |
| 3 | w | 3 | 16 | − | generalized | Benzhexol | L:0-,3.1V,60μsec,130Hz; R:5-,2.6V,90μsec,130Hz |
L: GPi R: GPi |
| 4 | w | 6 | 21 | − | face, neck, L prox. UL, trunk | none | L:1-,3.2V,60μsec,130Hz; R:5-,3.2V,60μsec,130Hz |
L: GPi R: GPi |
| 5 | w | 5 | 35 | − | face, neck, trunk | Benzhexol | L:0-,3.6V,60μsec,130Hz; R:4-,3.6V,60μsec,130Hz |
L: GPi R: GPi |
| 6 | m | 5 | 20 | − | face, neck, trunk, R UL | none | L:0- and 1-, 1.8V, 60μsec,130Hz; R:4-,2.9V,60μsec,130Hz |
L: GPi R: GPi |
| 7 | w | 7 | 20 | − | neck | none | L:0-,2.2V,60μsec,130Hz; R:4-,2.2V,60μsec,130Hz |
L: GPi R: GPi |
| 8 | m | 4 | 8 | − | neck | Citalopram | L:1-,2.6V,60μsec,130Hz; R:5-,2.6V,60μsec,130Hz |
L: GPi R: GPi |
LL=lower limb, UL=upper limb
Deep brain stimulation and clinical scoring
DBS was implanted according to standard surgical techniques (see supplementary material). DBS electrode model 3389 and Kinetra model 7428 implanted pulse generator (Medtronic Neurological Divison, Minneapolis, USA) were used. Electrophysiological and clinical data were acquired before surgery and at one, three and six months after surgery. Continuous DBS (see table 1) was started after surgery with parameters chosen to obtain the best clinical effect in the absence of unwanted side effects. Medication remained unchanged and DBS switched ON for the duration of the study. Postoperative Magnetic Resonance Imaging confirmed the active contact to be located in GPi. Electrophysiological recordings consisted of intracortical excitability measures (see below) and PAS induced plasticity. An assessment earlier than 1 month post surgery was considered inappropriate, mainly because of patient discomfort due to scar tissue. Clinical assessment followed the movement section of the Burke-Fahn-Marsden (BFM) dystonia rating scale and was blinded for electrophysiological results.19
Transcranial magnetic stimulation (TMS)
Subjects were seated comfortably in an armchair. Forearms rested on a pillow. Hand muscles were relaxed. Trials contaminated by background activity were excluded from further analysis (prestimulus electromyography (EMG) silence was monitored online audiovisually). TMS was performed using two Magstim 200 stimulators and a figure-of-eight shaped coil, external wing diameter 9 cm (Magstim, Dyfed, UK). The coil handle was pointing posteriorly and laterally, ~ 45° to the sagittal midline, to evoke an anteriorly directed current in the brain. Magnetic stimuli were delivered at the optimal scalp site for evoking motor evoked potentials (MEPs) in the target muscle. Several studies so far have combined single pulse TMS and DBS without reporting adverse events18,20,21. TMS can induce an electrical current in the DBS leads which is capable of activating structures around the DBS contacts, and can for example, with DBS implantation in the subthalamic nucleus (STN) stimulate corticospinal fibres ventral to the STN. In the present case, DBS was implanted in GPi, where this is unlikely to occur. If the coil is positioned directly over the IPG it can potentially damage the IPG. Physical shielding was fastened over the implanted pulse generator (IPG) in order to avoid close range exposure to damaging magnetic flux20.
Recording techniques
Surface electromyographic activity (EMG) was recorded using a belly-tendon-montage from the first dorsal interosseous (FDI) muscle for short latency intracortical inhibition (SICI), and from the abductor pollicis brevis muscle (APB), first dorsal interosseous (FDI) and abductor digiti minimi muscles (ADM) for PAS. Raw signals were amplified and filtered with a band - pass filter of 3 Hz to 2 kHz (Digitimer Ltd.). Signals were sampled using a CED Power 1401 interface (Cambridge Electronic design, Cambridge, UK) at 5 kHz and stored on a computer for off-line analysis.
Experimental procedures
To aid comparison with previous studies, SICI was evaluated in the FDI muscle of the dominant (right in all but one patient) or less affected hand of clearly asymmetric patients. As in previous studies PAS was evaluated in the APB muscle contralateral to the side of the IPG implant (left) in order to eliminate the risk of inadvertent damage to the IPG from the TMS pulses (see section above) and to improve comparability with previous studies18. Recordings were done at rest, verified in each trial by examination of prestimulus levels of EMG.
Input-output curves (I/O curves) of the FDI and the APB (before and after PAS) were recorded separately. 5 MEPs were evoked22 at each stimulus intensity from 20–80% (steps of 10%) of maximum stimulator output, as described by others18, 21.
SICI followed the protocol of Kujirai et al.23. Interstimulus intervals (ISI) of 2 and 3 ms were used. The test pulse intensity was adjusted to produce an MEP of ~1mV when given alone. The intensity of the conditioning stimulus was 80% of active motor threshold (AMT), defined as the lowest intensity able to evoke an MEP of >200 μV during a minimal background contraction of 5–10% maximal voluntary contraction (MVC). For each experimental condition, randomly intermixed conditions (2 double-pulse conditions plus single test pulse) were presented 12 times each. The intertrial interval was ~5 s. Movements made the pre-surgical data of one patient of insufficient quality; this subject's data was removed from the final analysis.
Paired associative stimulation (PAS)
The median nerve was electrically stimulated at the wrist with 0.2 ms pulses (constant current stimulator, DS7A; Digitimer, Welwyn, UK) at 3× perceptual threshold. Each stimulus was followed 25 ms later by a TMS pulse over the contralateral motor cortex “hot spot” for APB at an intensity that when given alone produced a 1 mV MEP5,6. 200 pairs of stimuli were delivered at a rate of 0.25 Hz. Patients were instructed to focus on the APB muscle as described by others18. 30 MEPs to single TMS pulses were recorded before, immediately after, 15 and 30 min after PAS, as described by others18, 24. The PAS effect in each individual was defined as the mean MEP amplitude at the time of the maximum PAS effect expressed as a percentage of the pre-PAS baseline.
Statistical Analysis
Peak to peak MEP amplitudes were measured and averaged. For PAS data MEP amplitudes after PAS were normalized to the pre PAS amplitude. Repeated measures ANOVAs (rmANOVA) were performed with additional posthoc analysis including correction for multiple comparisons where appropriate. Normal distribution was confirmed and data were checked for non-sphericity. I/O-curves were analysed using 3-way rmANOVA with main factors of TIME, PRE/POST-PAS and STIMULUS INTENSITY (data for 30–80% maximum stimulator output). The relationship between clinical and electrophysiological data was tested using Spearman's correlation coefficient. To be able to compare the time courses of SICI and PAS-effects on DBS the percentage measures of SICI and PAS-data at all assessments were transformed into z-scores, which were further analysed using rmANOVA. A p-value <0.05 was considered significant.
Results
Clinical Scores
BFM scores declined monotonically by about 50% over the 6 months of DBS treatment (see also1,3,4). Our first formal assessment was at 1 month, but as reported by others25 informal patient contact confirmed no abrupt improvement prior to this time.
Motor Cortex Excitability
There were no significant changes in resting or active motor thresholds or in I/O curves pre and post-implantation (see data from FDI in figure 1, statistical results in figure legend and table 2). Pre-implantation measures did not differ from healthy controls (see supplementary material).
Figure 1. DBS effect on cortico-spinal excitability.

Top: Active and resting motor thresholds (AMT and RMT) of both hemispheres for the contralateral FDI muscle at each time of assessment. There were no significant changes in resting or active motor thresholds pre and post-implantation. Error bars indicate SE. One way rmANOVAs with main factor TIME gave: RMT left: F(3,21)=0.57, p>0.5; right: F(3,21)=1.0, p>0.1. AMT left: F(3,21)=0.21, p>0.5; right: F(3,21)=1.0, p>0.1.
Bottom: Average I/O curves for the dominant FDI muscle at each of the 4 times of assessment (pre-surgery, one, three and six months after surgery). The x-axis shows TMS stimulator intensity as percent of maximum stimulator output. The y-axis shows peak-to-peak amplitude of the MEP evoked in the FDI muscle. There was no change in I/O curves over the times of assessment. A two way rmANOVA with TIME and INTENSITY as main factors did not reveal a significant change for TIME, F(3,21)=0.44, p>0.5 nor significant TIME × INTENSITY interaction, F(15,105)=0.61, p>0.5. As expected, there was a significant main effect of STIMULUS INTENSITY, F (5,35)=21.72, p<0.001. Although mean data from all patients are shown, the statistics were repeated measures in each individual, so that minor differences in thresholds between individuals which could smooth the mean I/O curves, are taken into account.
Table 2.
Motor thresholds (as percentage maximum stimulator output; mean ± SE)
| Left hemisphere | Right hemisphere | ||
|---|---|---|---|
|
| |||
| RMT | PreDBS | 44.9 ± 3.7 | 43.1 ± 2.3 |
| 1 month | 42.1 ± 3.2 | 40.7 ± 3.0 | |
| 3 months | 43.9 ± 2.0 | 41.6 ± 1.9 | |
| 6months | 41.9 ± 2.6 | 44.8 ± 2.8 | |
|
| |||
| AMT | PreDBS | 35.1 ± 1.9 | 33.9 ± 2.1 |
| 1 month | 35.1 ± 3.0 | 31.2 ± 2.3 | |
| 3 months | 34.2 ±; 1.9 | 33.2 ± 2.0 | |
| 6 months | 33.5 ± 2.0 | 35.8 ± 1.9 | |
Short interval intracortical inhibition (Figure 2B)
Figure 2.
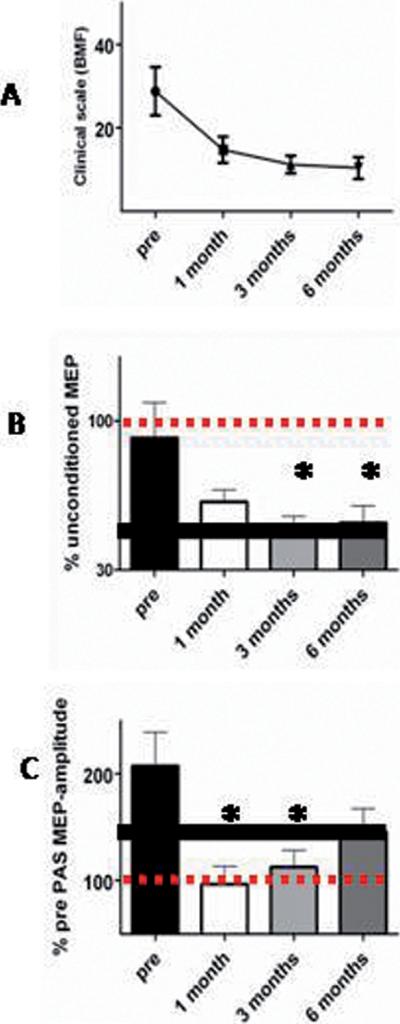
Time courses of the DBS effect on dystonia, plasticity and inhibition A: clinical time course of recovery after onset of DBS. B: monotonic time course of inhibition. C: non-monotonic time course of the PAS effect in APB. Comparison of the graphs in B and C shows that PAS-induced plasticity is absent early in DBS treatment while there is a progressive recovery of inhibition. Comparison of graphs in A and B suggests the close relationship of inhibitory circuit activity and clinical dystonic symptoms. The bold horizontal black lines in B and C indicate values seen in healthy subjects (see supplementary material). Error bars indicate SE.
SICI was less effective than normal prior to surgery (see supplementary material). Following onset of DBS, SICI increased monotonically towards the level seen in healthy individuals. There was no difference between the data for ISI 2 and 3 ms (F(1,12)=0.65, p>0.1). Therefore data were pooled for further analysis. 1-way rmANOVA revealed a significant main effect of TIME (F(3,39)=5.0, p<0.005). Posthoc tests showed significant differences between pre-surgery values and those at 3 and 6 months (p<0.01 and p<0.05 respectively).
Paired Associative Stimulation (Figures 2C, 3)
Pre-surgery, the response to PAS in the APB muscle was larger than normal. In contrast to the monotonic time course of improvement in SICI, it was dramatically reduced/absent at 1 month post-surgery, and then increased towards normal levels by 6 months. 1-way rmANOVA confirmed a significant effect of TIME (F(3,21)=4.1, p<0.05). Posthoc analysis showed that pre-surgical values differed from those at 1 and 3 months (p<0.05 for both).
I/O curves were constructed before and after PAS at each assessment. As in FDI, baseline I/O curves in APB were the same at each time point. Before surgery, PAS increased I/O curves, but this disappeared after 1 month DBS treatment (see pre-operative and 1 month data in Fig 3; statistical summary in legend). Pre-surgery, PAS produced clear facilitation in FDI and ADM muscles as well as APB; this abnormal topography was not restored by DBS (see Fig 4 and legend for statistical results).
Figure 3. DBS effect on PAS induced plasticity.

Comparison of the effect of PAS on the mean I/O curves in APB before (top) and at 1 month after (bottom) surgery. The x-axis shows the TMS intensity as a percentage of maximum stimulator output. The y-axis shows the peak-to-peak amplitude of the MEP evoked in the APB muscle. Note that PAS has a clear effect on the I/O curve before surgery but not at one month later. The vertical and horizontal lines at 1 mV indicate the effect this change would have had on the amplitude of the MEP evoked before and after PAS.
A 3-way rmANOVA with TIME (pre, 1, 3 and 6 months), PRE/POST-PAS and STIMULUS INTENSITY as main factors showed a significant main effect of STIMULUS INTENSITY (F(5,35)=29.1, p<0.001), but not of TIME (F(3,21)=1.13, p>0.1) or PRE/POST-PAS (F(1,7)=4.1, p>0.05). There was a significant interaction between TIME and PRE/POST-PAS (F(3,21)=5.10, p<0.01). This was mainly due to the increase of the input-output curve after PAS in the pre-surgery condition. Finally we compared the baseline I/O curves (pre-PAS) at each TIME point: a 2-way rmANOVA showed a significant effect of STIMULUS INTENSITY (F(5,35)=27.8, p<0.001 but no effect of TIME (F(3,21)=1.3, p>0.1) and no significant interactions (F(15,105)=1.16, p>0.1). Thus, as with the FDI muscle, there was no change in baseline I/O curves after surgery.
Figure 4. DBS and the topographic specificity of PAS induced plasticity.

The effect of PAS on MEPs in three hand muscles (APB, the homotopic muscle; and ADM and FDI, the heterotopic muscles) in patients before and after starting DBS. In healthy individuals, median nerve PAS produces little effect on responses in non-median nerve innervated muscles (heterotopic). In contrast in dystonia (as reproduced here), the effects are of similar magnitude as in the APB (homotopic): PAS increases MEPs in all three muscles prior to DBS. After starting DBS, all three muscles behave in the same way. This was confirmed in a 2-way rmANOVA with TIME and MUSCLE as main factors. There was a significant effect of TIME (F(3,21)=7.24, p<0.005), but no effect of MUSCLE (F(2,14)=0.22, p>0.5) and no significant interaction (F(6,42)=0.20, p>0.5). Post hoc analysis for the effect of TIME confirmed a significant difference between T1 and T2 (p<0.005) and T1 and T3 (p<0.005) and a borderline significance for comparison of T1 and T4 (p=0.05). The graph illustrates that DBS treatment over 6 months does not normalize the abnormal topography usually seen in dystonia.
Comparison of the time course of DBS effects on PAS and SICI
SICI and PAS data were transformed into z-scores and their time courses compared with a 2-way ANOVA with GROUP (SICI/PAS-effect) as between factor and TIME as a repeated measure. The significant effect of GROUP (F(1,20)=31.62, p<0.001) and the GROUP X TIME interaction (F(3,60)=2.88, p<0.05), confirmed the different time course of DBS effects (see supplementary Fig).
Correlation with clinical effects
Changes in the BFM clinical score correlated with changes in SICI (Spearman's Rho=0.4, p<0.05) but not with changes in PAS (Spearman's Rho=0.3, p>0.05).
Discussion
Monotonic versus non-monotonic effects of DBS on dystonia, SICI and PAS-induced plasticity
SICI, a GABAA-ergic form of motor cortical inhibition, was less effective in patients pre-surgery than in healthy controls (see8,11). It progressively became more effective on DBS, changing with the same monotonic time course as the clinical scores. This extends previous studies on spinal reciprocal inhibition and blink reflex inhibition, which also normalise gradually after onset of DBS3,4. The novel data concern the effect of DBS on PAS-induced synaptic plasticity. Patients had an increased LTP-like response to the plasticity protocol before implantation (see13,26,27). DBS restored this towards normal with a non-monotonic time course: the response to PAS was virtually abolished at 1 month, and then increased towards values seen in healthy individuals over the next months.
I/O curves and thresholds do not change
Like others we found that resting and active motor thresholds (e.g.8,28) and I/O curves measured at rest24 are normal in patients with dystonia. Importantly these did not change after onset of DBS in the present study. Neurones in the GPi have inhibitory projections to thalamic relay nuclei and hence to cortex. They have high tonic discharge rates in the resting state and have been assumed in many models of basal ganglia function to provide an important influence on the excitability of sensorimotor areas of cortex (see also29,30). Chronic GPi DBS might therefore be expected to influence this output and change cortical excitability. In fact, the present data show that there was no change over time in either motor thresholds or I/O curves, suggesting that cortico-spinal excitability remains constant.
In chronically treated patients with DBS the slope of the I/O curve decreases when DBS is transiently turned OFF18,21. The present data suggest that this is not because DBS increases excitability when switched ON, since there was no change in the I/O curves in our patients pre and post implantation. Instead it seems likely, as suggested by others18,21, that DBS leads to long term changes in motor cortex such that when the stimulation is transiently removed, excitability falls.
Short interval intracortical inhibition (SICI)
In contrast to its lack of influence on excitatory motor outputs, GPi DBS has striking effects on measures of inhibition. SICI (this study), spinal Ia-reciprocal inhibition and blink reflex recovery curves3,4 all normalise progressively after starting DBS. The monotonic time course of these effects correlates well with clinical recovery, but whether one causes the other or whether clinical and electrophysiological effects are secondary to a common intermediary is unknown. Whatever the explanation, the data emphasise the broad range of effects that are a consequence of pallidal DBS from systems in spinal cord (reciprocal inhibition) to brainstem (blink reflex recovery) and cortex (SICI).
Paired Associative Stimulation (PAS) induced LTP-like plasticity
We used an excitatory form of PAS that is thought to increase corticospinal excitability via an NMDA-dependent facilitation of synapses in the motor cortex. As reported by others the response to PAS was increased in patients prior to surgery compared with healthy individuals13, 24, 27.
A previous cross-sectional study18 found that patients stimulated with DBS for 6 months had a smaller response to PAS than normal. These patients had not been studied preoperatively and therefore it was impossible to conclude whether DBS had long term effects on synaptic plasticity. The present data clarify this question and show that DBS does indeed have a long term effect in reducing excessive plasticity. More importantly they show that the effect occurs relatively quickly: enhanced pre-operative plasticity is absent 1 month later, and only approaches healthy control levels over the next months (non-monotonic time course). Interestingly, these effects were seen in ADM and FDI as well as APB, suggesting that the pathological spread to heterotopic ulnar nerve-innervated muscles is not normalized by DBS. This could indicate a failure of DBS to restore an input-output organisation seen in healthy individuals, although its clinical relevance awaits clarification.
All patients in this study had primary dystonia. Since all were treated with bilateral chronic stimulation of the GPi, it is likely that they would respond in a similar way to continuous DBS. However, symptoms were variable (different distribution, age at onset, duration) but the relatively small number of patients did not allow subgroup analysis in order to estimate whether the observed effects were more prominent in certain forms of dystonia.
Responses to PAS after 3 months DBS in our longitudinal design were very comparable with those in patients studied previously by Tisch et al. (2007) at 6 months. However, the present patients at 6 months had a larger PAS response than those in Tisch et al.. This suggests that there may be some “jitter” in the time course of DBS effects on PAS induced plasticity in different individuals. Further, there were several differences in the patients who participated in the two studies including the proportion with generalised dystonia or with the DYT1-gene mutation. Further studies may identify other factors that contribute to individual variation of DBS responses following chronic stimulation.
Time course of DBS effects
The time course of the DBS effect on LTP-like effects of PAS (an early maximum reduction followed by gradual re-increase towards normal) differed from the monotonic time course of its effects on SICI/clinical symptoms. Moreover, the effects on plasticity did not correlate significantly with the changes in clinical scores, while the effects on inhibition did. At first sight this dissociation is odd given the association between excessive plasticity and dystonia in many studies. The explanation may relate to the way in which excessive plasticity contributes to dystonia. Previous authors have suggested that enhanced plasticity causes inappropriate connections between sensorimotor inputs and outputs that are difficult to correct and lead to excess and involuntary movements15. If so, then removing excess plasticity might have little immediate effect on dystonic movements since the abnormal connections have already been “learnt” and take time to correct.
In fact, this possibility may be directly relevant to the progressive time course of DBS effects in the majority of dystonia patients. We suggest the following hypothesis: abnormal outputs from the basal ganglia produce movement patterns characterised by excess muscle activity and reduced excitability of inhibitory circuits. They also increase the sensitivity of synaptic plasticity in sensorimotor circuits and it is well known that neuronal oscillations facilitate cortical plasticity31. Over time, these dystonic patterns of output become strongly reinforced and established as motor programs. When DBS is turned ON we suggest that it acts quickly, as in Parkinson's disease, to remove abnormal basal ganglia signals, but that clinical improvement is delayed because of the persisting “memory” of abnormal movement patterns. It takes time to erase or “forget” these programs and to restore more normal movements, accounting for the gradual improvement in clinical scores and motor inhibition that is observed.
The theory may also be consistent with the transient effects of stopping and restarting DBS after maximum clinical improvement has been achieved. In a recent study when DBS was turned OFF, symptoms declined, with the majority of patients returning to pre-surgical levels in the following hours or days32. Switching DBS back ON restored clinical improvement very quickly in contrast to the slow build up of benefit at the initial start of DBS treatment. Perhaps if DBS is not turned OFF for too long, the system does not have enough time to re-establish engrams of the abnormal patterns; symptoms therefore disappear quickly when DBS is turned ON again.
The present observations may be of general importance for our understanding of DBS effects and future longitudinal studies may help us better to predict the individual response to DBS treatment.
Supplementary Material
Acknowledgments
Acknowledgements/financial disclosure: DR was funded by Action Medical Research and the Dystonia Medical Research Foundation (DMRF). ST was funded by Action Medical Research, the Brain Research Trust, Medtronic UK and the Parkinson's Appeal. PL, LZ, MH were supported by the Parkinson's Appeal. LZ, MH received occasional honoraria from industry for educational talks at meetings. KPB: honoraria/financial support to speak/attend meetings from GSK, Boehringer-Ingelheim, Ipsen, Merz, and Orion pharma companies. Grants by the Dystonia Society UK and the Halley Stewart Trust. The work was undertaken at UCLH/UCL who received a proportion of funding from the Department of Health's NIHR Biomedical Research Centres funding scheme. Work of the group was further supported by a grant from Medtronic and by the National Institutes of Health under Grant RO1-NS40902 (PI:DC), and by the Medical Research Council UK.
Abbreviations
- AMT
active motor threshold
- ADM
abductor digiti minimi
- APB
abductor pollicis brevis
- DBS
deep brain stimulation
- m
months
- FDI
first dorsal interosseus
- I/O
input-output
- GPi
internal Globus pallidus
- MEP
Motor Evoked Potential
- PAS
paired associative stimulation
- rmANOVA
repeated measures ANOVA
- RMT
resting motor threshold
- SE
standard error of the mean
- SICI
short-interval intracortical inhibition
- 1m
1 month time point
- 3m
3 months time point
- 6m
6 months time point
- TMS
transcranial magnetic stimulation
References
- 1.Cif L, Vasques X, Gonzalez V, et al. Long-term follow-up of DYT1 dystonia patients treated by deep brain stimulation: an open-label study. Mov Disord. 2010;25(3):289–299. doi: 10.1002/mds.22802. [DOI] [PubMed] [Google Scholar]
- 2.Hammond C, Ammari R, Bioulac B, Garcia L. Latest view on the mechanism of action of deep brain stimulation. Mov Disord. 2008;23(15):2111–2121. doi: 10.1002/mds.22120. [DOI] [PubMed] [Google Scholar]
- 3.Tisch S, Limousin P, Rothwell JC, et al. Changes in forearm reciprocal inhibition following pallidal stimulation for dystonia. Neurology. 2006;66(7):1091–1093. doi: 10.1212/01.wnl.0000204649.36458.8f. [DOI] [PubMed] [Google Scholar]
- 4.Tisch S, Limousin P, Rothwell JC, et al. Changes in blink reflex excitability after globus pallidus internus stimulation for dystonia. Mov Disord. 2006;21(10):1650–1655. doi: 10.1002/mds.20899. [DOI] [PubMed] [Google Scholar]
- 5.Stefan K, Kunesch E, Cohen LG, Benecke R, Classen J. Induction of plasticity in the human motor cortex by paired associative stimulation. Brain. 2000;123(Pt 3):572–584. doi: 10.1093/brain/123.3.572. [DOI] [PubMed] [Google Scholar]
- 6.Ziemann U, Ilic TV, Pauli C, Meintzschel F, Ruge D. Learning modifies subsequent induction of long-term potentiation-like and long-term depression-like plasticity in human motor cortex. J Neurosci. 2004;24(7):1666–1672. doi: 10.1523/JNEUROSCI.5016-03.2004. [DOI] [PMC free article] [PubMed] [Google Scholar]
- 7.Tinazzi M, Rosso T, Fiaschi A. Role of the somatosensory system in primary dystonia. Mov Disord. 2003;18(6):605–622. doi: 10.1002/mds.10398. [DOI] [PubMed] [Google Scholar]
- 8.Sommer M, Ruge D, Tergau F, Beuche W, Altenmuller E, Paulus W. Intracortical excitability in the hand motor representation in hand dystonia and blepharospasm. Mov Disord. 2002;17(5):1017–1025. doi: 10.1002/mds.10205. [DOI] [PubMed] [Google Scholar]
- 9.Berardelli A, Rothwell JC, Day BL, Marsden CD. Pathophysiology of blepharospasm and oromandibular dystonia. Brain. 1985;108(Pt 3):593–608. doi: 10.1093/brain/108.3.593. [DOI] [PubMed] [Google Scholar]
- 10.Nakashima K, Rothwell JC, Day BL, Thompson PD, Shannon K, Marsden CD. Reciprocal inhibition between forearm muscles in patients with writer's cramp and other occupational cramps, symptomatic hemidystonia and hemiparesis due to stroke. Brain. 1989;112(Pt 3):681–697. doi: 10.1093/brain/112.3.681. [DOI] [PubMed] [Google Scholar]
- 11.Ridding MC, Sheean G, Rothwell JC, Inzelberg R, Kujirai T. Changes in the balance between motor cortical excitation and inhibition in focal, task specific dystonia. J Neurol Neurosurg Psychiatry. 1995;59(5):493–498. doi: 10.1136/jnnp.59.5.493. [DOI] [PMC free article] [PubMed] [Google Scholar]
- 12.Molloy FM, Carr TD, Zeuner KE, Dambrosia JM, Hallett M. Abnormalities of spatial discrimination in focal and generalized dystonia. Brain. 2003;126(Pt 10):2175–2182. doi: 10.1093/brain/awg219. [DOI] [PubMed] [Google Scholar]
- 13.Weise D, Schramm A, Stefan K, et al. The two sides of associative plasticity in writer's cramp. Brain. 2006;129(Pt 10):2709–2721. doi: 10.1093/brain/awl221. [DOI] [PubMed] [Google Scholar]
- 14.Edwards MJ, Huang YZ, Mir P, Rothwell JC, Bhatia KP. Abnormalities in motor cortical plasticity differentiate manifesting and nonmanifesting DYT1 carriers. Mov Disord. 2006;21(12):2181–2186. doi: 10.1002/mds.21160. [DOI] [PubMed] [Google Scholar]
- 15.Quartarone A, Siebner HR, Rothwell JC. Task-specific hand dystonia: can too much plasticity be bad for you? Trends Neurosci. 2006;29(4):192–199. doi: 10.1016/j.tins.2006.02.007. [DOI] [PubMed] [Google Scholar]
- 16.Quartarone A, Morgante F, Sant'angelo A, et al. Abnormal plasticity of sensorimotor circuits extends beyond the affected body part in focal dystonia. J Neurol Neurosurg Psychiatry. 2008;79(9):985–990. doi: 10.1136/jnnp.2007.121632. [DOI] [PubMed] [Google Scholar]
- 17.Kojovic M, Caronni A, Bologna M, Rothwell JC, Bhatia KP, Edwards MJ. Botulinum toxin injections reduce associative plasticity in patients with primary dystonia. Mov Disord. 2011 doi: 10.1002/mds.23681. [DOI] [PMC free article] [PubMed] [Google Scholar]
- 18.Tisch S, Rothwell JC, Bhatia KP, et al. Pallidal stimulation modifies after-effects of paired associative stimulation on motor cortex excitability in primary generalised dystonia. Exp Neurol. 2007;206(1):80–85. doi: 10.1016/j.expneurol.2007.03.027. [DOI] [PubMed] [Google Scholar]
- 19.Burke RE, Fahn S, Marsden CD, Bressman SB, Moskowitz C, Friedman J. Validity and reliability of a rating scale for the primary torsion dystonias. Neurology. 1985;35(1):73–77. doi: 10.1212/wnl.35.1.73. [DOI] [PubMed] [Google Scholar]
- 20.Kumar R, Chen R, Ashby P. Safety of transcranial magnetic stimulation in patients with implanted deep brain stimulators. Mov Disord. 1999;14(1):157–158. doi: 10.1002/1531-8257(199901)14:1<157::aid-mds1027>3.0.co;2-u. [DOI] [PubMed] [Google Scholar]
- 21.Kuhn AA, Meyer BU, Trottenberg T, Brandt SA, Schneider GH, Kupsch A. Modulation of motor cortex excitability by pallidal stimulation in patients with severe dystonia. Neurology. 2003;60(5):768–774. doi: 10.1212/01.wnl.0000044396.64752.4c. [DOI] [PubMed] [Google Scholar]
- 22.Schmidt S, Cichy RM, Kraft A, Brocke J, Irlbacher K, Brandt SA. An initial transient-state and reliable measures of corticospinal excitability in TMS studies. Clin Neurophysiol. 2009;120(5):987–993. doi: 10.1016/j.clinph.2009.02.164. [DOI] [PubMed] [Google Scholar]
- 23.Kujirai T, Caramia MD, Rothwell JC, et al. Corticocortical inhibition in human motor cortex. J Physiol. 1993;471:501–519. doi: 10.1113/jphysiol.1993.sp019912. [DOI] [PMC free article] [PubMed] [Google Scholar]
- 24.Schwingenschuh P, Ruge D, Edwards MJ, et al. Distinguishing SWEDDs patients with asymmetric resting tremor from Parkinson's disease: a clinical and electrophysiological study. Mov Disord. 2010;25(5):560–569. doi: 10.1002/mds.23019. [DOI] [PMC free article] [PubMed] [Google Scholar]
- 25.Krause M, Fogel W, Kloss M, Rasche D, Volkmann J, Tronnier V. Pallidal stimulation for dystonia. Neurosurgery. 2004;55(6):1361–1368. doi: 10.1227/01.neu.0000143331.86101.5e. discussion 1368–1370. [DOI] [PubMed] [Google Scholar]
- 26.Quartarone A, Bagnato S, Rizzo V, et al. Abnormal associative plasticity of the human motor cortex in writer's cramp. Brain. 2003;126(Pt 12):2586–2596. doi: 10.1093/brain/awg273. [DOI] [PubMed] [Google Scholar]
- 27.Quartarone A, Rizzo V, Terranova C, et al. Abnormal sensorimotor plasticity in organic but not in psychogenic dystonia. Brain. 2009;132(Pt 10):2871–2877. doi: 10.1093/brain/awp213. [DOI] [PMC free article] [PubMed] [Google Scholar]
- 28.Ikoma K, Samii A, Mercuri B, Wassermann EM, Hallett M. Abnormal cortical motor excitability in dystonia. Neurology. 1996;46(5):1371–1376. doi: 10.1212/wnl.46.5.1371. [DOI] [PubMed] [Google Scholar]
- 29.Perlmutter JS, Mink JW. Deep brain stimulation. Annu Rev Neurosci. 2006;29:229–257. doi: 10.1146/annurev.neuro.29.051605.112824. [DOI] [PMC free article] [PubMed] [Google Scholar]
- 30.Seung-Hyun J, Lin P, Sungyoung A, Hallett M. Abnormal functional connectivity in focal hand dystonia: Mutual information analysis in EEG. Mov Disord. 2011 doi: 10.1002/mds.23675. [DOI] [PMC free article] [PubMed] [Google Scholar]
- 31.Buzsaki G, Draguhn A. Neuronal oscillations in cortical networks. Science. 2004;304(5679):1926–1929. doi: 10.1126/science.1099745. [DOI] [PubMed] [Google Scholar]
- 32.Grabli D, Ewenczyk C, Coelho-Braga MC, et al. Interruption of deep brain stimulation of the globus pallidus in primary generalized dystonia. Mov Disord. 2009;24(16):2363–2369. doi: 10.1002/mds.22827. [DOI] [PubMed] [Google Scholar]
Associated Data
This section collects any data citations, data availability statements, or supplementary materials included in this article.