

Abstract
Aims
This study examined the extent to which the trajectory of participation in sports, athletics or exercising (PSAE) co-varied with substance use in early adulthood controlling for team sports participation using parallel process latent growth curve modeling.
Design, setting, and participants
Analysis of data collected from a series of panel studies using a cohort-sequential design. Specifically, the analyses used longitudinal data from 11,741 individuals from the graduating classes of 1986-2001, first surveyed as seniors in American high schools. Up to four additional follow-up surveys were administered through age 26. Data were collected using in-school and mailed self-administered questionnaires.
Measurements
Level of PSAE, past-30-day alcohol, cigarette, and marijuana use frequency, and any past-30-day use of illicit drugs other than marijuana (IOTM) were the main processes of interest. Self-reported race/ethnicity, college status at age 19/20, parental education, gender, and team sports participation during high school were included as covariates.
Findings
Results indicate that higher initial levels of PSAE related to lower initial substance use prevalence rates other than alcohol, and lower initial prevalence rates of substance use then corresponded with lower substance use rates throughout early adulthood. Further, as individuals increased PSAE levels throughout early adulthood, the frequency of their use of cigarettes, marijuana, and IOTM correspondingly decreased.
Conclusions
Increased PSAE related to significantly lower substance use frequency at modal age 18 and through significantly and negatively correlated growth trajectories through early adulthood. Encouraging PSAE among adolescents and early adults may relate to lower substance use levels throughout early adulthood.
Introduction
Use of physical activity in substance abuse prevention has been highlighted by the National Institute on Drug Abuse (NIDA)[1] and the National Institutes of Health[2,3]. Theory, neurobiology, and other research support a preventive and treatment effect of exercise on substance use[4-14]. However, NIDA has identified important knowledge gaps in this relationship including physical activity type, context, persistence and variation across the lifespan[15]. Individuals aged 18-25 are more likely than youth or older adults to use alcohol, tobacco, or illicit drugs[16]. Early adulthood transitions significantly affect a broad range of health outcomes[17] including substance use[18,19]. If physical activity significantly relates to young adult substance use, such information may strengthen prevention, reduction and treatment efforts.
Young adult physical activity and substance use research has focused primarily on sports participation. Cross-sectional studies have found sport participation—particularly team-based competitive sport participation—relates to increased alcohol use but lower cigarette and illegal drug use[20, 21]. Research examining non-sport-related exercise and substance use is less available. One cross-sectional study with U.S. adults in 24 states found that past-month leisure activity related to lower cigarette use and higher alcohol use[22]. Longitudinal studies including young adults also have focused on sports participation and generally have found positive relationships with alcohol use[23-26] and negative relationships with illicit drug or tobacco use[23,25]. Longitudinal research examining how general exercise relates to young adult substance use is unavailable.
Hypotheses related to team sports participation and substance use include both protective and risk-related factors[27]. If substance use varies significantly with physical activity, and if such variation is affected by exercise type, such information may strengthen substance abuse prevention and treatment efforts and identify at-risk populations. This study aims to assess the effect of exercise on substance use that is not due to sports participation by examining the co-variation of early adulthood trajectories of participation in sports, athletics, or exercising (PSAE) and past 30-day substance from modal ages 18 through 25/26, controlling for high school team sports participation.
Methods
Sample
The study utilizes data from the NIDA-sponsored Monitoring the Future (MTF) study[28]. Briefly, a nationally representative sample of approximately 15,000 high school seniors from about 130 schools is selected yearly. Self-administered classroom surveys are completed by students during a normal class period. A representative random sub-sample of 2,400 seniors is selected from each cohort for longitudinal follow-up; substance users are over-sampled (analyses include weighting to account for sampling procedures). Respondents are randomly divided with half surveyed in even-numbered years and half in odd-numbered years. Follow-up questionnaires are mailed in the spring with a modest monetary incentive. Overall response rates for the first follow-up (1-2 years past high school) average 56%; rates for the second through sixth follow-ups average 52%[28]. In order to reduce respondent burden but still obtain a wide variety of measures, MTF uses six different questionnaire forms; items on exercise participation are included on two forms. The current sample was limited to class cohorts from 1986 onwards when team sports participation was first measured, to individuals responding to the relevant questionnaire forms, and to cohorts with the potential to have participated in four follow-up surveys. Thus, analyses included individuals first surveyed as high school seniors from 1986-2001 with modal ages ranging from 18 (high school seniors) to 25/26 (completing follow-up four).
Measures
Past 30-Day substance use
Alcohol and marijuana use frequency were measured as 1=0 occasions, 2=1-2, 3=3-5, 4=6-9, 5=10-19, 6=20-39, 7=40+ occasions. Smoking frequency was measured as 1=not at all, 2=less than one cigarette per day, 3=1-5 cigarettes per day, 4=about ½ pack per day, 5=about 1 pack per day, 6=about 1 ½ packs per day, 7=2 packs or more per day. Any use of illicit drugs other than marijuana (IOTM) was a dichotomy indicating any use of one or more of: LSD, other hallucinogens, cocaine, heroin, other narcotics, amphetamines, barbiturates, or tranquilizers (because of the low use frequency for illicit drugs other than marijuana among this sample, a dichotomous use status measure was considered more appropriate than a mean use frequency measure).
Exercise participation
PSAE was measured by asking, “How often do you actively participate in sports, athletics or exercising” (1=never, 2=a few times a year, 3=once or twice a month, 4=at least once a week, 5=almost every day).
Control variables
Due to the complexity of the analytical models employed, a limited number of control measures were possible. Selected measures were chosen that (a) were clearly exogenous with respect to substance use and (b) have been shown to relate significantly to both exercise participation and substance use[28-33]. Gender, race/ethnicity, parental education, and school athletic team participation were used as time-invariant controls measured at modal age 18. Self-identified race/ethnicity was coded as White (1) versus non-White (0). Parental education (a proxy for family-of-origin socio-economic status) was a 5-point scale assessing educational attainment for father and mother. Team sports participation was measured by asking: “To what extent have you participated in athletic teams during this school year?” (1=not at all, 2=slight, 3=moderate, 4=considerable, 5=great). College status was measured at first follow-up (ages 19/20) and indicated being a full-time student either attending or with plans to graduate from a four-year program.
Analysis
Parallel process latent growth curve modeling was conducted using Mplus 6.1[34]. Mplus utilizes full-information maximum likelihood estimation and thus uses all available data[35,36]. Outcomes can include missing data and are modeled conditional on covariates; missing data on covariates are addressed by including covariates in the model (via modeling covariate means, thresholds or variances[37,38]). Piecewise models work particularly well for modeling longitudinal substance use[39,40] and were indicated for all processes. Two distinct time periods were identified: ages 18 to 21/22 (senior year through second follow-up) and ages 21/22 through 25/26 (second through fourth follow-up). Thus, three latent variables were used to model each process: an intercept, a linear slope for ages 18 through 21/22, and a linear slope for ages 21/22 through 25/26. The intercept denotes initial status at age 18; slopes denote growth rates[41].
Only one substance use outcome was modeled simultaneously with PSAE. Correlations between the respective latent factors for each process were modeled as well as direct effects of initial status on growth rate factors of the opposing process. All models used maximum likelihood estimation with robust standard errors. Alcohol, cigarette, and marijuana use were treated as normally distributed interval measures. While this assumption is clearly not valid, it is perhaps not unreasonable given the large sample size; moreover, care was taken to ensure that discussion of significance was limited to findings with p≤.01. For IOTM, the logistic model for categorical outcomes with a numerical integration algorithm was used[42]. Coefficients for processes other than IOTM are expressed as standardized linear regression estimates; IOTM results are expressed as standardized logits.
Figure 1 illustrates the final full multivariate model structure using past 30-day cigarette smoking. Model fit for the final alcohol/PSAE model improved significantly with the addition of a direct path from parental education to the first alcohol frequency slope. The final IOTM/PSAE model included the following specifications: team sports participation mean and variance were fixed (2.603 and 0.917, respectively) based on results from other multivariate models; the direct path between the PSAE intercept and second IOTM slope was removed. Further, IOTM models would not converge with inclusion of all five covariates; thus, two versions of the final model were run: one excluding team sports (but including the remaining four covariates), and one excluding parental education (but including the remaining four covariates). Excluding parental education was based on the multivariate model excluding team sports, where no significant direct path was found between parental education and the IOTM intercept.
Figure 1.
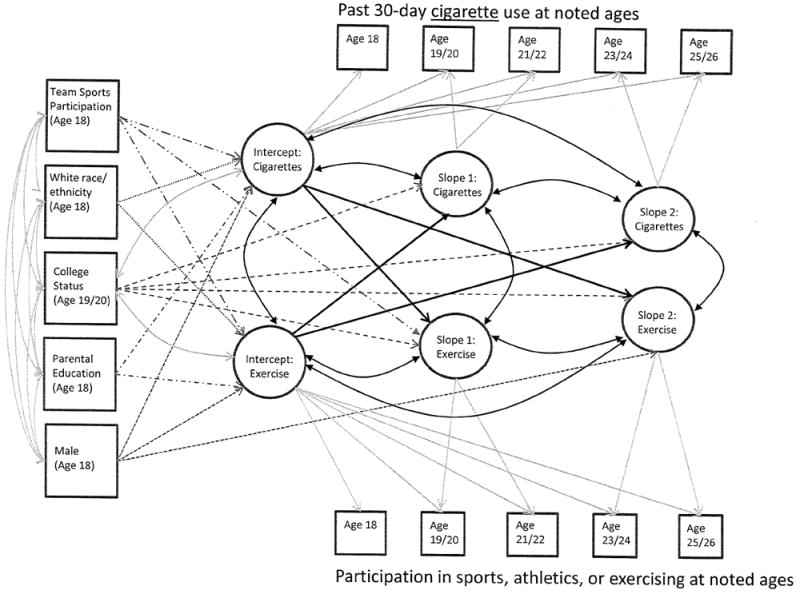
Full Piecewise Parallel Process Latent Growth Curve Model using Cigarette Use as an Example
Results
Analytical Sample
From the 16 class cohorts from 1986-2001, a total of 12,289 individuals responded to the applicable questionnaire forms. Of these, 548 (4%) were removed due to not having valid data for at least one observation for each outcome or for having implausible PSAE and team sports data. Removed individuals were significantly more likely to be male and report low average parental education; removed individuals were significantly less likely to be full-time college students at first follow-up. The final analytical sample included 40,424 observations from 11,741 individuals. Retention rates were: 69% follow-up 1, 63% follow-up 2, 58% follow-up 3, 54% follow-up 4.
Sample Descriptives and Unconditional Growth Models
Table 1 provides sample statistics, and Figure 2 shows normative trajectories of the processes. Mean alcohol use frequency increased from age 18 through 21/22 (from 2.21 to 2.71) followed by a minimal decrease through age 25/26. For cigarette use, an increase from age 18 to 21/22 was observed (from 1.69 to 1.75), followed by a slight decrease to 1.68 by age 25/26. Marijuana use showed the flattest trajectory over time, decreasing slightly from 1.50 at age 18 to 1.45 at age 21/22, and then to 1.36 by age 25/26. IOTM prevalence dropped from 9.4% at age 18 to 6.4% at age 21/22, and then to 5.6% by age 25/26. PSAE decreased somewhat from 3.87 at age 18 to 3.64 at age 21/22; the decrease then flattened through age 25/26 (3.58). Mean participation in school athletic teams at age 18 was 2.61. The Pearson correlation between PSAE and school athletic team participation at age 18 was 0.57 (p<.001). Thus, while overlapping, the two terms each retain a unique measure of an individual’s exercise participation.
Table 1.
Sample Statistics (Total Sample N=11,741)
| Range | Mean (SD) at age: | ||||||||||
|---|---|---|---|---|---|---|---|---|---|---|---|
| 18 | 19/20 | 21/22 | 23/24 | 25/26 | |||||||
| Main processes to model: | |||||||||||
| Participation in sports, athletics, or exercising | 1-5 | 3.87 | (1.29) | 3.71 | (1.21) | 3.64 | (1.21) | 3.60 | (1.20) | 3.58 | (1.21) |
| Past 30-day alcohol use | 1-7 | 2.21 | (1.48) | 2.41 | (1.52) | 2.71 | (1.58) | 2.67 | (1.52) | 2.64 | (1.51) |
| Past 30-day cigarette use | 1-7 | 1.69 | (1.22) | 1.72 | (1.30) | 1.75 | (1.33) | 1.73 | (1.33) | 1.68 | (1.32) |
| Past 30-day marijuana use | 1-7 | 1.50 | (1.28) | 1.45 | (1.22) | 1.45 | (1.23) | 1.39 | (1.20) | 1.36 | (1.16) |
| Any past 30-day use of illicits other than marijuana | 0,1 | 0.09 | (0.29) | 0.07 | (0.25) | 0.06 | (0.25) | 0.06 | (0.24) | 0.06 | (0.23) |
| Control variables (measured at age 18): | |||||||||||
| Male | 0,1 | 0.48 | (0.50) | ||||||||
| White race/ethnicity | 0,1 | 0.72 | (0.45) | ||||||||
| Average parental education | 1-5 | 3.03 | (1.17) | ||||||||
| Participation in school athletic teams | 1-5 | 2.61 | (1.72) | ||||||||
| Control variables (measured at age 19/20): | |||||||||||
| Full-time student at 4-year college | 0,1 | 0.45 | (0.50) | ||||||||
Figure 2.
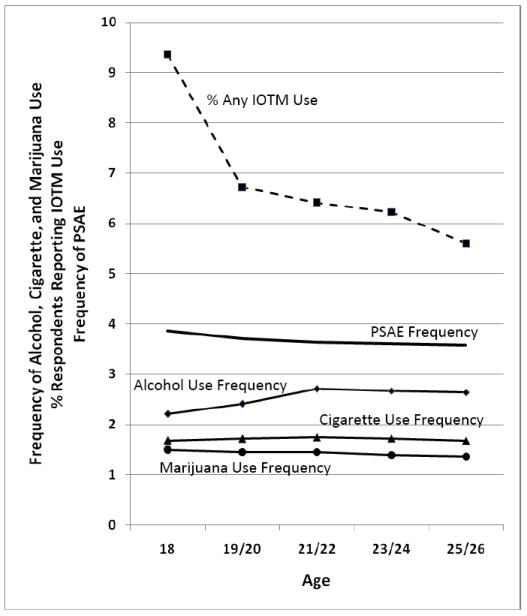
Normative Trajectories of Past 30-Day Substance Use Frequency and Active Participation in Sports, Athletics, or Participation in Sports, Athletics or Exercising (PSAE)
Notes: N=11,741. IOTM = Dichotomous indicator for illicit drugs other than marijuana; includes LSD, other hallucinogens, cocaine, heroin, other narcotics, amphetamines, barbiturates, and tranquilizers. PSAE = Participation in sports, athletics, or exercising; measured on 5-pt scale of 1=never, 2=a few times a year, 3=once or twice a month, 4=at least once a week, 5=almost every day. Past 30-day alcohol and marijuana use measured on 7-pt scale of 1=0 occasions, 2=1-2, 3=3-5, 4=6-9, 5=10-19, 6=20-39, 7=40 or more occasions. Past 30-day cigarette use measured on a 7-pt scale of 1=not at all, 2=<1 per day, 3=1-5 per day, 4=about 1/2 pack per day, 5=about 1 pack per day, 6=about 1 1/2 packs per day, 7=2+ packs per day.
Table 2 presents unconditional univariate growth model results. Close-fit indices suggested an acceptable fit for all processes[43,44]. The final rows report correlations between intercepts and slopes indicating how fast changes in PSAE or substance use occurred based on initial status at age 18. Negative correlations indicate that individuals with lower initial status grew fastest over time (positive slopes) or declined more slowly (negative slopes)[40]. Thus, the negative correlations between the PSAE intercept and both slopes (-.450, -.210) indicate that high school seniors with higher levels of exercising experienced the fastest declines in exercising; however, such individuals continued to have highest mean exercising levels through age 25/26. A similar relationship was observed for IOTM, where the significant negative correlation between the intercept and first slope (-.321) indicated that seniors with higher IOTM use experienced the fastest declines in use through age 21/22. Negative correlations between alcohol, cigarette, and marijuana use frequency intercepts and growth rates through ages 21/22 (-.344, -.191, -.431, respectively) indicate that youth with lower use of these substances at age 18 experienced faster increases in use than did youth with higher initial use. In contrast, the negative correlations between alcohol, cigarette, and marijuana use frequency intercepts and growth rates from ages 21/22 to 25/26 (-.189, -.134, -.210) show that youth with the lowest rates of use at age 18 showed the slowest declines in use during these years. For all three substances, further examination of the data showed that while youth with lower initial use frequency did experience an increase in use through ages 21/22, their mean use continued to remain lower than youth with higher initial use through ages 25/26. In contrast, youth with high initial status use showed a regression towards the mean in use frequency, yet continued to show higher mean use over time. No significant correlation was observed between the IOTM intercept and second slope, indicating that any IOTM use at age 18 did not significantly relate to the rate of change in IOTM prevalence from ages 21/22 through age 25/26. Similar to the other substances examined, not using IOTM at age 18 was related to lower use through ages 25/26.
Table 2.
Overall Model Fit and Growth Trajectory for the Unconditional Growth Models
| Model Fit Indicators | ||||||
|---|---|---|---|---|---|---|
| Variable | χ2(d.f.) | CFI | TLI | RMSEA | ||
| PSAEa | 17.695(6) | 0.998 | 0.997 | 0.013 | ||
| Alcohol use | 12.614(6) | 0.999 | 0.998 | 0.010 | ||
| Cigarette use | 24.670(6) | 0.997 | 0.995 | 0.016 | ||
| Marijuana use | 7.103(6) | 1.000 | 0.999 | 0.004 | ||
| IOTMb use | 30.714(22) | -- | -- | -- | ||
|
|
||||||
| Parameter Estimates | ||||||
| Means | ||||||
| I | (p) | S1 | (p) | S2 | (p) | |
|
|
||||||
| PSAE | 3.860 | (.000) | -0.121 | (.000) | -0.022 | (.007) |
| Alcohol use | 2.196 | (.000) | 0.268 | (.000) | -0.038 | (.000) |
| Cigarette use | 1.688 | (.000) | 0.066 | (.000) | -0.028 | (.000) |
| Marijuana use | 1.498 | (.000) | 0.003 | (.635) | -0.046 | (.000) |
| IOTM use | 0c | -0.299 | (.021) | -0.415 | (.011) | |
|
|
||||||
| Correlations | ||||||
| I,S1 | (p) | I,S2 | (p) | S1,S2 | (p) | |
|
|
||||||
| PSAE | -0.450 | (.000) | -0.210 | (.000) | -0.101 | (.152) |
| Alcohol use | -0.344 | (.000) | -0.189 | (.000) | -0.221 | (.000) |
| Cigarette use | -0.191 | (.000) | -0.134 | (.000) | -0.200 | (.000) |
| Marijuana use | -0.431 | (.000) | -0.210 | (.000) | -0.139 | (.012) |
| IOTM use | -0.321 | (.005) | -0.105 | (.429) | 0.245 | (.243) |
Notes: N=11,741. Mean and slope values are unstandardized. Correlations reported using standardized estimates (for IOTM, the estimated change in the logit).
χ2(d.f.) = chi-square value (degrees of freedom); CFI=comparative fit index; TLI=Tucker-Lewis coefficient; RMSEA=root mean square error of approximation; I = Intercept, S1 = Slope 1 (ages 18 through 21/22); S2 = Slope 2 (ages 21/22 through 25/26).
Participation in sports, athletics, or exercising.
IOTM = Dichotomous indicator for illicit drugs other than marijuana; includes LSD, other hallucinogens, cocaine, heroin, other narcotics, amphetamines, barbiturates, and tranquilizers. Reported chi-square test of model fit is for binary and ordered categorical (ordinal) outcomes. Most model fit indices are unavailable for binary processes.
Mplus fixes the mean of intercept growth factors for categorical variables at zero.
Bivariate and Multivariate Growth Models
Results from bivariate parallel process growth models (without control variables) are shown in Table 3. Full multivariate models were built in a staged fashion with final model results shown in Table 4. The discussion below focuses primarily on the main parameters of interest—between-process correlations—with additional discussion of the direct path results for team sports on substance use intercepts. Between-process correlations answer two key questions: (1) Did PSAE and substance use co-vary at age 18? (2) Did the rate of change in PSAE co-vary with the rate of change of substance use over time? Controlling for the direct path results for team sports investigates if athletic team participation substantively affected the observed relationships.
Table 3.
Results from Bivariate Parallel Process Growth Models for Participation in Sports, Athletics, or Exercising (PSAE) and Past 30-Day Substance Use
| Alcohol | (p) | Cigarettes | (p) | Marijuana | (p) | IOTMa | (p) | |
|---|---|---|---|---|---|---|---|---|
| Between-Process Correlations (r) | ||||||||
| SU I ↔ EX I | 0.094 | (.000) | -0.175 | (.000) | -0.071 | (.000) | -0.080 | (.000) |
| SU S1 ↔ EX S1 | 0.020 | (.314) | -0.197 | (.000) | -0.027 | (.113) | -0.114 | (.029) |
| SU S2 ↔ EX S2 | 0.093 | (.006) | -0.145 | (.000) | -0.023 | (.347) | -0.049 | (.618) |
| Model Fit Statistics | ||||||||
| Model N | 11,741 | 11,741 | 11,741 | 11,741 | ||||
| χ2(d.f.) | 57.732 (30) | 78.562 (30) | 41.819 (30) | -- | ||||
| CFI, TLI | 0.998, 0.997 | 0.997, 0.996 | 0.999, 0.999 | -- | ||||
| RMSEA | 0.009 | 0.012 | 0.006 | -- | ||||
Notes: Standardized values shown for correlations. For alcohol, cigarettes, and marijuana, the coefficients are expressed as traditional linear regression estimates. For IOTM, the logistic model for categorical outcomes with a numerical integration algorithm was used; thus, estimates use logits. SU I = Substance use intercept; SU S = substance use slope; EX I = PSAE intercept; EX S = PSAE slope. χ2(d.f.) = chi-square value (degrees of freedom); CFI=comparative fit index; TLI=Tucker-Lewis coefficient; RMSEA=root mean square error of approximation.
IOTM = Dichotomous indicator for illicit drugs other than marijuana; includes LSD, other hallucinogens, cocaine, heroin, other narcotics, amphetamines, barbiturates, and tranquilizers. Reported chi-square test of model fit is for binary and ordered categorical (ordinal) outcomes. Most model fit indices are unavailable for binary processes.
Table 4.
Results from Full Multivariate Parallel Process Growth Models for Participation in Sports, Athletics, or Exercising (PSAE) and Past 30-Day Substance Use
| Alcohol | (p) | Cigarettes | (p) | Marijuana | (p) | IOTMa | (p) | |
|---|---|---|---|---|---|---|---|---|
| Section A. Process 1: Substance Use Estimated Intercept and Slope Means | ||||||||
| SU I | 2.197 | (.000) | 1.688 | (.000) | 1.498 | (.000) | 0b | |
| SU S1 | 0.262 | (.000) | 0.065 | (.091) | 0.003 | (.000) | -0.331 | (.000) |
| SU S2 | -0.039 | (.285) | -0.027 | (.714) | -0.044 | (.387) | -0.316 | (.002) |
| Section B. Process 2: PSAE Estimated Intercept and Slope Means | ||||||||
| EX I | 3.862 | (.000) | 3.862 | (.000) | 3.862 | (.000) | 3.861 | (.000) |
| EX S1 | -0.120 | (.000) | -0.123 | (.000) | -0.120 | (.000) | -0.119 | (.000) |
| EX S2 | -0.031 | (.691) | -0.030 | (.059) | -0.031 | (.462) | -0.031 | (.356) |
| Section C. Substance Use Within-Process Correlationsc (r) | ||||||||
| SU I ↔ SU S1 | -0.402 | (.000) | -0.188 | (.000) | -0.429 | (.000) | -0.201 | (.031) |
| SU I ↔ SU S2 | -0.191 | (.000) | -0.147 | (.000) | -0.209 | (.000) | -0.415 | (.000) |
| SU S1 ↔ SU S2 | -0.202 | (.000) | -0.195 | (.000) | -0.138 | (.013) | 0.945 | (.000) |
| Section D. Between-Process Correlations (r) | ||||||||
| SU I ↔ EX I | -0.015 | (.322) | -0.135 | (.000) | -0.069 | (.000) | -0.080 | (.000) |
| SU S1 ↔ EX S1 | 0.010 | (.605) | -0.139 | (.000) | -0.044 | (.010) | -0.174 | (.004) |
| SU S2 ↔ EX S2 | 0.108 | (.002) | -0.128 | (.000) | -0.014 | (.573) | -0.100 | (.442) |
| Section E. Direct Path Coefficients (β) | ||||||||
| SU I → EX S1 | 0.067 | (.001) | -0.017 | (.427) | 0.062 | (.000) | 0.080 | (.013) |
| SU I → EX S2 | -0.003 | (.930) | 0.048 | (.107) | 0.001 | (.972) | 0.000 | (.999) |
| EX I → SU S1 | 0.099 | (.000) | 0.066 | (.000) | 0.088 | (.000) | 0.131 | (.001) |
| EX I → SU S2 | -0.037 | (.149) | -0.014 | (.534) | -0.004 | (.814) | -- | |
| Section F. Time-Invariant Controls (β) | ||||||||
| Male | ||||||||
| → SU I | 0.198 | (.000) | 0.044 | (.000) | 0.117 | (.000) | 0.092 | (.000) |
| → EX I | 0.133 | (.000) | 0.137 | (.000) | 0.134 | (.000) | 0.170 | (.000) |
| → EX S2 | -0.143 | (.000) | -0.130 | (.000) | -0.136 | (.000) | -0.137 | (.000 |
| White race/ethnicity | ||||||||
| → SU I | 0.158 | (.000) | 0.185 | (.000) | 0.035 | (.000) | 0.149 | (.000) |
| → EX I | 0.054 | (.000) | 0.057 | (.000) | 0.056 | (.000) | 0.088 | (.000) |
| Average parental education | ||||||||
| → SU I | 0.002 | (.875) | -0.055 | (.000) | 0.024 | (.003) | --d | |
| → EX I | 0.100 | (.000) | 0.099 | (.000) | 0.100 | (.000) | --d | |
| → SU S1 | 0.088 | (.000) | -- | -- | --d | |||
| Participation in school athletic teams | ||||||||
| → SU I | 0.036 | (.001) | -0.141 | (.000) | -0.086 | (.000) | -0.059 | (.000) |
| → EX I | 0.663 | (.000) | 0.661 | (.000) | 0.661 | (.000) | 0.461 | (.000) |
| → EX S1 | -0.526 | (.000) | -0.522 | (.000) | -0.516 | (.000) | -0.317 | (.000) |
| Full-time student at age 19/20 | ||||||||
| → SU S1 | 0.234 | (.000) | 0.006 | (.719) | 0.097 | (.000) | 0.135 | (.007) |
| → SU S2 | -0.056 | (.019) | -0.075 | (.000) | -0.045 | (.012) | -0.119 | (.199) |
| → EX S1 | 0.071 | (.001) | 0.063 | (.003) | 0.071 | (.001) | 0.073 | (.002) |
| → EX S2 | 0.084 | (.001) | 0.093 | (.001) | 0.086 | (.001) | 0.087 | (.002) |
| Section G. Model Fit Statistics | ||||||||
| Model N | 11,741 | 11,741 | 11,741 | 11,741 | ||||
| χ2 (d.f.) | 288.934 (64) | 259.784 (65) | 210.716 (65) | -- | ||||
| CFI, TLI | 0.990, 0.985 | 0.993, 0.990 | 0.993, 0.990 | -- | ||||
| RMSEA | 0.017 | 0.016 | 0.014 | -- | ||||
Notes: Intercepts and slopes shown using non-standardized values. Standardized values shown for correlations and coefficients. For alcohol, cigarettes, and marijuana, the coefficients are expressed as traditional linear regression estimates. For IOTM, the logistic model for categorical outcomes with a numerical integration algorithm was used; thus, estimates use logits. For all substances other than IOTM, models simultaneously controlled for gender, race/ethnicity, parental education, college status, and school athletic team participation. For IOTM, the model controlled for gender, race/ethnicity, college status, and school athletic team participation. SU I = Substance use intercept; SU S = substance use slope; EX I = PSAE intercept; EX S = PSAE slope. χ2(d.f.) = chi-square value (degrees of freedom); CFI=comparative fit index; TLI=Tucker-Lewis coefficient; RMSEA=root mean square error of approximation.
IOTM = Dichotomous indicator for illicit drugs other than marijuana; includes LSD, other hallucinogens, cocaine, heroin, other narcotics, amphetamines, barbiturates, and tranquilizers. Most model fit indices are unavailable for binary processes (as both a continuous and dichotomous outcome have been modeled together, chi-square test of model fit is also unavailable).
Mplus fixes the mean of intercept growth factors for categorical variables at zero.
Within-process correlations for exercise ranged from: EX I ↔ EX S1 = -0.288 to -0.292 (p=.000); EX I ↔ EX S2 = -0.165 to -0.172 (p=.000); EX SU1 ↔ EX S2 = -0.205 to -0.211 (p=.001).
Estimates for parental education obtained from the multivariate model excluding school athletic teams were: → SU I = -0.018 (p=.205); → EX I = 0.191 (p<.001); → SU S1 not modeled.
Past 30-Day Alcohol Use Frequency and PSAE
Bivariate models showed that higher PSAE was associated with higher age 18 alcohol use frequency (correlation SU I ↔ EX I, r = 0.094, p<.001). This relationship remained substantively unchanged in models adding each of the five control variables separately. When including two control measures simultaneously, the correlation became insignificant in two models (data not shown): (a) inclusion of both race/ethnicity and team sports participation (SU I ↔ EX I r = 0.017, p=.258), and (b) inclusion of both gender and team sports participation (SU I ↔ EX I r = -0.004, p=.806). The final multivariate model showed the correlation as negative but non-significant (SU I ↔ EX I, r = -0.015, p=.322). Final model estimates showed that team sports participation did have a significant and positive relationship with alcohol use at age 18 (→ SU I = 0.036, p=.001) in contrast with all other substances where the relationship was significant and negative.
The rate of change in PSAE from ages 18 to 21/22 did not significantly co-vary with alcohol use frequency change. However, a significant and positive correlation was observed from ages 21/22 to 25/26; during this time, both processes were flattening (multivariate model SU S2 ↔ EX S2 r = 0.108, p=.002).
Past 30-Day Cigarette Use Frequency and PSAE
In bivariate and multivariate models, higher PSAE was associated with lower age 18 cigarette use frequency (multivariate model SU I ↔ EX I r = -0.135, p<.001). Increases in PSAE were related to significant decreases in cigarette use from ages 18 to 21/22 (multivariate model SU S1 ↔ EX S1 r = -0.139, p<.001). PSAE increases from ages 21/22 to 25/26 were also related to decreases in cigarette use (multivariate model SU S2 ↔ EX S2 r = -0.128, p<.001).
Past 30-Day Marijuana Use Frequency and PSAE
Higher PSAE was associated with lower age 18 marijuana use frequency in bivariate and multivariate models (multivariate model SU I ↔ EX I r = -0.069, p<.001). PSAE increases were significantly related to decreases in marijuana use through ages 21/22 (multivariate model SU S1 ↔ EX S1 r = -0.044, p=.010) but no significant association was observed between ages 21/22 and 25/26.
Past 30-Day IOTM Use Prevalence and PSAE
At age 18, higher PSAE was associated with lower IOTM use in bivariate and multivariate models (multivariate model SU I ↔ EX I r = -0.080, p<.001). PSAE increases were related to decreased IOTM use through ages 21/22 (multivariate model SU S1 ↔ EX S1 r = -0.174, p=.004) but were not significantly related from ages 21/22 through 25/26.
Discussion
Results indicated that higher initial PSAE related to lower initial past-30-day cigarette and marijuana use frequency and IOTM use prevalence; lower initial substance use then corresponded with lower use throughout early adulthood. Further, as individuals increased PSAE, cigarette, marijuana, and IOTM use frequency decreased. PSAE was not significantly associated with age 18 alcohol use frequency. However, school athletic team participation at age 18 was associated with higher alcohol use frequency (but lower use frequency of cigarettes and marijuana, and IOTM prevalence). The magnitude of the observed associations was not particularly large; however, results indicate a consistent relationship indicative of somewhat lowered substance use frequency/prevalence associated with increased PSAE in early adulthood.
Substance abuse prevention focuses on preventing, delaying onset, or moderating problems associated with substance use[45]. The importance of delaying onset is well-documented. Early onset relates to heaver and longer use of the original substance, as well as problematic use of other substances[46]. Lifetime drug abuse and dependence is reduced significantly by each year use onset is delayed[47]. Lower past-30-day use at age 18 does not equal delayed onset; however, lower use at age 18 and throughout early adulthood represents a similar, desired public health outcome. This study indicated that lower age 18 substance use related to lower growth rates, and higher PSAE related to overall lower substance use at age 18 and through early adulthood. Efforts to encourage all adolescents to increase enjoyment of and participation in general exercise may result in lower substance use and abuse as youth move into early adulthood. The observed PSAE and substance use slopes in the current study are similar to general population trajectories found in previous studies[31,48-50], lending support to these results.
In this study, PSAE was a single measure emphasizing participation; it did not capture physiological effects of exercise. Thus, obtained results could be related to (a) an individual’s time being filled with participating in exercise vs. participating in substance use, (b) social and peer influences from different groups, (c) physiological effects of exercise, (d) a combination of the above, etc. A constellation of environmental, familial, peer, and genetic factors relate to substance use[51-55]; PSAE may be affected by similar factors. However, the finding that as individuals increased their PSAE there were significant decreases in their use of cigarettes, marijuana, and IOTM in early adulthood may reflect a health promotion intervention opportunity.
Identification of significant differences in the normative trajectory of substance use based on type of physical activity could strengthen substance abuse prevention and treatment efforts and possibly identify at-risk populations. Participation in team sports related to higher alcohol use frequency at age 18, and higher initial frequency related to significantly higher frequency throughout young adulthood. High school team sports participants may be in need of targeted alcohol prevention efforts. Previous research indicates that middle school youth with delinquent histories tend to drop out of school athletics leaving a group with comparatively higher social conformity[56]. Social conformity may increase the likelihood of conforming to perceived substance use norms including peer norms regarding alcohol use as a team bonding/social activity. Perceived norms (accurate or not) have consistently been found to relate to young adult alcohol use[57,58]. By the senior year of high school, school athletic team participation also may be limited to students who are the most skilled and competitive[59], characteristics that research has found to be associated with increased alcohol use[60].
Limitations
These findings should be considered within their limitations. Analyses could not relate early life exercise participation and age of substance use onset, and analyses did not investigate relationships between substance use quantity and PSAE. Past-30-day substance use frequency rates were chosen as the time frame to minimize endogeneity with PSAE. PSAE and drug use measures were single item, and students self-reported participation in exercise and team sports in broad, general terms. While it would be preferable to have more specific information, the measures likely capture much of the valid inter-individual variation. (Reliabilities of the single-item measures of PSAE and sports are each estimated at .60 based on longitudinal data; because there is no longitudinal data for school athletic team participation, no reliability estimate is available.) The current study did not measure type of school team sport nor level of team sports participation after age 18. Research indicates that type of team sport significantly relates to substance use[21,61,62]. However, individuals who participate in team-based sports in early adulthood likely were involved in such activities at the high school level (although some school districts do not offer school-based team sports, and the current study may have excluded youth involved in non-school based team sports). Other limitations are that analyses do not include high school dropouts (dropout rates range between 13% and 20% nationally)[55], the MTF longitudinal sample is subject to attrition, and all data were self-report. Finally, as noted previously, alcohol, cigarette, and marijuana use frequency outcomes were treated as normally distributed interval measures (an assumption that is clearly not valid). To investigate the possible implications of mis-specification, IOTM/PSAE models were estimated using IOTM as both continuous and linear (because this outcome exhibited the strongest non-normal distribution, we considered it the best to use for alternative estimation). The results of interest for the linear model (correlations between the intercepts and slopes of the opposing processes) were not substantively different from those obtained from the model where IOTM was specified as a categorical variable. The limitations notwithstanding, the current study may be one of the first that uses longitudinal data to control for team sports participation while examining growth trajectories for exercise participation in general and substance use in a nationally representative sample of young adults.
Conclusions
PSAE was moderately and negatively related to lower cigarette and marijuana use frequency and IOTM use prevalence at age 18, and growth in PSAE related to decreased growth in the use of these three substances in early adulthood. Understanding the specific mechanisms by which PSAE may relate to lower substance use will require further research; however, the processes do appear to be related. Encouraging the enjoyment of and participation in general exercise may relate to lower substance use throughout adolescence and early adulthood.
Acknowledgments
Monitoring the Future is supported by the National Institute on Drug Abuse (grants DA001411 and DA016575). The views expressed in this article are those of the authors and do not necessarily reflect the views of the funders. The authors wish to express thanks to Deborah Kloska for analytical assistance.
Footnotes
Conflict of Interest Declaration: The authors have no connection with the tobacco, alcohol, pharmaceutical or gaming industries or any body substantially funded by one of these organizations.
References
- 1.National Institute on Drug Abuse. Can Physical Activity and Exercise Prevent Drug Abuse? Promoting a Full Range of Science to Inform Prevention: Meeting Summary. Bethesda, MD: US Department of Health and Human Services, National Institutes of Health, National Institute on Drug Abuse; 2008. Available at: http://www.seiservices.com/NIDA/1014032/Meeting%20Summary-EDITED%2007.08.08.pdf Archived at http://www.webcitation.org/5tqhQhiSJ on October 29, 2010. [Google Scholar]
- 2.National Institute on Drug Abuse. Interactions between Physical Activity and Drug Abuse (R01) RFA-DA-09-013. Bethesda, MD: US Department of Health and Human Services, National Institutes of Health, National Institute on Drug Abuse; 2008. Oct 16, Available at: http://grants.nih.gov/grants/guide/rfa-files/RFA-DA-09-013.html Archived at http://www.webcitation.org/5tqhhMxCw on October 29, 2010. [Google Scholar]
- 3.National Institute on Drug Abuse. Interactions between Physical Activity and Drug Abuse (R03) RFA-DA-09-014. Bethesda, MD: US Department of Health and Human Services, National Institutes of Health, National Institute on Drug Abuse; 2008. Oct 17, Available at: http://grants.nih.gov/grants/guide/rfa-files/RFA-DA-09-014.html Archived at http://www.webcitation.org/5tqhrK1uU on October 29, 2010. [Google Scholar]
- 4.Collingwood TR, Reynolds R, Kohl HW, Smith W, Sloan S. Physical fitness effects on substance abuse risk factors and use patterns. J Drug Educ. 1991;21:73–84. doi: 10.2190/HV5J-4EYN-GPP7-Y3QG. [DOI] [PubMed] [Google Scholar]
- 5.Collingwood TR, Sunderlin J, Reynolds R, Kohl HW. Physical training as a substance abuse prevention intervention for youth. J Drug Educ. 2000;30:435–451. doi: 10.2190/RVUE-9XW7-TYRQ-EJR8. [DOI] [PubMed] [Google Scholar]
- 6.Kinnunen T, Leeman RF, Korhonen T, Quiles ZN, Terwal DM, Garvey AJ, et al. Exercise as an adjunct to nicotine gum in treating tobacco dependence among women. Nicotine Tob Res. 2008;10:689–703. doi: 10.1080/14622200801979043. [DOI] [PMC free article] [PubMed] [Google Scholar]
- 7.Prochaska JJ, Hall SM, Humfleet G, Munoz RF, Reus V, Gorecki J, et al. Physical activity as a strategy for maintaining tobacco abstinence: a randomized trial. Prev Med. 2008;47:215–220. doi: 10.1016/j.ypmed.2008.05.006. [DOI] [PMC free article] [PubMed] [Google Scholar]
- 8.Werch CE, Moore MJ, DiClemente CC, Bledsoe R, Jobli E. A multihealth behavior intervention integrating physical activity and substance use prevention for adolescents. Prev Sci. 2005;6:213–226. doi: 10.1007/s11121-005-0012-3. [DOI] [PubMed] [Google Scholar]
- 9.Caldwell LL. Adolescents and Healthy Leisure Contexts: The HealthWise and TimeWise Interventions. Bethesda, MD: US Department of Health and Human Services, National Institutes of Health, National Institute on Drug Abuse; 2008. Available at: http://www.sei2003.com/NIDA/1014032/Final%20Presentations/NIDA%20PA%20June%205/Caldwell.pdf. Archived at http://www.webcitation.org/5tqhv4Dle on October 29, 2010. [Google Scholar]
- 10.Ryan RM, Deci EL. Self-determination theory and the facilitation of intrinsic motivation, social development, and well-being. Am Psychol. 2000;55:68–78. doi: 10.1037//0003-066x.55.1.68. [DOI] [PubMed] [Google Scholar]
- 11.Rhode P. Prevention of Adolescent Depression and the Potential Role of Exercise. Bethesda, MD: US Department of Health and Human Services, National Institutes of Health, National Institute on Drug Abuse; 2008. Available at: http://www.seiservices.com/nida/1014032/Final%20Presentations/NIDA%20PA%20June%205/Depression%20Rohde%20%282%29.pdf. Archived at http://www.webcitation.org/5tqi8hyym on October 29, 2010. [Google Scholar]
- 12.Hillman CH. Physical Activity and Cognition across the Lifespan. Bethesda, MD: US Department of Health and Human Services, National Institutes of Health, National Institute on Drug Abuse; 2008. Available at: http://www.sei2003.com/NIDA/1014032/Final%20Presentations/NIDA%20PA%20June%206/Hillman%20NIDA%20Workshop%20June%202008.pdf Archived at http://www.webcitation.org/5tqiCxuN0 on October 29, 2010. [Google Scholar]
- 13.Boecker H, Sprenger T, Spilker ME, Henriksen G, Koppenhoefer M, Wagner KJ, et al. The runner’s high: opioidergic mechanisms in the human brain. Cereb Cortex. 2008;18:2523–2531. doi: 10.1093/cercor/bhn013. [DOI] [PubMed] [Google Scholar]
- 14.Craft LL. Proposed Mechanisms Underlying the Exercise and Depression Relationship: Relevance to Drug Abuse. Bethesda, MD: US Department of Health and Human Services, National Institutes of Health, National Institute on Drug Abuse; 2008. Available at: http://www.sei2003.com/NIDA/1014032/Final%20Presentations/NIDA%20PA%20June%205/Craft.pdf. Archived at http://www.webcitation.org/5tqiJSXMa on October 29, 2010. [Google Scholar]
- 15.National Institute on Drug Abuse. Can Physical Activity and Exercise Prevent Substance Use: Promoting a Full Range of Science to Inform Prevention. Rockville, MD: National Institutes of Health, National Institute on Drug Abuse; 2008. Available at: http://www.drugabuse.gov/whatsnew/meetings/exercise/index.html. Archived at http://www.webcitation.org/5tqiNBD1T on October 29, 2010. [Google Scholar]
- 16.Substance Abuse and Mental Health Services Administration. Results from the 2009 National Survey on Drug Use and Health: Volume I. Summary of National Findings. Rockville, MD: 2010. Office of Applied Studies, NSDUH Series H-38A, HHS Publication No SMA 10-4586Findings. [Google Scholar]
- 17.Chassin L. Foreword. In: Schulenberg JE, Maggs JL, Hurrelmann K, editors. Health Risks and Developmental Transitions during Adolescence. Cambridge, UK: Cambridge University Press; 1997. pp. xiii–xvi. [Google Scholar]
- 18.Bachman JH, Wadsworth KN, O’Malley PM, Schulenberg J, Johnston LD. Marriage, divorce, and parenthood during the transition to young adulthood: impacts on drug use and abuse. In: Schulenberg JE, Maggs JL, Hurrelmann K, editors. Health Risks and Developmental Transitions during Adolescence. Cambridge, UK: Cambridge University Press; 1997. pp. 246–279. [Google Scholar]
- 19.Staff J, Schulenberg JE, Maslowsky J, Bachman JG, O‘Malley PM, Maggs JL, Johnston LD. Substance use changes and social role transitions: Proximal developmental effects on ongoing trajectories from late adolescence through early adulthood. Dev Psychopathol. 2010;22:917–932. doi: 10.1017/S0954579410000544. [DOI] [PMC free article] [PubMed] [Google Scholar]
- 20.Lisha NE, Sussman S. Relationship of high school and college sports participation with alcohol, tobacco, and illicit drug use: A review. Addict Behav. 2010;35:399–407. doi: 10.1016/j.addbeh.2009.12.032. [DOI] [PMC free article] [PubMed] [Google Scholar]
- 21.Peretti-Watel P, Guagliardo V, Verger P, Pruvost J, Mignon P, Obadia Y. Sporting activity and drug use: alcohol, cigarette and cannabis use among elite student athletes. Addiction. 2003;98:1249–1256. doi: 10.1046/j.1360-0443.2003.00490.x. [DOI] [PubMed] [Google Scholar]
- 22.Simoes EJ, Byers T, Coates RJ, Serdula MK, Mokdad AH, Heath GW. The association between leisure-time physical activity and dietary fat in American adults. Am J Public Health. 1995;85:240–244. doi: 10.2105/ajph.85.2.240. [DOI] [PMC free article] [PubMed] [Google Scholar]
- 23.Eitle D, Turner RJ, Eitle TM. The deterrence hypothesis reexamined: sports participation and substance use among young adults. J Drug Issues. 2003;33:193–221. [Google Scholar]
- 24.Mays D, DePadilla L, Thompson NJ, Kushner HI, Windle M. Sports participation and problem alcohol use: a multi-wave national sample of adolescents. Am J Prev Med. 2010;38:491–498. doi: 10.1016/j.amepre.2010.01.023. [DOI] [PMC free article] [PubMed] [Google Scholar]
- 25.Wichstrom T, Wichstrom L. Does sports participation during adolescence prevent later alcohol, tobacco and cannabis use? Addiction. 2009;104:138–149. doi: 10.1111/j.1360-0443.2008.02422.x. [DOI] [PubMed] [Google Scholar]
- 26.Peck SC, Vida M, Eccles JS. Adolescent pathways to adulthood drinking: sport activity involvement is not necessarily risky or protective. Addiction. 2008;103:69–83. doi: 10.1111/j.1360-0443.2008.02177.x. [DOI] [PMC free article] [PubMed] [Google Scholar]
- 27.Peretti-Watel P. Sports and drugs: further interpretative hypotheses are necessary. Addiction. 2009;104(1):150–151. doi: 10.1111/j.1360-0443.2008.02464.x. [DOI] [PubMed] [Google Scholar]
- 28.Johnston LD, O’Malley PM, Bachman JG, Schulenberg JE. Monitoring the Future National Survey Results on Drug Use, 1975-2008. Volume II: College Students and Adults Ages 19-50. Bethesda, MD: US Department of Health and Human Services, National Institute on Drug Abuse; 2009. NIH Publication No. 09-7403. [Google Scholar]
- 29.Barnett TA, Gauvin L, Craig CL, Katzmarzyk PT. Distinct trajectories of leisure time physical activity and predictors of trajectory class membership: a 22 year cohort study. Int J Behav Nutr Phys Act. 2008;5:1–8. doi: 10.1186/1479-5868-5-57. [DOI] [PMC free article] [PubMed] [Google Scholar]
- 30.Belanger M, Gray-Donald K, O’Loughlin J, Paradis G, Hutcheon J, Maximova K, et al. Participation in organized sports does not slow declines in physical activity during adolescence. Int J Behav Nutr Phys Act. 2009;6:1–6. doi: 10.1186/1479-5868-6-22. [DOI] [PMC free article] [PubMed] [Google Scholar]
- 31.Lunn PD. The sports and exercise life-course: a survival analysis of recall data from Ireland. Soc Sci Med. 2010;70:711–719. doi: 10.1016/j.socscimed.2009.11.006. [DOI] [PubMed] [Google Scholar]
- 32.Makinen TE, Borodulin K, Tammelin TH, Rahokonen O, Laatikainen T, Prattala R. The effects of adolescence sports and exercise on adulthood leisure-time physical activity in educational groups. Int J Behav Nutr Phys Act. 2010;7:1–11. doi: 10.1186/1479-5868-7-27. [DOI] [PMC free article] [PubMed] [Google Scholar]
- 33.Muthén BO, Muthén LK. The development of heavy drinking and alcohol-related problems from ages 18 to 37 in a US national sample. J Stud Alcohol. 2000;61:290–300. doi: 10.15288/jsa.2000.61.290. [DOI] [PubMed] [Google Scholar]
- 34.Muthén LK, Muthén BO. Mplus Users Guide. Los Angeles, CA: Muthén and Muthén; 2007. [Google Scholar]
- 35.Arbuckle JL. Full information estimation in the presence of incomplete data. In: Marcoulides GA, Schumacker RE, editors. Advanced Structural Equation Modeling: Issues and Techniques. Mahwah, NJ: Erlbaum; 1996. pp. 243–277. [Google Scholar]
- 36.Enders CK. The performance of the full information maximum likelihood estimator in multiple regression models with missing data. Educ Psychol Meas. 2001;61:713–740. [Google Scholar]
- 37.Muthén LK, Muthén BO. Mplus Version History: Mplus Version 6.1. Los Angeles, CA: Muthén and Muthén; 2010. Available at: http://www.statmodel.com/verhistory.shtml Archived at http://www.webcitation.org/5wZcqlg5S on February 17, 2011. [Google Scholar]
- 38.Muthén LK, Muthén BO. Missing Data Modeling. Los Angeles, CA: Muthén and Muthén; 2010. Available at: http://www.statmodel.com/discussion/messages/22/22.html [Note: this URL unable to be archived at webcitation.org due to the URL containing a nocache tag] [Google Scholar]
- 39.Chou C-P, Yang D, Pentz MA, Hser Y-I. Piecewise growth curve modeling approach for longitudinal prevention study. Comput Stat Data An. 2004;46:213–225. [Google Scholar]
- 40.Scheier LM, Grenard JL. Influence of a nationwide social marketing campaign on adolescent drug use. J Health Commun. 2010;15:240–271. doi: 10.1080/10810731003686580. [DOI] [PubMed] [Google Scholar]
- 41.Cheong J-W, MacKinnon DP, Khoo ST. Investigation of meditational processes using parallel process latent growth curve modeling. Struct Equ Modeling. 2003;10:238–262. doi: 10.1207/S15328007SEM1002_5. [DOI] [PMC free article] [PubMed] [Google Scholar]
- 42.Hedeker D, Gibbons RD. A random-effects ordinal regression model for multilevel analysis. Biometrics. 1994;50:933–944. [PubMed] [Google Scholar]
- 43.Bentler PM. On tests and indices for evaluating structural models. Pers Indiv Differ. 2007;42:825–829. [Google Scholar]
- 44.Hu L-T, Bentler PM. Fit indices in covariance structure modeling: sensitivity to underparameterized model misspecification. Psychol Methods. 1998;3:424–453. [Google Scholar]
- 45.Etz KE, Robertson EB, Ashery RS. Drug abuse prevention through family-based interventions: future research. In: Ashery RS, Robertson EB, Kumpfer KL, editors. NIDA Research Monograph. Rockville, MD: National Institute on Drug Abuse; 1998. pp. 1–11. [Google Scholar]
- 46.Grant BF. Age at smoking onset and its association with alcohol consumption and DSM-IV alcohol abuse and dependence: results from the National Longitudinal Alcohol Epidemiologic Survey. J Subst Abuse. 1998;10:59–73. doi: 10.1016/s0899-3289(99)80141-2. [DOI] [PubMed] [Google Scholar]
- 47.Grant BF, Dawson DA. Age of onset of drug use its association with DSM-IV drug abuse and dependence: results from the National Longitudinal Alcohol Epidemiologic Study. J Subst Abuse. 1998;10:163–173. doi: 10.1016/s0899-3289(99)80131-x. [DOI] [PubMed] [Google Scholar]
- 48.Maggs JL, Schulenberg JE. Trajectories of alcohol use during the transition to adulthood. Alcohol Res Health. 2004/2005;28:195–201. [Google Scholar]
- 49.Schulenberg JE, Merline AC, Johnston LD, O’Malley PM, Bachman JG, Laetz VB. Trajectories of marijuana use during the transition to adulthood: the big picture based on national panel data. J Drug Issues. 2005;35:225–279. doi: 10.1177/002204260503500203. [DOI] [PMC free article] [PubMed] [Google Scholar]
- 50.Orlando M, Tucker JS, Ellickson PL, Klein DJ. Developmental trajectories of cigarette smoking and their correlates from early adolescence to young adulthood. J Consult Clin Psych. 2004;72:400–410. doi: 10.1037/0022-006X.72.3.400. [DOI] [PubMed] [Google Scholar]
- 51.Meyers JL, Dick DM. Genetic and environmental risk factors for adolescent-onset substance use disorders. Child Adol Psych Cl. 2010;29:465–477. doi: 10.1016/j.chc.2010.03.013. [DOI] [PMC free article] [PubMed] [Google Scholar]
- 52.Lynne-Landsman SD, Graber JA, Andrews JA. Do trajectories of household risk in childhood moderate pubertal timing effects on substance initiation in middle school? Dev Psychol. 2010;46:853–868. doi: 10.1037/a0019667. [DOI] [PMC free article] [PubMed] [Google Scholar]
- 53.van der Zwaluw CS, Engels RCME, Vermulst AA, Franke B, Buitelaar J, Verkes RJ, et al. Interaction between dopamine D2 receptor genotype and parental rule-setting in adolescent alcohol use: evidence for a gene-parenting interaction. Mol Psychiatr. 2010;15:727–735. doi: 10.1038/mp.2009.4. [DOI] [PubMed] [Google Scholar]
- 54.Degenhardt L, Dierker L, Chiu WT, Medina-Mora ME, Neumark Y, Sampson N, et al. Evaluating the drug use “gateway” theory using cross-national data: consistency and associations of the order of initiation of drug use among participants in the WHO World Mental Health Surveys. Drug Alcohol Depen. 2010;108:84–97. doi: 10.1016/j.drugalcdep.2009.12.001. [DOI] [PMC free article] [PubMed] [Google Scholar]
- 55.Johnston LD, O’Malley PM, Bachman JG, Schulenberg JE. Monitoring the Future National Survey Results on Drug Use, 1975–2008: Volume I, Secondary School Students. Bethesda, MD: National Institute on Drug Abuse; 2009. NIH Publication No 09-7402. [Google Scholar]
- 56.Larson R. Youth organizations, hobbies, and sports as developmental contexts. In: Silbereisen RK, Todt E, editors. Adolescence in Context: The Interplay of Family, School, Peers, and Work in Adjustment. New York, NY: Springer-Verlag; 1994. pp. 46–65. [Google Scholar]
- 57.Berkowitz AD. The Social Norms Approach: Theory, Research, and Annotated Bibliography. 2004 Available at: http://www.alanberkowitz.com/articles/social_norms.pdf. Archived at http://www.webcitation.org/5tqiXYQYz on October 29, 2010.
- 58.Perkins HW. The Social Norms Approach to Preventing School and College Age Substance Abuse: A Handbook for Educators, Counselors, and Clinicians. San Francisco, CA: Jossey-Bass; 2003. [Google Scholar]
- 59.Landis MJ, Peppard PP, Remington PL. Characteristics of school-sanctioned sports: participation and attrition in Wisconsin public high schools. Wis Med J. 2007;106:312–318. [PubMed] [Google Scholar]
- 60.Terre L, Drabman RS, Meydrech EF. Relationships among children’s health-related behaviors: a multivariate, developmental perspective. Prev Med. 1990;19:134–146. doi: 10.1016/0091-7435(90)90015-c. [DOI] [PubMed] [Google Scholar]
- 61.Martens MP, Watson JC, Beck NC. Sport-type differences in alcohol use among intercollegiate athletes. J Appl Sport Psychol. 2006;18:136–150. [Google Scholar]
- 62.Moore MJ, Werch CE. Sport and physical activity participation and substance use among adolescents. J Adolesc Health. 2005;36:486–493. doi: 10.1016/j.jadohealth.2004.02.031. [DOI] [PubMed] [Google Scholar]