Abstract
The purpose of this study is to develop a continuous model to describe the vibration of the vocal fold with hydrated tissue. This model is unique because it is based on the fluid-saturated porous solid theory. Therefore, this new model can be used to study some vocal fold characteristics that would be difficult to predict using previous models. Numerical simulations show that this model can generate self-oscillation and that its phonation threshold pressure (PTP) is 0.555 kPa. The basic outputs of this model, including fundamental frequency, maximum lateral displacement, surface dynamics, and empirical eigenfunctions, agree with previous models and experimental studies, which validates this new model. The ability to simulate the flow of liquid through the tissue is one of the important advantages of this new model. It was found that the liquid in the vocal fold tissue could be accumulated at the anterior–posterior midpoint during phonation, which could cause a pressure increase in the liquid. The liquid pressure increased from 0.033 to 0.150 kPa when the subglottal pressure increased from 0.555 kPa (PTP) to 0.7 kPa. It was believed that the liquid dynamics in the tissue during phonation could be related to the development of some vocal diseases, such as vocal nodules, edema, and so on. Therefore, we expect that this model might not only provide a more appropriate description of the vocal fold vibration, but that it could also have clinical value in investigating certain vocal fold diseases.
Keywords: Vocal folds, Fluid-saturated porous solid, Biphase, Poroelasticity, Phonation, Continuous model
1. Introduction
Computer models allow researchers to easily define system parameters and manipulate model configurations. Therefore, with a small cost, an appropriate model could provide extensive information about speech production (Berry et al., 1994; Gunter, 2004; Tao and Jiang, 2006, 2007). Treating the vocal tissue as a continuous viscoelastic solid (Titze and Strong, 1975; Titze, 1976) or as a liquid, the elastic continuous models (Alipour et al., 2000) and the water wave model (Tsai et al., 2006) of the vocal folds were developed, respectively. Especially, the elastic continuous models have been successfully applied to simulate vocal fold collision (Gunter, 2004; Tao et al., 2006), biphonation (Tao and Jiang, 2006), abduction/adduction (Hunter et al., 2004), and so on.
However, it is known that most tissue is essentially biphasic. The composite of an elastic porous solid and the liquid that fills the pores plays an important role in the mechanical behavior of these tissues (Mak, 1986; Mow et al., 1993). Based on the biphasic theory (Mow et al., 1980), many mechanical models have been proposed to study the biomechanical properties of various tissue, such as the lumbar disc (Williams et al., 2007), stability of vesicles (Ni et al., 2007), the deformation of chondrocytes (Wu et al., 1999; Guilak and Mow, 2000; Wu and Herzog, 2006), the viscoelastic properties of articular cartilage (Ateshian et al., 1994; Ferguson et al., 2000; DiSilvestro and Suh, 2001; García and Cortés, 2006; Suh and Bai, 1998), the temporomandibular joint disc (Donzelli et al., 2004), the tendon in uniaxial tension (Yin and Elliott, 2004), cortical bone permeability (Malachanne et al., 2008), and so on. These models, based on a biphasic poroelastic theory, have successfully explained the experimental behavior and microstructure of these tissues.
Similarly, the vocal fold tissue is also essentially a biphasic material (Noordzij and Ossoff, 2006): inside the vocal fold mucosal covering, the tissue is loosely composed of specialized proteins, carbohydrates, lipids, collagen fibers, and elastin fibers. Liquid, such as extracellular sap, fills the spaces among these elastic solid structures. However, the poroelastic theory has not been used to predict the vocal fold vibration.
In this study, we propose a new vocal fold model, which is based on the biphasic assumption of the vocal fold tissue. In this new model, a transversally isotropic poroelastic solid represents the loose elastic solid structure in the tissue, and fluid occupying the pores in the solid represents the liquid component of the tissue. The porous solid, the fluid, and their interaction together determine the properties of vocal fold tissue (Tao et al., 2009; Biot, 1956a, b). The finite-difference method was used to discretize and numerically solve this model both in spatial and temporal domain. Because this fluid-saturated porous solid theory could be a more accurate description of the vocal fold tissue than one phase (solid or liquid) tissue descriptions, we can expect that this new vocal fold model could provide valuable information about vocal fold vibration that could not be provided by previous models.
2. Model development
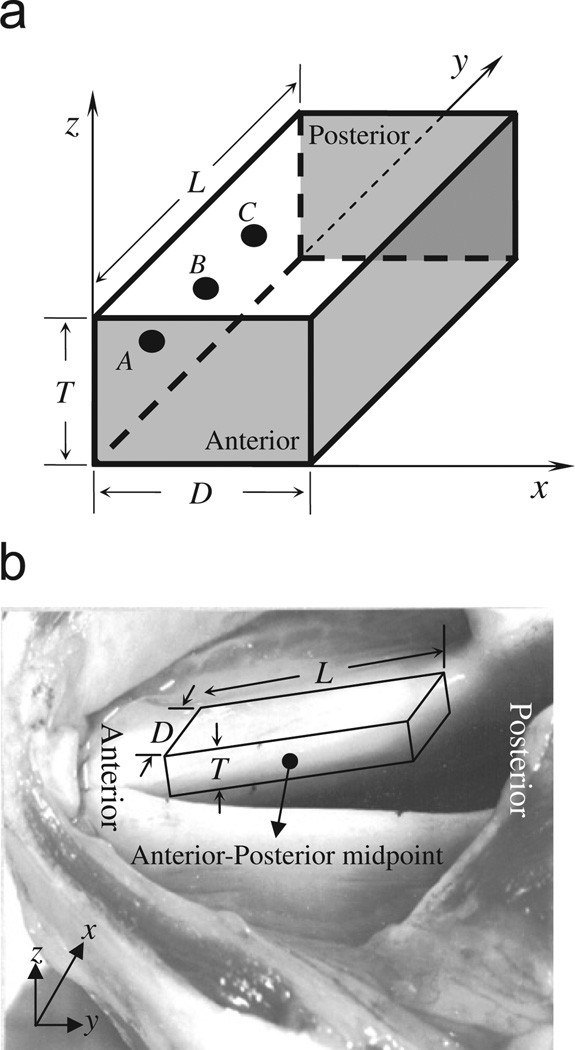
A rectangular parallelepiped with thickness (T) 0.4 cm, depth (D) 1.0 cm, and length (L) 1.6 cm was used to approximately represent a vocal fold (Fig. 1). The lateral, anterior–posterior, and inferior–superior distances are defined in x, y, and z coordinates, respectively.
Fig. 1.
The sketch map of the vocal fold model: (a) model structure and boundary condition, (b) the correspondence of the model to a real canine larynx, where T, D, and L represent the thickness, depth, and length of the vocal fold, respectively. The fixed boundary condition was applied on the gray surfaces (the anterior surface, the posterior surface, and the lateral surface). The free boundary condition was applied on the top surface (x–y plane at z = T) and the bottom surface (x–y plane at z = 0). A drive force based on Bernoulli’s law was applied on the medial surface (the y–z plane at x = 0) to generate the self-vibration of this model.
2.1. The fluid-saturated porous solid tissue theory
The tissue behavior in this model follows the fluid-saturated porous tissue description (Tao et al., 2009): (1) The solid component in the vocal fold tissue is porous and transversally isotropic. (2) There is no longitudinal dynamic strain, which is based on the finding that the longitudinal movement is much smaller that the lateral and vertical movement (Döllinger et al., 2005). (3) The stress–strain relationship of the porous solid is linear. (4) The liquid mass change due to its movement in the tissue is very small in comparison to its static mass. The stress and strain satisfy the following relationship:
| (1) |
where C = λ+2μ, λ and μ are the Lamé constants in the x–z plane, λ′ and μ′ are the Lamé constants along the longitudinal fiber axis, R measures the amount of water being forced into the cube element under a constant pressure, Q and Q′ are coupling coefficients of the solid volume change and the fluid volume change, ε = ∇U is the strain of the fluid, and U = (Ux, Uy, Uz) is the fluid displacement vector. eii = ∂ui/∂i (i = x, z) and eii = ∂ui/∂j+∂ui/∂i (i, j = x, y, z; i ≠ j) are the normal and the shear strain, where ui represents the displacement of the solid.
The lateral (x-direction) and vertical (z-direction) movements of vocal fold tissue satisfy
| (2) |
| (3) |
where i = x, j = z for the lateral movement and i = z, j = x for the vertical movement. Because the longitudinal movement of the solid part is ignored, the equation of motion in the y-direction includes only the liquid part
| (4) |
In the above equations, ρS and ρF represent the total solid and fluid mass in the fluid–solid aggregate per unit volume, γ is a damping constant related to the viscosity of solid, and πi is the force due to the solid–fluid interaction. For an isotropic material, πi can be related to the fluid–solid relative motion by (Biot, 1956a)
| (5) |
Gray et al. (1993) have shown that the vast majority of the fibers in vocal fold are aligned longitudinally. Therefore, the permeability of fluid parallel to the longitudinal direction is expected to be significantly higher than in other directions. In this situation, considering the fibers bend during vibration, πy should be modified as
| (6) |
2.2. Space discretization
In this subsection, in order to simplify the notation, we use one symbol u to represent ux, uy, Ux, Uy, and Uz. The symbol ui,j,k represents the value of u at (x, y, z) = (iΔx, jΔy, kΔz), where Δx = 0.1 cm, Δy = 0.08 cm, and Δz = 0.04 cm are the step sizes in x, y, z coordinates, respectively. We have
| (7) |
and
| (8) |
Similar finite-difference scheme can also be used to discrete the spatial partial derivate ∂2u/∂y2, ∂2u/∂z2, ∂2u/∂x ∂z, and ∂2u/∂y ∂z. Then, the spatial partial derivative in Eqs. (2)–(6) can be discretized, which yields a solution to the spatial problem.
2.3. Time integration
The temporal problems in Eqs. (2)–(6) were also solved by a finite-difference scheme. For the ease of notation, letting Fi and fi represent the right-hand side of Eqs. (2) and (3), we can rewrite them as
| (9a) |
| (9b) |
where Mi = ρS+αi, mi = ρF+αi, Di = γ+βi, and i = x, z. Using a central difference approximation ∂φ/∂t = (φn+1−φn−1)/2Δt and ∂2φ/∂t2 = (φn+1−2φn+φn−1)/Δt2 (ϕ represents variables in Eqs. (9a) and (9b); φn represents the value of φ at time nΔt; Δt = 50 × 10−6 s is the integration time step), we can write Eqs. (9a) and (9b) as
| (10) |
where a1 = Mi/Δt2+Di/2Δt, a2 = b1 = −αi/Δt2−βi/2Δt, b2 = mi/Δt2+βi/2Δt, .
Similarly, substituting Eq. (6) into Eq. (4) and using the central difference approximation instead of the derivative with respect to time, we have
| (11) |
where My = ρS+αy and .
2.4. Boundary and initial conditions
With appropriate boundary conditions and initial conditions, the displacement vector at any time t = nΔt can be obtained by using the recursive relation equations (10) and (11) and the vocal fold vibration can be completely determined. In this study, we defined the boundary and initial conditions as follows.
The fixed boundary conditions (i.e., ui = Ui≡0, i = x, y, z) were applied on the anterior side, posterior side, and the lateral surface, (see the gray planes in Fig. 1(a)). The free boundary conditions were applied on the top and bottom surface. Moreover, because the vocal fold mucosal covering consists of a stratified squamous epithelium, it is assumed that there is no relative movement between liquid and solid in the boundary surface. A drive force following Bernoulli’s law,
| (12) |
was applied on the medial surface to represent the airflow–tissue interaction in the glottis. Here represents the glottal area at position z, G(zm) is the minimum glottal area at z = zm, i.e., G(zm)≤G(z) for ∀z, and Ps is the subglottal pressure. From zm to the glottal exit, the drive force Pair is set to 0. G0 = 0.05 cm is the prephonatory glottal half-width, and ux(nΔy, z) is the lateral displacement of the node at (y, z) = (nΔy, z) of the medial surface. The collision between left–right vocal folds is not included in the current model.
The displacements of the nodes on the inferior half of the medial surface are initiated as , which is equivalent to an initial velocity . The displacement and velocity of all the other nodes are initiated as zero.
3. Results
Using the proposed model, we studied the vocal fold vibration. The parameters used in this study are given in Table 1, where the elastic parameters, such as μ and μ′, are measured from various vocal fold tissues (Alipour and Titze, 1991; Chan and Titze, 1999). Approximate values of these elastic constants have been successfully used in the previous elastic models (Alipour et al., 2000). In order to simplify the following discussion, we named three nodes at (x, y, z) = (0.1 cm, 0.4 cm, 0.2 cm), (0.1 cm, 0.8 cm, 0.2 cm), and (0.1 cm, 1.2 cm, 0.2 cm) in the model as nodes A, B, and C (see Fig. 1).
Table 1.
The parameters used in the vocal fold model.
| ρs | 0.9 g/cm3 | λ | 3.5 kPa |
| ρF | 0.1 g/cm3 | γ | 100.0 g/s cm3 |
| μ′ | 20.0 kPa | βx,z | 440.0 g/s cm3 |
| μ | 0.50 kPa | βy | 100.0 g/s cm3 |
| αx,z | 0.02 g/cm3 | R | 0.20 kPa |
| αy | 0.00 g/cm3 | Q | 0.15 kPa |
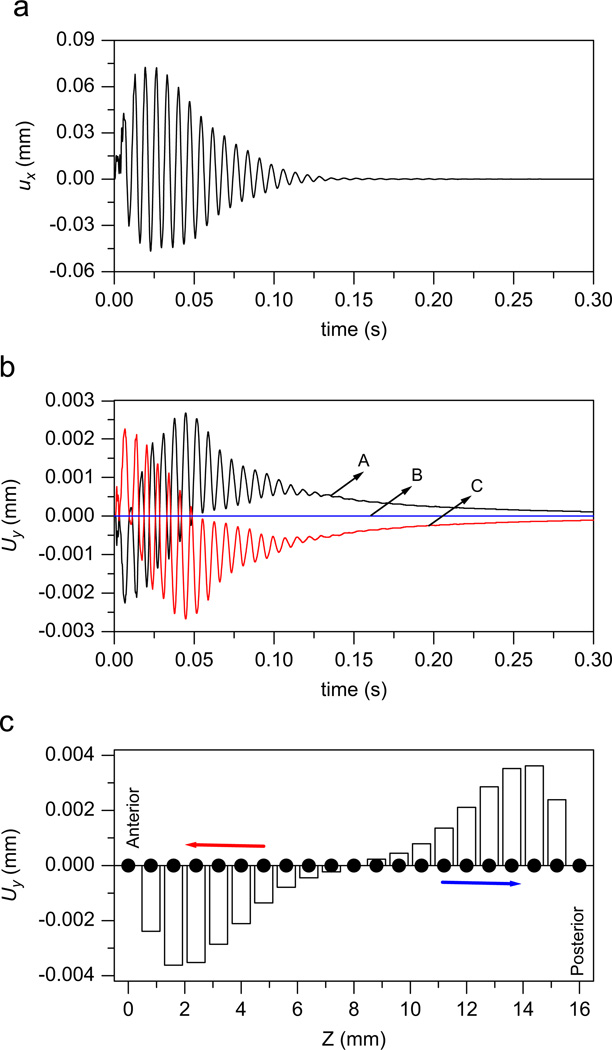
Fig. 2(a) illustrates the ux waveform of node A with the subglottal pressure Ps = 0.5 kPa (≈5 cm H2O). The initial velocity allows the vocal folds to begin vibrating. However, this low lung pressure cannot sustain the stable vibration. The energy transfused into the vocal folds due to tissue–airflow interaction is smaller than the energy loss due to the viscosity (Titze, 1988). Therefore, the vibrating amplitude will decrease over time. Finally, ux will approach zero. The current model can also simulate the fluid dynamics in vocal fold tissue. Fig. 2(b) gives the waveform of the liquid displacement Uy at the nodes A, B, and C. Fig. 2(c) presents the anterior–posterior distribution of liquid displacement Uy of the nodes at time t≤0, t = 0.006 s, and t = 1.0 s, respectively. Before vibrating (t≤0), there is no liquid movement, and the liquid displacement is zero. The vibration will cause the liquid to move in the vocal fold. At t = 0.006 s, with the initial velocity 20 cm/s of the medial surface, the vocal fold is open and the lateral displacement of the tissue is greatest at the anterior–posterior midpoint. The greatest compression of the tissue at the midpoint forces the fluid away from the midpoint and towards the end points. Therefore, the liquid displacement Uy is negative in the anterior side and positive in the posterior side (see Fig. 2(c)). With the decrease in vibratory amplitude, the liquid displacement Uy also decreases. Finally, the liquid is restored to its initial distribution after the vocal fold stops vibrating (see Fig. 2(b) and (c)).
Fig. 2.
The model outputs with subglottal pressure Ps = 0.5 kPa (≈5 cm H2O). (a) The ux waveform of node A. (b) The waveforms of the liquid displacement at nodes A, B, and C. (c) The anterior–posterior distribution of liquid displacement Uy, where the white columns and the black dots represent the liquid displacement at t = 0.006 and 1.0 s, respectively. At the beginning, the liquid in the vocal folds is transported toward the anterior and sides. Finally, the liquid is restored to its initial distribution after the vocal folds stop vibrating.
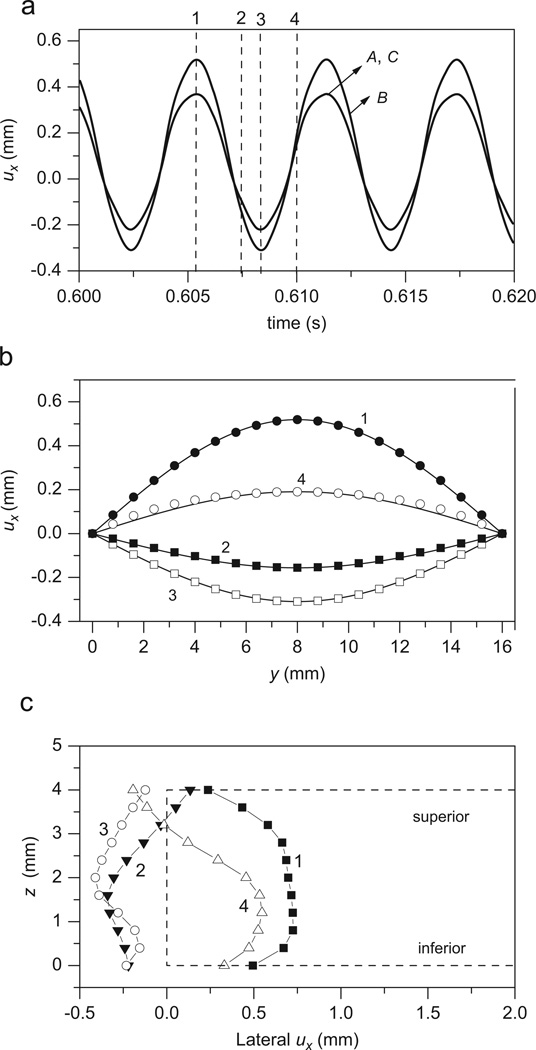
By increasing the subglottal pressure, this model can generate a self-oscillating solution. For the current model, vocal fold vibration can be initiated and sustained when the subglottal pressure Ps≥Pth = 0.555 kPa, where Pth is the phonation threshold pressure (PTP). This PTP value is within the PTP range measured in an excised larynx (Hottinger et al., 2007). Fig. 3(a) presents the ux waveform of the nodes A, B, and C with Ps = 0.7 kPa. The vocal fold is vibrating with a fundamental frequency of 167.5 Hz. The vibration amplitude of the midpoint node A is greater than the amplitudes of the other nodes. Along the anterior–posterior direction, the lateral displacement approximately follows a sinusoidal distribution (see Fig. 3(b)). The displacement of the medial surface is presented in Fig. 3(c). When the medial surface moves toward the midplane between the left and right vocal folds (curve 2), the glottis has a divergent shape, whereas when the medial surface moves apart from the midplane (curve 4), the glottis has a convergent shape. These results suggest a low-order mode as predicted by the elastic model (Titze, 2006) and agree with the knowledge of mucosal wave propagation during phonation (Jiang et al., 2000). Empirical eigenfunctions (EEF) extracted from the vibration sequence of the medial surface confirm that the largest two EEFs captured 99% of the total energy, which agree with EEFs extracted from the excised larynx experiments (Döllinger et al., 2005; Zhang and Jiang, 2005) and the viscoelastic model (Berry et al., 1994; Alipour et al., 2000). These results primarily validate the new model.
Fig. 3.
The model outputs with subglottal pressure Ps = 0.7 kPa (≈7 cm H2O). (a) The ux waveform of nodes A, B, and C. (b) The distribution of the lateral displacement ux along the anterior–posterior direction (y-direction). (c) The lateral displacement ux of the medial surface, where the curves 1, 2, 3, and 4 correspond to the displacements at t = 0.6054, 0.6075, 0.60835, and 0.61 s, respectively. The dashed line in (c) represents the static shape of the vocal fold.
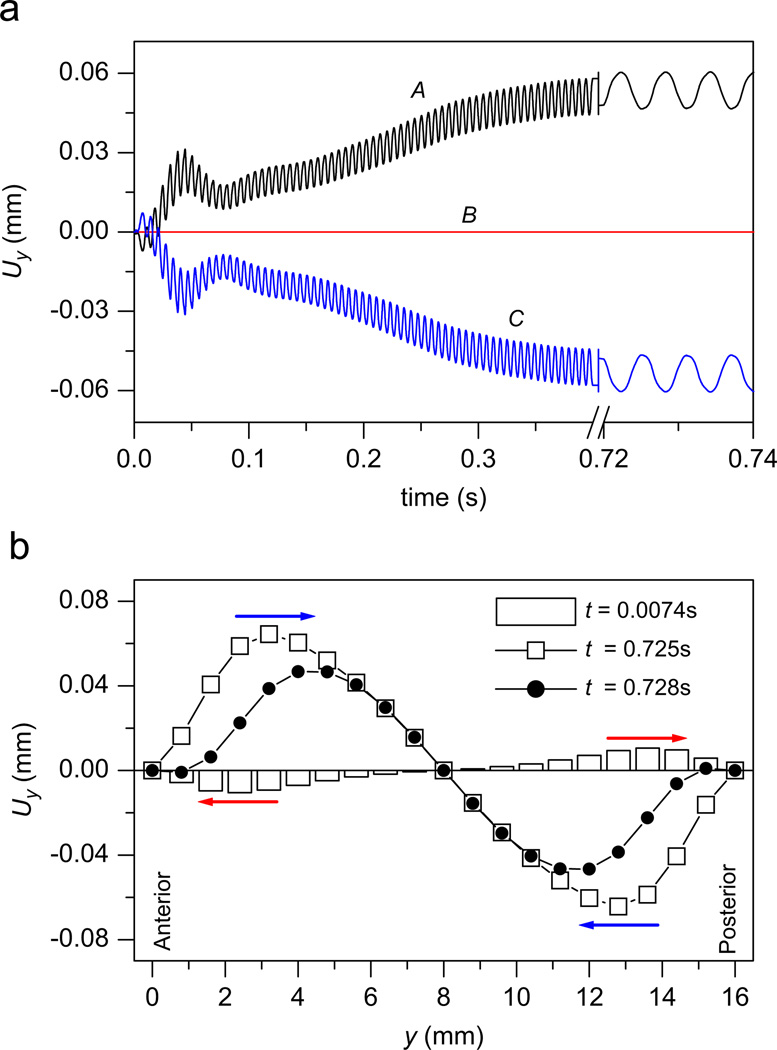
The prediction of the liquid dynamics in vibrating vocal folds is one important advantage of the proposed model. Fig. 4 gives the liquid movement in a vibrating vocal fold. At the beginning stage (t = 0.0074 s), the vocal fold is pushed apart and the liquid is pressed moving toward the anterior and posterior sides, which is similar to the situation reported in Fig. 3. However, the difference is that the waveform of Uy in the vocal folds will not attenuate, but rather, it will keep vibrating. This is because the vibration of the vocal folds can be sustained with Ps = 0.7 kPa. Finally, the liquid movement Uy will approach a stable vibration when t → ∞. In this stable vibration stage, the time average of the liquid displacement Uy is positive in the anterior side and negative in the posterior side, which suggests that the liquid in the vocal folds is pushed toward the midpoint of the vocal folds.
Fig. 4.
The model outputs with subglottal pressure PL = 0.7 kPa (≈7 cm H2O). (a) The waveforms of the liquid displacement Uy at nodes A, B, and C. (b) The anterior–posterior distribution of liquid displacement Uy, where the white columns, the black dots, and the white squares represent the liquid displacement at t = 0.0074, 0.725 s, and 0.728 s, respectively. At the beginning, the liquid in the vocal folds is transported toward the anterior and posterior sides. However, after the vibration is sustained, the liquid will move toward the anterior–posterior midpoint of the vocal folds.
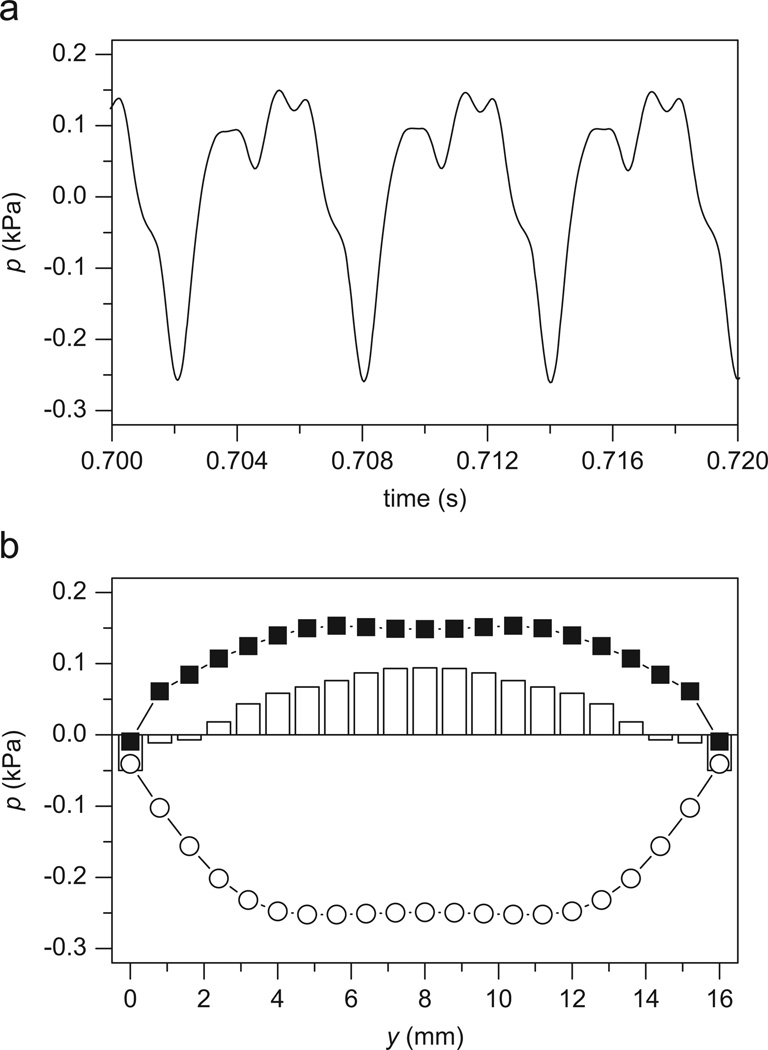
Liquid movement will cause the change of liquid pressure (see Eq. (1)). Moreover, the high-pressure liquid in the vibrating vocal folds could be associated with the development of vocal nodules (Jiang, 1991). Therefore, the prediction of the liquid pressure in the vibrating vocal folds could have important clinical significance. Fig. 5 presents the distribution of the liquid pressure in vibrating vocal folds. The liquid pressure p is estimated by p = −s/β (Biot, 1956a), where β = 0.1 is the fraction of fluid area per unit cross section and s = Qexx+Qezz+Rε is the force acting on the fluid portion of each face of the fluid–solid cube (see Eq. (1)). It can be seen that the liquid pressure around the anterior–posterior midpoint is greater than the liquid pressure at either the anterior or posterior side.
Fig. 5.
The liquid pressure p in the vibrating vocal fold. (a) The waveforms of the liquid pressure p at node A. (b) The anterior–posterior distribution of liquid pressure p, where the white circles, the white columns, and the black squares represent the liquid pressure at t = 0.702, 0.704, and 0.7054 s, respectively.
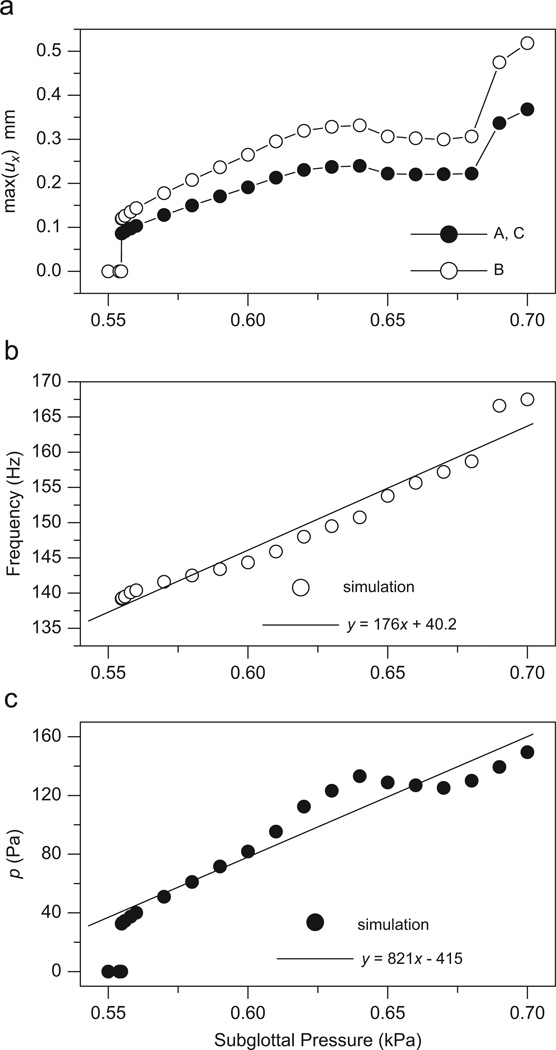
Subglottal pressure is an important factor in controlling vocal fold vibration and voice production. Fig. 6 illustrates the maximum lateral displacement ux, the fundamental frequency, and the liquid pressure predicted by the model as a function of the subglottal pressure (0.55–0.70 kPa). The solid lines (y = 176x+40.2 and y = 821x–415) in Fig. 6(b) and (c) are the linear regressions for the simulated fundamental frequency and liquid pressure at node B. When Ps<0.555 kPa, the vibration of the vocal folds cannot be sustained and the vibratory amplitude is zero. At Ps = 0.555 kPa, Hopf bifurcation occurs, and phonation is initiated. Furthermore, when Ps>0.555 kPa, the overall vibratory amplitude is increased along with the subglottal pressure. However, when the subglottal pressure is about 0.64–0.66 kPa, the amplitude is decreased with Ps. A possible reason for this non-monotonic change of ux could be mode switch or resonance at a specific fundamental frequency (Alipour and Scherer, 2007). The fundamental frequency increases in an approximately linear fashion along with Ps. Therefore, we use a linear regression for the simulation data (the solid line in Fig. 6(b)). The slope of the linear fit is 176 Hz/kPa≈ 17.6 Hz/cm H2O, which is within the experimentally measured range of dF0/dPs 1–20 Hz/cm H2O (Alipour and Scherer, 2007). The liquid pressure in the vocal folds also increases along with the subglottal pressure (Fig. 6(c)). The liquid pressure (149.5 Pa at Ps = 0.7 kPa) is about 4.5 times greater than the liquid pressure (33.2 Pa at Ps = 0.555 kPa).
Fig. 6.
The influence of subglottal pressure on (a) the maximum solid lateral displacement ux, (b) the fundamental frequency, and (c) the liquid pressure. In (b) and (c), the solid lines are the linear regressions for the data predicted by the proposed model.
4. Conclusion
The main purpose of this study is to provide and validate a new vocal fold model. Unlike previous vocal fold models, this model is based on the fluid-saturated porous solid tissue theory (Biot, 1956a, b; Tao et al., 2009). One important advantage of this new model is that it can predict the liquid dynamics in the vibrating vocal fold tissue. These phenomena cannot be predicted by the previous vocal fold models based on the elastic theory. The simulation found that the liquid in the vocal fold tissue could accumulate at the anterior–posterior midpoint, which could cause the pressure increase in the liquid. Liquid pressure increases with subglottal pressure. Czerwonka et al. (2008) thought that the development of some vocal disease, such as vocal nodules or edema, could be related to the liquid dynamics. Therefore, we expect that this new model could provide a more vivid description of vocal fold vibration and have important clinical value in investigating vocal diseases.
In addition, some biphasic parameters used in this model have not been well measured in the vocal fold tissue. The experimental measurement of these biphasic constants of the vocal fold tissue might be valuable to improve the fluid-saturated poroelastic vocal fold model.
Acknowledgements
This study was supported by NIH Grant nos. 1-RO1DC05522 and 1-RO1DC006019 from the National Institute of Deafness and other Communication Disorders.
References
- Alipour F, Titze IR. Elastic models of vocal fold tissues. The Journal of Acoustical Society of America. 1991;90(3):1326–1331. doi: 10.1121/1.401924. [DOI] [PubMed] [Google Scholar]
- Alipour F, Berry DA, Titze IR. A finite-element model of vocal-fold vibration. The Journal of Acoustical Society of America. 2000;108:3003–3012. doi: 10.1121/1.1324678. [DOI] [PubMed] [Google Scholar]
- Alipour F, Scherer RC. On pressure–frequency relations in the excised larynx. The Journal of the Acoustical Society of America. 2007;122:2296–2305. doi: 10.1121/1.2772230. [DOI] [PubMed] [Google Scholar]
- Ateshian GA, Lai WM, Zhu WB, Mow VC. An asymptotic solution for the contact of two biphasic cartilage layers. Journal of Biomechanics. 1994;27:1347–1360. doi: 10.1016/0021-9290(94)90044-2. [DOI] [PubMed] [Google Scholar]
- Berry DA, Herzel H, Titze IR, Krischer K. Interpretation of biomechanical simulations of normal and chaotic vocal fold oscillations with empirical eigenfunctions. The Journal of the Acoustical Society of America. 1994;95:3595–3604. doi: 10.1121/1.409875. [DOI] [PubMed] [Google Scholar]
- Biot MA. Theory of propagation of elastic waves in a fluid-saturated porous solid, I: low-frequency range. The Journal of Acoustical Society of America. 1956a;28:168–178. [Google Scholar]
- Biot MA. Theory of propagation of elastic waves in a fluid-saturated porous solid, II: higher frequency range. The Journal of Acoustical Society of America. 1956b;28:179–191. [Google Scholar]
- Chan RW, Titze IR. Viscoelastic shear properties of human vocal fold mucosa: measurement methodology and empirical results. The Journal of Acoustical Society of America. 1999;106:2008–2021. doi: 10.1121/1.427947. [DOI] [PubMed] [Google Scholar]
- Czerwonka L, Jiang JJ, Tao C. Vocal nodules and edema may be due to vibration-induced rises in blood pressure. Laryngoscope. 2008;18:748–752. doi: 10.1097/MLG.0b013e31815fdeee. [DOI] [PMC free article] [PubMed] [Google Scholar]
- DiSilvestro MR, Suh J-KF. A cross-validation of the biphasic poroviscoelastic model of articular cartilage in unconfined compression, indentation, and confined compression. Journal of Biomechanics. 2001;34:519–525. doi: 10.1016/s0021-9290(00)00224-4. [DOI] [PubMed] [Google Scholar]
- Donzelli PS, Gallo LM, Spilker RL, Palla S. Biphasic finite element simulation the TMJ disc from in vivo kinematic and geometric measurements. Journal of biomechanics. 2004;37:1787–1791. doi: 10.1016/j.jbiomech.2004.01.029. [DOI] [PubMed] [Google Scholar]
- Döllinger M, Berry DA, Berke GS. Medial surface dynamics of an in vivo canine vocal fold during phonation. The Journal of Acoustical Society of America. 2005;117:3174–3183. doi: 10.1121/1.1871772. [DOI] [PubMed] [Google Scholar]
- Ferguson SJ, Bryant JT, Ganz R, Ito K. The influence of the acetabular labrum on hip joint cartilage consolidation: a poroelastic finite element model. Journal of Biomechanics. 2000;33:953–960. doi: 10.1016/s0021-9290(00)00042-7. [DOI] [PubMed] [Google Scholar]
- García JJ, Cortés DH. A nonlinear biphasic viscohyperelastic model for articular cartilage. Journal of Biomechanics. 2006;39:2991–2998. doi: 10.1016/j.jbiomech.2005.10.017. [DOI] [PubMed] [Google Scholar]
- Gray SD, Hirano M, Sato K. Molecular and cellular structure of vocal fold tissue. In: Titze IR, editor. Vocal Fold Physiology: Frontiers of Basic Science. San Diego: Singular; 1993. pp. 1–34. [Google Scholar]
- Guilak F, Mow VC. The mechanical environment of the chondrocyte: a biphasic finite element model of cell–matrix interactions in articular cartilage. Journal of Biomechanics. 2000;33:1663–1673. [PubMed] [Google Scholar]
- Gunter HE. Modeling mechanical stresses as a factor in the etiology of benign vocal fold lesions. Journal of Biomechanics. 2004;37:1119–1124. doi: 10.1016/j.jbiomech.2003.11.007. [DOI] [PubMed] [Google Scholar]
- Hottinger DG, Tao C, Jiang JJ. Comparing phonation threshold flow and pressure by abducting excised larynges. The Laryngoscope. 2007;117:1695–1699. doi: 10.1097/MLG.0b013e3180959e38. [DOI] [PubMed] [Google Scholar]
- Hunter EJ, Titze IR, Alipour F. A three-dimensional model of vocal fold abduction/adduction. The Journal of Acoustical Society of America. 2004;115:1747–1759. doi: 10.1121/1.1652033. [DOI] [PMC free article] [PubMed] [Google Scholar]
- Jiang JJ. Ph.D. Dissertation. The University of Iowa; 1991. A methodological study of hemilaryngeal phonation and the measurement of vocal fold intraglottal pressure and impact stress. [Google Scholar]
- Jiang JJ, Chang CIB, Raviv JR, Gupta S, Banzali FM, Hanson DG. Quantitative study of mucosal wave via videokymography in canine larynges. Laryngoscope. 2000;110:1567–1573. doi: 10.1097/00005537-200009000-00032. [DOI] [PubMed] [Google Scholar]
- Mak AK. The apparent viscoelastic behavior of articular cartilage—the contributions from the intrinsic matrix viscoelasticity and interstitial fluid flows. Journal of Biomechanical Engineering. 1986;108:123–130. doi: 10.1115/1.3138591. [DOI] [PubMed] [Google Scholar]
- Malachanne E, Dureisseix D, Canadas P, Jourdan F. Experimental and numerical identification of cortical bone permeability. Journal of Biomechanics. 2008;41:721–725. doi: 10.1016/j.jbiomech.2007.09.028. [DOI] [PubMed] [Google Scholar]
- Mow VC, Ateshian GA, Spilker RL. Biomechanics of diarthrodial joints: a review of twenty years of progress. Journal of Biomechanical Engineering. 1993;115:460–467. doi: 10.1115/1.2895525. [DOI] [PubMed] [Google Scholar]
- Mow VC, Kuei SC, Lai WM, Armstrong CG. Biphasic creep and stress relaxation of articular cartilage in compression: theory and experiments. Journal of Biomechanical Engineering. 1980;102:73–84. doi: 10.1115/1.3138202. [DOI] [PubMed] [Google Scholar]
- Ni D, Shi H, Yin Y, Niu L. Stability of biphasic vesicles with membrane embedded proteins. Journal of Biomechanics. 2007;40:1512–1517. doi: 10.1016/j.jbiomech.2006.06.015. [DOI] [PubMed] [Google Scholar]
- Noordzij JP, Ossoff RH. Anatomy and Physiology of the Larynx. Otolaryngologic Clinics of North America. 2006;39:1–10. doi: 10.1016/j.otc.2005.10.004. [DOI] [PubMed] [Google Scholar]
- Suh JK, Bai S. Finite element formulation of biphasic poroviscoelastic model for articular cartilage. Journal of Biomechanical Engineering. 1998;120:195–201. doi: 10.1115/1.2798302. [DOI] [PubMed] [Google Scholar]
- Tao C, Jiang JJ. Anterior–posterior biphonation in a finite element model of vocal fold vibration. The Journal of the Acoustical Society of America. 2006;120:1570–1577. doi: 10.1121/1.2221546. [DOI] [PubMed] [Google Scholar]
- Tao C, Jiang JJ, Zhang Y. Simulation of vocal fold impact pressures with a self-oscillating finite-element model. The Journal of the Acoustical Society of America. 2006;119:3987–3994. doi: 10.1121/1.2197798. [DOI] [PubMed] [Google Scholar]
- Tao C, Jiang JJ, Czerwonka L. Liquid accumulation in vibrating vocal fold tissue: a simplified model based on a fluid-saturated porous solid theory. Journal of Voice. 2009 doi: 10.1016/j.jvoice.2008.09.005. in press. [DOI] [PMC free article] [PubMed] [Google Scholar]
- Tao C, Jiang JJ. Mechanical stress during phonation in a self-oscillating finite-element vocal fold model. Journal of Biomechanics. 2007;40:2191–2198. doi: 10.1016/j.jbiomech.2006.10.030. [DOI] [PubMed] [Google Scholar]
- Titze IR, Strong WJ. Normal modes in vocal cord tissues. The Journal of Acoustical Society of America. 1975;57:736–744. doi: 10.1121/1.380498. [DOI] [PubMed] [Google Scholar]
- Titze IR. On the mechanics of vocal-fold vibration. The Journal of Acoustical Society of America. 1976;60:1366–1380. doi: 10.1121/1.381230. [DOI] [PubMed] [Google Scholar]
- Titze IR. The physics of small-amplitude oscillation of the vocal folds. The Journal of Acoustical Society of America. 1988;83:1536–1552. doi: 10.1121/1.395910. [DOI] [PubMed] [Google Scholar]
- Titze IR. The Myoelastic-Aerodynamic Theory of Phonation. Denver, CO: National Center for Voice and Speech; 2006. [Google Scholar]
- Tsai C-G, Hsiao T-Y, Shau Y-W, Chen J-H. Towards an intermediate water wave model of vocal fold vibration: evidence from vocal-fold dynamic sonography; The Fifth International Conference on Voice Physiology and Biomechanics; Tokyo, Japan. 2006. [Google Scholar]
- Williams Jamie R, Natarajan Raghu N, Andersson Gunnar BJ. Inclusion of regional poroelastic material properties better predicts biomechanical behavior of lumbar discs subjected to dynamic loading. Journal of Biomechanics. 2007;40:1981–1987. doi: 10.1016/j.jbiomech.2006.09.022. [DOI] [PMC free article] [PubMed] [Google Scholar]
- Wu JZ, Herzog W, Epstein M. Modelling of location- and time-dependent deformation of chondrocytes during cartilage loading. Journal of Biomechanics. 1999;32(6):563–572. doi: 10.1016/s0021-9290(99)00034-2. [DOI] [PubMed] [Google Scholar]
- Wu JZ, Herzog W. Analysis of the mechanical behavior of chondrocytes in unconfined compression tests for cyclic loading. Journal of Biomechanics. 2006;39:603–616. doi: 10.1016/j.jbiomech.2005.01.007. [DOI] [PubMed] [Google Scholar]
- Yin L, Elliott DM. A biphasic and transversely isotropic mechanical model for tendon: application to mouse tail fascicles in uniaxial tension. Journal of Biomechanics. 2004;37:907–916. doi: 10.1016/j.jbiomech.2003.10.007. [DOI] [PubMed] [Google Scholar]
- Zhang Y, Jiang JJ. Spatiotemporal chaos in excised larynx vibrations. Physical Review E. 2005;72(3):035201–035214. doi: 10.1103/PhysRevE.72.035201. [DOI] [PubMed] [Google Scholar]


