

Abstract
Objective
This study investigated the developmental course of autistic traits in a nationally-representative sample between ages 7 and 13.
Method
The parents of 6,539 children in the Avon Longitudinal Study of Parents and Children (ALSPAC) completed the Social and Communication Disorders Checklist (SCDC) at ages 7, 10, and 13. The phenotypic progression of autistic traits was assessed in the full sample and among high scoring individuals (e.g. top 10%, 5%). Gender, IQ, and overall behavior difficulties were examined as potentially relevant influences on autistic trait trajectories.
Results
Autistic traits were highly stable in the general population, both overall and in high scoring groups. In the full sample, there was no change in mean SCDC scores for females between ages 7 and 13 (p=0.43). Male scores decreased slightly, but significantly, on the order of 0.1 standard deviations (p<0.001). There was no mean change in parent-rated autistic traits within any of the high scoring groups. IQ was not related to phenotypic progression; high parent-rated behavior problems predicted slight improvement in SCDC scores over the course of the study period among high scoring individuals (p<0.01).
Conclusions
These findings suggest that autistic traits are highly stable in the general population, even among individuals with the highest concentrations of autism-like behaviors. Phenotypic stability is consistent with expectations for individuals with ASD, providing further support for a phenomenological continuum across the clinical threshold. Moreover, the gap between female and male risk for autistic symptomology is consistent over time.
Keywords: Autism spectrum disorders, autistic traits, longitudinal analysis, ALSPAC
Introduction
A growing body of population-based studies suggests that autism spectrum disorders (ASD) exist at the extreme of a social and communication impairment continuum. In the general population, the continuum extends from: a) zero or few autism-like behaviors (autistic traits) to b) a very high number of traits, exceeding that necessary to meet base criteria for a diagnosis of ASD 1. As first evidenced by Constantino and Todd (2003), there is no evidence of discontinuity in the population distribution of autistic traits that distinguishes between clinical and subclinical social-communication impairment. A bimodal pattern in the trait distribution may, for example, suggest such a discontinuity. However, the distribution of autistic traits is continuous across the behavioral range 1-2.
Little is known about the stability of autistic traits in the general population over time. This study will further consider the consistency between clinical and subclinical autism-like phenotypes by examining the progression of autistic traits longitudinally in a large, population-based sample. Developmental analyses within clinical populations have reported variant trajectories with regard to quantitative trait indicators 3-5. Some improvement is common, especially with regard to verbal fluency 6-8. However, despite some change in specific skills, the great majority of cases maintain major impairment in social and communication behavior, characteristics definitional to the ASD diagnosis 7, 9-12. Accordingly, despite some variability within the phenotype, the broad gap in quantitative trait scores between those with a diagnosis and the population as a whole is on average maintained. Coherence between sub-threshold and clinically significant autistic traits would therefore be indicated through evidence of developmental stability in the general population, across levels of impairment.
This is the first analysis to examine the trajectory of autism-like behaviors in a nationally-representative sample. The only previous general population study to investigate quantitative change was conducted by Constantino et al. (2009) and included 95 male twin pairs. They reported modest mean improvement in parent-rated social impairment over the five year follow-up period, on the order of half a standard deviation using the Social Responsiveness Scale, though individual scores were strongly correlated between the two time points (ICC=0.71) 13. The correlation between autistic trait scores across multiple measurement periods was also examined by Hoekstra et al. (2010) in a British twin sample. The authors similarly report a strong association between traits assessed at ages 7/8, 9, and 12 (ICC 0.59-0.69) in both the general population and high scoring individuals 14.
This study is also uniquely capable of considering the influence of sex and IQ on autism-like behavioral trajectories. A sex by IQ interaction in the population prevalence of ASD has been consistently noted over the last several decades 15-17. In a comprehensive review by Fombonne (2003), he found an average sex ratio of 5.75:1 (male:female) in 12 epidemiologic studies where the calculation was restricted to IQ-normative individuals. In 11 studies with the converse restriction, the average sex ratio was 1.9:1. Skuse et al. (2009) presented evidence that this sex by IQ interaction is not limited to diagnostic groups; autistic traits in the general population display a similar pattern. In their general population sample, verbal IQ was continuously protective against autistic traits in females only. As with the clinical diagnosis, excess male risk for autism-like behaviors in the general population was accordingly greatest for those in the highest IQ category 18.
Given a) the relative preponderance of females among individuals with autism and low IQ and b) the potential importance of IQ in phenotypic improvement, it is difficult to assess sex differences in change without controlling for cognitive potential. Most studies in clinical populations, however, are substantially underpowered to consider either sex or IQ as covariates in longitudinal studies. With a sample size of nearly 6,000, this analysis will be the first to consider the dual effects of sex and IQ on phenotypic development.
Developmental stability may carry significant implications regarding the mechanisms underlying the sex disparity. Consistency in the male-female symptomatic gap over time would suggest a stable protective mechanism associated with female sex. If the gap in symptomology increases over time, it could indicate that the male-female disparity is in part due to a female advantage in learning or adaptive behavior. We address these possibilities directly through a series of general population, longitudinal models considering: a) the relationship between sex, change, and IQ and b) the relationship between sex, change, and overall behavioral difficulties.
Method
Sample
The participants in this study are a subsample of the Avon Longitudinal Study of Parents and Children (ALSPAC) cohort 19. The core ALSPAC cohort consists of 14,541 pregnancies enrolled in county Avon, United Kingdom. All women in the study area with expected dates of delivery between April 1, 1991 and December 31, 1992 were invited to participate. Those pregnancies resulted in 13,988 children who were alive at one year of age. These children constitute the ALSPAC ‘initial cohort’ from which this subsample is drawn. Ethical approval for the study was obtained from the ALSPAC Law and Ethics Committee and the Local Research Ethics Committee.
This analysis was limited to participants assessed in the intensive ‘Focus at 8’ clinic (at age 8), during which IQ was measured. All children in the initial sample were invited to participate in Focus at 8 with the exception of children whose a) address was unknown or b) families had previously refused to participate further in the study. Excluding the 8.7% (n=1,222) of children no longer eligible, 56.0% of the initial cohort (7,173) attended the Focus at 8 clinic. Of those, 7,044 completed the IQ assessment. A slightly lower percentage of males (50.1%) attended Focus at 8 compared to the portion of the initial cohort that did not attend (53.3%; χ2 =14.0, p<0.001). Attendees were also generally of higher socioeconomic position—families were more likely to be home owners (83.3% versus 62.1%; χ2 =775.5, p<0.001) and mothers were more likely to have completed A levels (43.3% versus 25.4%; χ2 =631.3, p<0.001).
The analytic sample was further limited to those individuals whose parents had completed at least one autism-like behaviors (SCDC) measurement. The SCDC was included in survey measures sent to all participating families at 7, 10, and 13 years of age (91, 128, and 166 months). Of the 7,044 children with a measured IQ score, the SCDC was completed by 5,818 (82.6%), 5,560 (78.9%), and 5,206 (73.9%) of their parents at each of those time points respectively. The final sample included the 6,539 children with a measured IQ score and at least one SCDC score. Over 87% (n=5,716) of the children had measured SCDC values at two time points and 66.2% (n=4,329) had measured SCDC values for all three time points. Demographically, children in the final sample were highly similar to those in the Focus at 8 group. There were no differences in home ownership (χ2 =2.3, p=0.13), maternal education (χ2=3.0, p=0.09), or gender composition (χ2 =0.03, p=0.87).
Measures
Autism-like behaviors
Autism-like behaviors (ALB) were assessed using the Social and Communication Disorders Checklist (SCDC) 18. The SCDC is a 12 item parent-report scale capturing the degree to which a series of statements regarding the child’s behavior in the last 6 months is accurate (0=not true; 1=quite or sometimes true; 2=very or often true). For example, question 1 reads: “not aware of other people’s feelings.” The range of the scale is 0-24, 24 being the highest concentration of social and communication impairment. The internal consistency reliability (ICR) of the measure is 0.93 18. The SCDC has high discriminant validity in this sample: the average score of individuals with an ASD diagnosis was 14.85 at 7 years, the average score of individuals without was 2.70. Using ROC (receiver operating characteristic) analysis in a similar ALSPAC sample, Skuse et al. (2009) determined that a score of 8 or above maximizes the scale’s sensitivity (0.88) and specificity (0.91) to an ASD diagnosis. The score of 8 was therefore used as one criterion for identifying high scoring individuals in this analysis. Percentile cutoffs of 90% and 95% were also employed.
IQ
The Weschler Intelligence Scale for Children-Third Edition (WISC-III), was administered to participants of the Focus at 8 clinical subcohort. The WISC is a commonly used measure designed to capture IQ in children ages 6 to 16 20. ALSPAC participants completed an abbreviated WISC that included randomly selected items from each of the 10 subtests. In the Focus at 8 cohort, mean full scale IQ was 104.0 (standard deviation=16.6). Mean performance IQ (99.5, sd=17.1) was lower than mean verbal IQ (107.0, sd=16.8).
Behavioral Difficulties
The Strengths and Difficulties Questionnaire (SDQ) was used to assess emotional and behavioral challenges at age 9. The SDQ is a 25 item scale with high reliability and validity 21. Total SDQ scores were derived through a prorated, weighted sum of the hyperactivity, emotional symptoms, conduct problems, prosocial behavior, and peer problems subscales. Total scores range from zero to 40, with 40 indicating the greatest clustering of behavioral problems. The prorated SDQ mean (5.98, sd=4.58), a score derived by adjusting for the total number of items completed, was slightly lower than the complete case mean (6.36, sd=4.84). However, use of the prorated scores reduced the number of imputed SDQ values by 41.3%. Prorated SDQ scores were imputed for 17.2% (n=1,128) of the final sample.
ASD diagnosis
Williams and colleagues (2008) gathered comprehensive PDD diagnostic data from both National Health Service and educational sources. In linking those diagnoses with the ALSPAC sample, they found that 86 children had a documented diagnosis of an autism spectrum disorder either in their medical or educational records 22. This translates to an estimated PDD prevalence of 1 in 200 within the ALSPAC cohort. While more than half of the children with a diagnosis of ASD (n=60) had a measured SCDC value for at least one time point, loss to follow-up was greatest for the ASD cases. Of the 60 individuals with an ASD and a measured SCDC score at one or more time points, 55 had a measured score at age 7, 45 had a measured score at age 10, and 31 had a measured score at age 13. Phenotypic trajectories were not estimated for the ASD group given the small sample size and substantial loss to follow-up. ASD group means are not presented for the WISC and SDQ measures as the substantial proportion of missing data (WISC: 65%; SDQ: 18%) would likely yield invalid estimates.
Data Analysis
The analyses in this paper are designed to estimate trends in the progression of autism-like behaviors in the general population between ages 7 and 13. Of particular interest is the phenotypic development of ‘high scoring individuals,’ who were identified using two methodologies. The first criterion was the time-invariant, ROC-maximizing value of 8. Individuals who scored 8 or above at any of the three time points were labeled high scorers using the ‘greater than 8’ (G8) criterion. The second method was time-variant and employed covariate-specific percentile cutoffs. The predictive value of sex and IQ in autistic trait variability has already been established in this population 23. Male sex and low IQ are both associated with higher mean scores on the SCDC. The full sample was therefore categorized into sex and IQ groups (low= IQ<85; average= 85≤IQ≤115; high= IQ>115). The 90th and 95th percentile cutoffs were estimated for each of the six categories (3 male IQ groups + 3 female IQ groups) at each of the three time points. Individuals scoring above the 90th or 95th percentile in their relevant sex and IQ stratum at any of the three time points were included as high scorers. An alternative to both of these methodologies would be to define high scorers based only on age 7 (baseline) SCDC values. There are two major flaws to this approach. First, it would exclude all children without a measured SCDC value at time one (11.03% of the total sample). Second, estimates of change are often biased when conditioned on baseline quantitative scores 24. Employing multiple time points to establish high scoring groups reduces the likelihood with which regression to the mean may influence estimated parameter values.
In sum, this approach yields 5 analytic groups: 1) the complete analytic sample (n=6,539), 2) the G8 high scorers (n=871), 3) those above the 90th percentile (n=1,372), 4) those above the 95th percentile (n=687), and 5) the ASD group (n=60). For the high scoring groups, two types of phenotypic trajectories were estimated. First, change was modeled with IQ and sex as the primary covariates of interest. Second, change was modeled with behavior problems and sex as the primary covariates of interest. All models controlled for child ethnicity and maternal education. Marginal longitudinal models were estimated to account for within-individual response clustering. SCDC scores were distributed normally in the high scoring groups. To be consistent across analysis sets, models assuming normal error distribution were employed in all trajectory estimates. Though the distribution of the SCDC in the full sample was skewed, differences between the empirical and model-based standard errors were statistically minimal (differences indicate poor model fit) and clinically meaningless. The ASD models did not consider IQ or functional status given the small group size and low response rate for those measures. Mean change in the ASD group was evaluated using paired t-tests.
Missing predictor and outcome values were estimated through multiple imputation in IVEWARE. The final trajectories were estimated in SAS version 9.2 by combining the projections of each of five imputed data sets. The trajectories employing imputed data (n=6,539) were not substantively different than those estimated using only complete cases (n=4,329). Criteria for statistical significance were adjusted in the high scoring models to account for multiple testing.
Results
Table 1 presents the distribution of SCDC scores in the population at 7, 10, and 13 years. Within the full sample, the mean score at each of those time points was 2.7 (sd=3.8), 2.3 (3.7), and 2.5 (3.6) respectively. All means were significantly different from those of the other two time points (p<0.001 for all comparisons). The average IQ and behavioral problems (SDQ) scores in the full sample were 104.8 and 6.6 (sd=4.6) respectively. High scoring groups, defined above, were established through SCDC scoring criteria. The most restrictive group was the >95% category (n=687), whose mean SCDC values were 8.7 (sd=5.3), 8.4 (5.4), and 8.8 (5.4) at each of the three time points. SDQ scores were greater on average within the high scoring groups. Mean SDQ values were 10.3 (sd=5.59), 11.7 (5.84), and 11.8 (5.9) in the >90%, G8, and >95% groups respectively. As the >90% and >95% groups were age- and IQ-normed, mean IQ was lower in the G8 group only (mean=99.9). The G8 group also contained a significantly higher percentage of males (58.8%; χ2=26.3, p<0.001) than the full sample.
Table 1.
Descriptive Statistics
| Group | N | % Male | Mean WISC (SE) | Mean SDQ (SE) | Mean 7 year SCDC (SE) | Mean 10 year SCDC (SE) | Mean 13 year SCDC (SE) |
|---|---|---|---|---|---|---|---|
| Full Sample | 6539 | 49.93 | 104.82 (0.20) | 6.61 (0.06) | 2.70 (0.05) | 2.26 (0.05) | 2.47 (0.05) |
| >90% Scorers | 1372 | 45.7 | 104.14 (0.46) | 10.34 (0.16) | 6.89 (0.13) | 6.38 (0.14) | 6.82 (0.14) |
| >8 Scorers | 971 | 58.81 | 99.92 (0.59) | 11.74 (0.20) | 8.29 (0.16) | 7.66 (0.17) | 8.06 (0.18) |
| >95% Scorers | 687 | 48.47 | 104.59 (0.65) | 11.83 (0.24) | 8.72 (0.21) | 8.39 (0.22) | 8.78 (0.23) |
| ASD cases | 60 | 85.00 | - | - | 14.85 (0.92) | 14.93 (0.98) | 11.90 a (1.13) |
Note: ASD= autism spectrum disorder; SCDC= Social and Communication Disorders Checklist; SDQ= Strengths and Difficulties Questionnaire; SE = standard error; WISC = Weschler Intelligence Scale for Children.
In ASD group: N (age 13) = 31.
The children with an ASD diagnosis had significantly greater mean SCDC values than individuals in each of the general population high scoring groups at every time point. Their average scores were 14.9 (sd=6.8), 14.9 (6.6), and 11.9 (6.3) at 7, 10, and 13 years respectively. The ASD group also displayed the greatest preponderance of males (85.0%; χ2=27.9, p<0.001). There was no mean change between 7 and 10 years in the ASD group. The ASD idividuals' 13-year values, however, were on average 1.38 points lower than their paired 10-year SCDC scores (t=2.1, df=28, p=0.05). That comparison was based on the 29 individuals with ASD who had a measured score at the 10- and 13-year time points. This finding should be noted cautiously given the fraction of ASD participants with a measured score at both time points (one half) and the common relationship between case severity and drop out.
Figure 1 presents the sex and IQ distributions of the G8 and >95% high scoring groups. Using the time-invariant, covariate-independent G8 criterion, individuals with measured IQs under 85 constituted more than 20% (21.1) of the total group. Females with measured IQs more than one standard deviation above the mean made up only 7.8% of the G8 group. Group constitution was significantly different using the time-variant, covariate-dependent percentile criteria. Females in the high IQ group were more than twice as represented (16.5%). Children with IQs under 85 represented a significantly smaller proportion (9.6%, χ2=38.11, p<0.001) of the total population. The differences between the G8 and >95% groups in gender representation at the IQ extremes is noted by bolded data labels in the table. Despite these differences in group constitution, the predicted trajectories were very similar as discussed below.
Figure 1. Sex and IQ Distribution in High Scoring Groups.
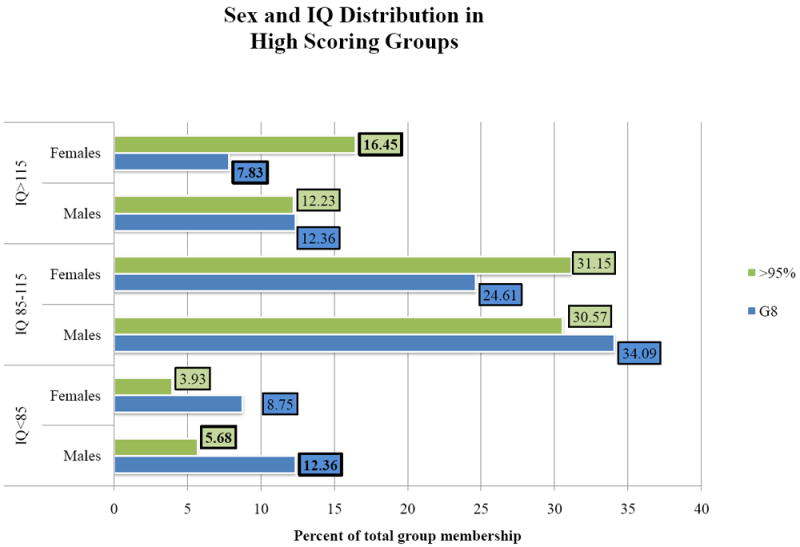
Note: Numeric labels (boxed values) denote the percentage of individuals in each high-scoring group that fall within a particular sex and IQ category. For example, the 16.45 label indicates that 16.45% of subjects in the >95% group are females with a measured IQ score above 115.
Table 2 presents the coefficient estimates of the phenotypic growth models, controlling for IQ. SCDC scores showed little variability between ages seven and thirteen in either the full sample or any of the high scoring groups. In the full sample, SCDC scores were predicted to decline 0.28 points for girls (p<0.001) and 0.44 points for boys between 7 years and 10 years (p<0.001). By 13 years, girls’ average scores returned to their original value at baseline (p=0.43). Boys’ scores increased between 10 and 13 years but were still on average slightly lower (0.31 points) than their baseline scores (p<0.001). This projected a) decrease between ages 7 and 10 and b) increase between ages 10 and 13 was highly statistically significant on account of the large sample size, but substantively quite small for both genders. In spite of the minimal variation between time points, an identical pattern was seen in each of the high scoring groups. The decrease between 7 and 10 years was statistically significant in the G8 (-0.50, p=0.01) and >90% (-0.43, p=0.002) models. In all three high scoring groups, SCDC scores at 13 years were not significantly different than their baseline values and there were no significant interactions between time and the covariates.
Table 2.
Coefficient Estimates of Linear Growth Models for Autistic Traits in the General Population
| Full Sample β (p)
|
High Scoring Groups β (p)
|
|||
|---|---|---|---|---|
| G8 | >90% | >95% | ||
| Intercept | 5.36 (<0.001) | 10.42 (<0.001) | 11.83 (<0.001) | 13.74 (<0.001) |
| 10 years | -0.28 (<0.001) | -0.50 (0.01) | -0.43 (0.002) | -0.21 (0.46) |
| 13 years | 0.05 (0.43) | 0.03 (0.88) | 0.04 (0.80) | 0.28 (0.36) |
| Sex (male=1) | 0.77 (<0.001) | 1.23 (<0.001) | 2.14 (<0.001) | 2.48 (<0.001) |
| IQ | -0.03 (<0.001) | -0.03 (<0.001) | -0.05 (<0.001) | -0.06 (<0.001) |
| Ethnicity | -0.10 (0.59) | -0.20 (0.70) | -0.55 (0.20) | 0.12 (0.85) |
| Maternal Education | -0.02 (0.48) | -0.01 (0.92) | 0.12 (0.27) | -0.15 (0.19) |
| 10 years * Sex | -0.16 (0.04) | |||
| 13 years * Sex | -0.36 (<0.001) | |||
As anticipated, both the full sample and the high scoring groups displayed an inverse relationship between IQ and SCDC score (p<0.001 for all comparisons). Female sex was similarly protective, though the effect was stronger in the high scoring groups. Controlling for IQ, female mean scores were 1.23 points lower than male means in the G8 group (p<0.001). These protective effects were consistent across time points. The predicted trajectories for the full sample and G8 high scoring group, derived from the IQ models, are presented in figure 2.
Figure 2. Phenotypic Progression of Autistic Traits in the General Population.
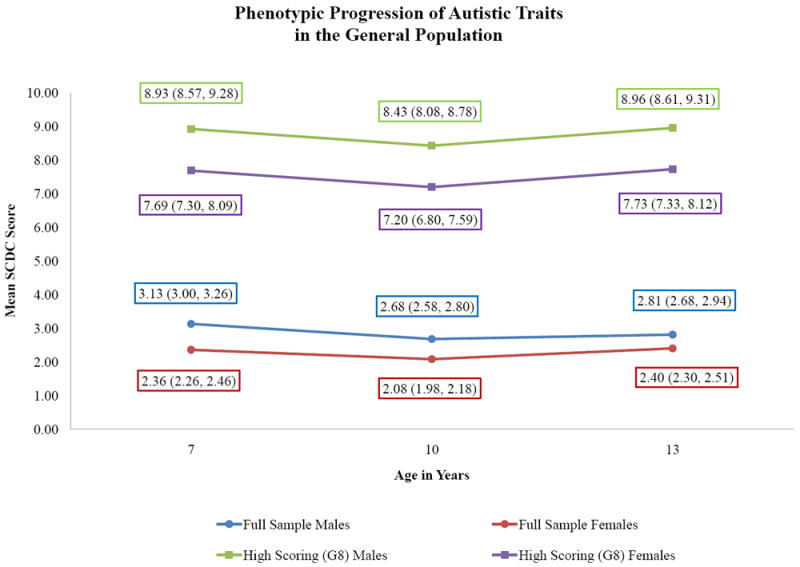
Note: Data labels indicate the predicted group mean and 95% confidence interval at each time point.
Table 3 presents the coefficient estimates of the high scoring group growth models, controlling for behavioral difficulties. As with the IQ models, each of the high scoring groups decreased in mean SCDC score between 7 and 10 years, though the change was not significant in the most restrictive category (>95%). Higher scores on the SDQ predicted higher scores on the SCDC in each group at all measurement points (p<0.001 for all comparisons), though that relationship varied over time. There was a significant interaction between behavior problems and change in SCDC scores from ages 7 to 13 in each of the groups. The interaction resulted in a small, positive predicted change in SCDC scores between ages 7 and 13 for individuals with minimal behavioral problems but small, negative predicted change for individuals with high parent-rated behavioral problems scores. In effect, this interaction eliminates the u-shaped trend for participants with SDQ scores of 12 or above. As SDQ scores increase above that point, the overall trend becomes increasingly linear and negative.
Table 3.
The Relationship Between Change and Behavioral Difficulties in High Scoring Groups
| Group Definition | G8 β (p) | >90% β (p) | >95% β (p) |
|---|---|---|---|
| Intercept | 4.26 (<0.001) | 4.14 (<0.001) | 4.15 (<0.001) |
| 10 years | -1.19 (0.01) | -0.95 (0.003) | -0.73 (0.22) |
| 13 years | 1.59 (0.01) | 1.10 (0.002) | 2.29 (0.001) |
| Sex (male=1) | 0.66 (0.12) | 0.69 (0.03) | 1.79 (0.001) |
| Behavioral Difficulties | 0.30 (<0.001) | 0.27 (<0.001) | 0.34 (<0.001) |
| Ethnicity | -0.06 (0.90) | -0.36 (0.40) | -0.14 (0.82) |
| Maternal Education | 0.04 (0.61) | -0.13 (0.06) | -0.15 (0.17) |
| Behavioral Difficulties* Sex | 0.01 (0.71) | 0.07 (0.01) | 0.01 (0.90) |
| Behavioral Difficulties* 10 years | 0.06 (0.11) | 0.05 (0.09) | 0.04 (0.33) |
| Behavioral Difficulties* 13 years | -0.13 (0.004) | -0.10 (0.002) | -0.17 (0.002) |
Discussion
This study indicates that parent-rated autistic traits, as assessed by the Social and Communication Disorders Checklist, are stable in the general population between 7 and 13 years of age. In the high scoring groups there was a small but significant pattern over time in which SCDC scores improved slightly between ages 7 and 10 but returned to baseline values by age 13 years. In the full sample, female scores did not change overall between 7 and 13 years. Male scores decreased very slightly, but significantly, on the order of 0.1 standard deviations. Throughout that period, females scored lower on the measure than males. IQ was consistently protective against social and communication impairment but did not predict differential improvement in change. Overall behavioral problems, assessed by the Strengths and Difficulties Questionnaire, were positively correlated with SCDC scores and had a small, significant relationship with phenotypic trajectories. The u-shaped trend was less apparent among individuals with higher scores on the SDQ.
The evidence for stability in general population autistic traits over time is consistent with developmental expectations for individuals with an ASD. Diagnostic retention studies suggest that most individuals with ASD retain the high burden of social and communication impairment relative to the population average, though some improvement in behavioral characteristics is common 7, 11-12. In this study, individuals scoring in the top 5 and 10 percent of the population distribution, as well as the cohort as a whole, similarly showed limited variability across the 6 year follow-up period. The findings of this study are accordingly consistent with the theory that a phenomenological continuum exists across the clinical threshold.
The minor improvement in parent-rated scores at age 10, seen in all analytic groups, is difficult to interpret in light of the stability in the overall trend. It is possible that this change reflects variation in social and communication difficulty but, given the rebound by age 13, is as likely to be tapping age-normative behavioral variation. Especially as assessed in the general population, autistic traits (e.g. “does not respond when told to do something,” question 11 on the SCDC) are likely capturing phenomena not purely driven by social impairment per se.
The findings of this study also suggest that the protective effects of sex and IQ against social and communication impairment are stable over time. IQ was not related to phenotypic change in any group, male sex suggested slightly greater change in the full sample only. Were male preponderance in autism related to a female advantage in learning or adaptive mechanisms, one would expect female scores to improve more than male scores, particularly among those at the extremes of the population distribution. Contrary to that, this study suggests that the female protective effect is stable, even after controlling for variation in the IQ distribution between sexes.
Total parent-rated behavioral difficulty was the only covariate related to change in the high scoring groups. Individuals with SDQ scores in the top 15% of the population distribution, indicating the greatest number of emotional and behavioral issues, were predicted to improve over the course of the study period. This finding is difficult to interpret in the context of the current study. Individuals whose autistic traits scores are influenced by substantial behavioral comorbidities may change more over time if the emotional/behavioral problems construct is less stable. However, the temporal relationship between overall behavior problems and autistic traits should be explored in detail in future studies.
The analysis was limited by the narrow response range and domain restrictions of the SCDC, a measure that exclusively captures social and communication impairment. As the SCDC does not assess restricted and repetitive behaviors, one of the three definitional phenotypic domains of ASD, these questions should be revisited specifically within that domain. Further, the small number of items and subsequently limited response range may have obscured finer patterns of phenotypic development often noted in clinical populations 11. Covariate influence on change in autistic traits should be reconsidered using a broader measure with greater potential to consider specific phenotypic domains (e.g. change in social impairment versus restricted/repetitive behaviors and interests). Future studies should also extend these analyses to children of other ages. ASD-related behaviors may be more pliable in younger children 3. Questions regarding the predictors of phenotypic improvement may be better suited for analysis over a different time period. Lastly, though the goal was general population consideration, this study was limited by the relatively small number of children with an ASD diagnosis, particularly the small number of females (n=9). Consideration of sex and IQ differences in phenotypic development should be further pursued within a larger clinical sample.
This study introduces the first large, general population analysis of autistic trait development. The primary finding, trait stability over time, suggests a consistency between phenotypic development as it is seen in the general population and among individuals who meet clinical criteria for ASD. Further, this study presents evidence that the mean difference in quantitative trait scores between females and males is stable over time. This suggests that genetic and environmental risks for male preponderance in ASD may be less likely to involve variation in social learning, and should be investigated in future studies.
Acknowledgments
The UK Medical Research Council (74882), the Wellcome Trust (076467) and the University of Bristol provide core support for Avon Longitudinal Study of Parents and Children (ALSPAC). The research was specifically funded by a National Institute of Mental Health / National Institute of Health Research Fellowship in Mental Health and Developmental Disabilities (MH/DD) at The Children’s Hospital Boston, Harvard Medical School (MH71286) and the Training Program in Psychiatric Genetics and Translational Research at the Harvard School of Public Health (T32MH017119).
This publication is the work of the authors and Elise Robinson will serve as guarantors for the content of this paper.
We are extremely grateful to all the families who took part in this study, the midwives for their help in recruiting them, and the whole Avon Longitudinal Study of Parents and Children (ALSPAC) team, which includes interviewers, computer and laboratory technicians, clerical workers, research scientists, volunteers, managers, receptionists and nurses. We are also very thankful for the productive discussions with Alan Emond and Jean Golding of the University of Bristol, David Skuse of University College London, and Alon Geva of Children’s Hospital Boston and Harvard Medical School that contributed to this work.
Footnotes
Disclosure: Drs. Robinson, Munir, Munafò, Hughes, McCormick, and Koenen report no biomedical financial interests or potential conflicts of interest.
Publisher's Disclaimer: This is a PDF file of an unedited manuscript that has been accepted for publication. As a service to our customers we are providing this early version of the manuscript. The manuscript will undergo copyediting, typesetting, and review of the resulting proof before it is published in its final citable form. Please note that during the production process errors may be discovered which could affect the content, and all legal disclaimers that apply to the journal pertain.
References
- 1.Constantino JN, Todd RD. Autistic traits in the general population: a twin study. Arch Gen Psychiatry. 2003 May;60(5):524–530. doi: 10.1001/archpsyc.60.5.524. [DOI] [PubMed] [Google Scholar]
- 2.Ronald A, Happe F, Bolton P, et al. Genetic heterogeneity between the three components of the autism spectrum: a twin study. J Am Acad Child Adolesc Psychiatry. 2006 Jun;45(6):691–699. doi: 10.1097/01.chi.0000215325.13058.9d. [DOI] [PubMed] [Google Scholar]
- 3.Eaves LC, Ho HH. Brief report: stability and change in cognitive and behavioral characteristics of autism through childhood. J Autism Dev Disord. 1996 Oct;26(5):557–569. doi: 10.1007/BF02172276. [DOI] [PubMed] [Google Scholar]
- 4.Starr E, Szatmari P, Bryson S, Zwaigenbaum L. Stability and change among high-functioning children with pervasive developmental disorders: a 2-year outcome study. J Autism Dev Disord. 2003 Feb;33(1):15–22. doi: 10.1023/a:1022222202970. [DOI] [PubMed] [Google Scholar]
- 5.Lord C, Risi S, DiLavore PS, Shulman C, Thurm A, Pickles A. Autism from 2 to 9 years of age. Arch Gen Psychiatry. 2006 Jun;63(6):694–701. doi: 10.1001/archpsyc.63.6.694. [DOI] [PubMed] [Google Scholar]
- 6.Szatmari P, Bryson SE, Streiner DL, Wilson F, Archer L, Ryerse C. Two-year outcome of preschool children with autism or Asperger’s syndrome. Am J Psychiatry. 2000 Dec;157(12):1980–1987. doi: 10.1176/appi.ajp.157.12.1980. [DOI] [PubMed] [Google Scholar]
- 7.Shattuck PT, Seltzer MM, Greenberg JS, et al. Change in autism symptoms and maladaptive behaviors in adolescents and adults with an autism spectrum disorder. J Autism Dev Disord. 2007 Oct;37(9):1735–1747. doi: 10.1007/s10803-006-0307-7. [DOI] [PMC free article] [PubMed] [Google Scholar]
- 8.Anderson DK, Lord C, Risi S, et al. Patterns of growth in verbal abilities among children with autism spectrum disorder. J Consult Clin Psychol. 2007 Aug;75(4):594–604. doi: 10.1037/0022-006X.75.4.594. [DOI] [PubMed] [Google Scholar]
- 9.Szatmari P, Bryson S, Duku E, et al. Similar developmental trajectories in autism and Asperger syndrome: from early childhood to adolescence. J Child Psychol Psychiatry. 2009 Dec;50(12):1459–1467. doi: 10.1111/j.1469-7610.2009.02123.x. [DOI] [PubMed] [Google Scholar]
- 10.Piven J, Harper J, Palmer P, Arndt S. Course of behavioral change in autism: a retrospective study of high-IQ adolescents and adults. J Am Acad Child Adolesc Psychiatry. 1996 Apr;35(4):523–529. doi: 10.1097/00004583-199604000-00019. [DOI] [PubMed] [Google Scholar]
- 11.Charman T, Taylor E, Drew A, Cockerill H, Brown JA, Baird G. Outcome at 7 years of children diagnosed with autism at age 2: predictive validity of assessments conducted at 2 and 3 years of age and pattern of symptom change over time. J Child Psychol Psychiatry. 2005 May;46(5):500–513. doi: 10.1111/j.1469-7610.2004.00377.x. [DOI] [PubMed] [Google Scholar]
- 12.McGovern CW, Sigman M. Continuity and change from early childhood to adolescence in autism. J Child Psychol Psychiatry. 2005 Apr;46(4):401–408. doi: 10.1111/j.1469-7610.2004.00361.x. [DOI] [PubMed] [Google Scholar]
- 13.Constantino JN, Abbacchi AM, Lavesser PD, et al. Developmental course of autistic social impairment in males. Dev Psychopathol. 2009 Winter;21(1):127–138. doi: 10.1017/S095457940900008X. [DOI] [PMC free article] [PubMed] [Google Scholar]
- 14.Hoekstra RA, Happe F, Baron-Cohen S, Ronald A. Limited genetic covariance between autistic traits and intelligence: findings from a longitudinal twin study. Am J Med Genet B Neuropsychiatr Genet. Jul;153B(5):994–1007. doi: 10.1002/ajmg.b.31066. [DOI] [PubMed] [Google Scholar]
- 15.Lord C, Schopler E. Differences in sex ratios in autism as a function of measured intelligence. J Autism Dev Disord. 1985 Jun;15(2):185–193. doi: 10.1007/BF01531604. [DOI] [PubMed] [Google Scholar]
- 16.Nordin V, Gillberg C. Autism spectrum disorders in children with physical or mental disability or both. I: Clinical and epidemiological aspects. Dev Med Child Neurol. 1996 Apr;38(4):297–313. doi: 10.1111/j.1469-8749.1996.tb12096.x. [DOI] [PubMed] [Google Scholar]
- 17.Fombonne E. Epidemiological surveys of autism and other pervasive developmental disorders: an update. J Autism Dev Disord. 2003 Aug;33(4):365–382. doi: 10.1023/a:1025054610557. [DOI] [PubMed] [Google Scholar]
- 18.Skuse DH, Mandy WP, Scourfield J. Measuring autistic traits: heritability, reliability and validity of the Social and Communication Disorders Checklist. Br J Psychiatry. 2005 Dec;187:568–572. doi: 10.1192/bjp.187.6.568. [DOI] [PubMed] [Google Scholar]
- 19.Golding J, Pembrey M, Jones R. ALSPAC--the Avon Longitudinal Study of Parents and Children. I Study methodology. Paediatr Perinat Epidemiol. 2001 Jan;15(1):74–87. doi: 10.1046/j.1365-3016.2001.00325.x. [DOI] [PubMed] [Google Scholar]
- 20.Weschler D, Golombok J, Rust S. Manual for the Weschler Intelligence Scale for Children. 3. Sidcup, UK: Psychological Corporation; 1992. [Google Scholar]
- 21.Goodman R, Ford T, Simmons H, Gatward R, Meltzer H. Using the Strengths and Difficulties Questionnaire (SDQ) to screen for child psychiatric disorders in a community sample. Int Rev Psychiatry. 2003 Feb-May;15(1-2):166–172. doi: 10.1080/0954026021000046128. [DOI] [PubMed] [Google Scholar]
- 22.Williams E, Thomas K, Sidebotham H, Emond A. Prevalence and characteristics of autistic spectrum disorders in the ALSPAC cohort. Dev Med Child Neurol. 2008 Sep;50(9):672–677. doi: 10.1111/j.1469-8749.2008.03042.x. [DOI] [PubMed] [Google Scholar]
- 23.Skuse DH, Mandy W, Steer C, et al. Social communication competence and functional adaptation in a general population of children: preliminary evidence for sex-by-verbal IQ differential risk. J Am Acad Child Adolesc Psychiatry. 2009 Feb;48(2):128–137. doi: 10.1097/CHI.0b013e31819176b8. [DOI] [PubMed] [Google Scholar]
- 24.Glymour MM, Weuve J, Berkman LF, Kawachi I, Robins JM. When is baseline adjustment useful in analyses of change? An example with education and cognitive change. Am J Epidemiol. 2005 Aug 1;162(3):267–278. doi: 10.1093/aje/kwi187. [DOI] [PubMed] [Google Scholar]