

Abstract
Background
As 2nd-line antiretroviral therapy (ART) availability increases in resource-limited settings, questions about the value of laboratory monitoring remain. We assessed the outcomes and cost-effectiveness (CE) of laboratory monitoring to guide switching ART.
Methods
We used a computer model to project life expectancy and costs of different strategies to guide ART switching in patients in Côte d'Ivoire. Strategies included clinical assessment, CD4 count, and HIV RNA testing. Data were from clinical trials and cohort studies from Côte d'Ivoire and the literature. Outcomes were compared using the incremental CE ratio. We conducted multiple sensitivity analyses to assess uncertainty in model parameters.
Results
Compared with 1st-line ART only, 2nd-line ART increased life expectancy by 24% with clinical monitoring only, 46% with CD4 monitoring, and 61% with HIV RNA monitoring. The incremental CE ratio of switching based on clinical monitoring was $1,670/year of life gained (YLS) compared to 1st-line ART only; biannual CD4 monitoring was $2,120/YLS. The CE ratio of biannual HIV RNA testing ranged from $2,920 ($87/test) to $1,990/YLS ($25/test). If 2nd-line ART costs were reduced, the CE of HIV RNA monitoring improved.
Conclusions
In resource-limited settings, CD4 count and HIV RNA monitoring to guide switching to 2nd-line ART improve survival and under most conditions are cost-effective.
Keywords: Laboratory monitoring, diagnostic tests, HIV RNA, viral load, HIV/AIDS, antiretroviral therapy
The past decade has seen unprecedented increases in access to and delivery of HIV treatment and care. Affordable and effective 1st-line antiretroviral regimens are now widely available and an estimated 3 million people have started antiretroviral therapy (ART) in resource-limited settings.1 For those who need it, 2nd-line ART is becoming increasingly affordable and accessible.1, 2
While access to and delivery of HIV treatment have improved, resource constraints have curbed use of laboratory-based diagnostic tests in many developing countries and led to shifting attitudes towards what should be recommended in terms of patient monitoring. In 2006, the World Health Organization's (WHO's) public health response to HIV led to guidelines emphasizing a tiered patient monitoring structure, with CD4 count at the district level and CD4 count and HIV RNA quantification at the regional level, but with neither considered compulsory for patient management.3, 4 In 2008, based on results from a study by Phillips et al. suggesting only modest clinical benefit from CD4 count or HIV RNA monitoring to guide switching to 2nd-line ART, WHO emphasized the use of clinical monitoring.5, 6 While HIV RNA testing has been available in only limited settings, the decreasing costs and simplification of CD4 count technologies have allowed scale-up of immunologic monitoring in many developing countries.6 This led the WHO to reaffirm the importance of CD4 counts and to recommend in 2009 that clinical failure should be confirmed at least by immunological criteria when HIV RNA is not available.7
In keeping with this recent recommendation, most current national guidelines consider CD4 counts along with clinical criteria as the standard of care for monitoring patients receiving antiretroviral therapy, while virologic monitoring in these settings is still generally considered optional.8-15 In the context of a country like Côte d'Ivoire, a low-income West African country with adult HIV prevalence of approximately 3.9%,17, 18 our objective was to examine the clinical benefits, costs, and cost-effectiveness of CD4 count and/or HIV RNA monitoring in guiding switching to 2nd-line ART.
Methods
Analytic Overview
We utilized a previously published simulation model of the natural history and treatment of chronic HIV disease.19-21 Clinical and cost data were derived from clinical trials and cohort studies conducted in Côte d'Ivoire, as well as publicly available fee schedules and cost databases.2, 22-25 Monitoring strategies to guide switching to 2nd-line ART were based on different criteria for detecting 1st-line antiretroviral failure (clinical, immunologic, or virologic). The performance of alternative strategies was evaluated using the incremental cost-effectiveness ratio, expressed as 2006 US dollars per year of life gained, and defined as the additional cost of a specific strategy, divided by its additional clinical benefit, compared with the next less expensive strategy.26 We adopted a modified societal perspective (meaning that patient time and transportation costs were not included), with future benefits and costs discounted 3% annually.26-29 Sensitivity analyses were conducted to evaluate the impact of uncertain parameters and assumptions on the results. Additional information on the methods is available in the Appendix and in previous publications.19-21, 30-32
Strategies
To quantify the benefit from the availability of 2nd-line therapy, we included two relevant comparators among the base case strategies: cotrimoxazole prophylaxis only and 1st-line ART only plus cotrimoxazole prophylaxis. In the base case, we evaluated three main monitoring approaches to diagnose 1st-line ART failure, thereby prompting a switch to 2nd-line ART. These included: (1) clinical monitoring, with failure defined as a single WHO stage III-IV event other than tuberculosis (TB) and invasive bacterial diseases; (2) immunologic monitoring, with failure defined as a 50% decrease from peak regimen-specific CD4 count (consistent with WHO recommendations); and (3) virologic monitoring, with failure defined as a 1-log10 increase in HIV RNA and/or return to pre-treatment HIV RNA level (Table 1).
Table 1. Selected Monitoring Strategies to Guide Switching to Second-Line ART.
| Strategy* | Test Modality | Criteria for 1st-line ART Failure |
|---|---|---|
| Clinical Monitoring (Stage III-IV)† | Clinical | WHO stage III-IV event |
|
| ||
| Stage III-IV or TB | Clinical | WHO stage III-IV event or TB |
| Stage III-IV or TB or Bacterial | Clinical | WHO stage III-IV event or TB or invasive bacterial diseases |
|
| ||
| Immunologic Monitoring (50%↓CD4) | CD4 | 50% ↓ in peak CD4 |
|
| ||
| 25% ↓ in peak CD4 | CD4 | 25% ↓ in peak CD4 |
| Stage III-IV/CD4 | Clinical/CD4 | WHO stage III-IV event or 50% ↓ in peak CD4 |
|
| ||
| Virologic Monitoring (1-log ↑/pre-tx) | HIV RNA | 1-log10 ↑ or return to pre-treatment HIV RNA |
|
| ||
| Delayed switch to 2nd-line (6 months) | HIV RNA | WHO stage III-IV or 1-log10 ↑ or return to pre-treatment HIV RNA |
| Stage III-IV/HIV RNA | Clinical/HIV RNA | WHO stage III-IV or 1-log10 ↑ or return to pre-treatment HIV RNA |
Abbreviations: ART = antiretroviral therapy; WHO = World Health Organization; and TB = tuberculosis.
Shaded rows indicate the 3 general base case strategies. Selected strategies evaluated in secondary analyses are shown without shading. A complete set of strategies is available in the Appendix (Appendix Table A1).
Detailed definitions of WHO stage III–IV events are provided in the Appendix.
In a secondary analysis, we assessed variations of the three main monitoring strategies, including: (1) alternative clinical criteria for 1st-line failure (e.g., WHO stage III-IV event, including TB and/or invasive bacterial diseases); (2) alternative immunologic criteria for 1st line failure (e.g., 25% decrease in CD4 count); (3) combined clinical and immunologic/virologic monitoring (e.g., WHO stage III-IV event or a 1-log10 increase in HIV RNA and/or return to pre-treatment HIV RNA level); and (4) a 6-month delay in initiation of 2nd-line ART following observation of virologic failure.
Model
We employed the Cost-Effectiveness of Preventing AIDS Complications (CEPAC) International model, an individual-level Monte Carlo simulation model of HIV disease progression and treatment.19-21, 30-32 Drawing from an initial distribution of country-specific demographic (age, sex) and clinical characteristics (CD4 count, HIV RNA level, history of opportunistic infection), the model draws upon monthly transition probabilities to simulate a cohort of individual patients whose clinical course is tracked from model entry until death. The model projects intermediate outcomes (e.g., longitudinal CD4 count, number and type of opportunistic infection) and long-term aggregate outcomes (e.g., life expectancy and lifetime costs).
Disease Progression in the Absence of Antiretroviral Therapy
HIV disease progression is modeled as a function of HIV RNA level and CD4 count 33. In the model, virologic and immunologic status are represented using six HIV RNA strata and six CD4 count strata.19, 20 Progression in the absence of therapy is based on a patient's true HIV RNA level, which determines the rate of CD4 count decline and in turn, the risk of specific opportunistic infections and death.33, 34 The model tracks this information throughout an individual's lifetime and distinguishes between underlying disease progression and observed measures of clinical, immunologic, and virologic status. Opportunistic infection rates are based on primary data from Côte d'Ivoire and are classified broadly as HIV-related severe events (severe malaria, TB, invasive bacterial diseases, and other WHO stage III-IV events), mild events (non-invasive bacterial diseases and WHO stage II events), and unexplained severe events (acute unexplained fever or acute unexplained diarrhea with hospitalization).19, 20 Cotrimoxazole prophylaxis—administered to all patients upon entry into care—results in a reduced risk of bacterial infections, malaria, other WHO stage III-IV events (toxoplasmosis, isosporosis, pneumocystosis, and nocardiosis), and unexplained severe events.20, 22, 35
Disease Progression in the Presence of Antiretroviral Therapy
Simulated patients can either achieve HIV RNA suppression or not on a particular ART regimen. For patients who achieve HIV RNA suppression, disease progression is modeled based on decreases in HIV RNA level and increases in CD4 count. Virologically suppressed patients face a monthly risk of “late” failure, defined as a 0.5-log10 increase in HIV RNA over at least 2 consecutive months.33 Late virologic failure is followed by a 12-month delay before CD4 count decline 36. Patients who either do not achieve HIV RNA suppression or who experience late virologic failure have CD4 declines similar to those not receiving ART. Regardless of an individual's virologic status, patients receiving ART experience an independent reduction in incidence of opportunistic infections and AIDS-related mortality.37, 38
Patients experiencing undetected virologic failure and who continue on ART accumulate resistance.39 Rather than model the accumulation of individual resistance mutations, we modeled the effects of incremental resistance accumulation on the efficacy of subsequent ART regimens. This was accomplished by specifying a relative percent decrease in the baseline 24-week virologic suppression of subsequent ART regimens for each month that a patient remains on a virologically failed regimen.40-42 This relative percent decrease is hereafter referred to as the resistance penalty.
We specify the resistance penalty in Equation 1, below:
| (1) |
In this equation, “pnetSuccess” represents the efficacy of current ART regimen i after virologic failure due to accumulated resistance from prior regimens; “pSuccessi” represents the efficacy of ART regimen i after virologic failure in the absence of resistance from prior ART regimens; “respensuccessi” represents the fractional reduction in the initial probability of success of regimen i, per month spent on prior regimens; “cumVLtime” represents the cumulative number of months spent, across all ART regimens, after having virologically failed ART; and i represents the current ART regimen i, in which i is an integer value beginning with 1 and continuing toward the maximum number of sequential lines of ART available.
We assume that the resistance penalty does not affect CD4 response to subsequent regimens, conditional upon virologic response. We also assume that the penalty applies only to the initial 24-week efficacy of a subsequent regimen and not to an individual's probability of virologic failure at later time points. Derivation of the baseline value for the resistance penalty is shown in the Data section.
Patient-Level Monitoring of Clinical, Immunologic, and Virologic Status
Patient-level HIV disease progression and treatment efficacy are monitored through clinical, immunologic (via CD4 counts), and/or virologic (via HIV RNA tests) assessments. Clinical assessments occur upon entry into care, presentation with any acute event, and at 3-month intervals. CD4 and HIV RNA tests, if available, occur upon entry into care and at 6-month intervals thereafter.4 Treatment-related decisions (i.e., starting, switching, or stopping ART regimens) are made based on information from clinical assessments and, if available, CD4 counts and/or HIV RNA tests.
Clinical and Cost Data
Cohort Characteristics and Natural History
Data were derived mainly from trials and cohort studies conducted in Côte d'Ivoire by the Programme PAC-CI. Initial distributions of age, sex, and CD4 count were derived from the ACONDA cohort, an observational cohort of HIV-infected adults and a continuation of the ANRS 1203 Cotrame cohort study in Abidjan, Côte d'Ivoire (Table 2).43, 44 Incidence of opportunistic infections (a function of CD4 count), HIV-related mortality (a function of both CD4 count and history of opportunistic infection), and efficacy and toxicity of cotrimoxazole prophylaxis were estimated from ANRS 059 trial data, as well as data from the ANRS 1203 and 1220 study cohorts.23, 24, 45 Risk of non-HIV–related mortality was derived from country-specific life tables for Côte d'Ivoire.46
Table 2. Selected Model Variables.
| Variable | Base Case Value | Reference(s) |
|---|---|---|
| Initial cohort characteristics | ||
| Mean age (SD) (yrs) | 36.9 (9.2) | Toure et al.44 |
| Gender distribution | 70% female | Toure et al.44 |
| Mean CD4 count (SD) (cells/μL) | 140 (116) | Toure et al.44 |
| Median HIV RNA (IQR) (log10 copies/mL) | 5.3 (4.8–5.8) | Seyler et al.43 |
| Antiretroviral efficacy, drug toxicity, and resistance penalty | ||
| 1st- and 2nd-line antiretroviral therapy* | Toure et al.,44 Delfraissy et al.47 |
|
| HIV RNA suppression at 24 weeks | 80.4% (1st-line); 77.0% (2nd-line) (range: 64%–88%) |
|
| CD4 count increase at 24 weeks (cells/μL)† | +127 (1st-line); +143 (2nd-line) |
|
| Toxicity (per 100 person-years) | Anglaret et al.,22 Seyler et al.24 |
|
| Minor toxic events‡ | 29.3 | |
| Major toxic events | 10.8 | |
| Resistance penalty (monthly relative decrease)§ | -0.45% in 2nd-line HIV RNA suppression at 24 weeks per month on virologically failed 1st-line ART (range: 0.00%–1.63%) | Delfraissy et al.,47 Johnson et al.,49 Marconi et al.50 |
| Costs (2006 US$)¶ | ||
| Clinic visits and laboratory tests | ||
| Clinic visit (per visit) | 3.05 | Yazdanpanah et al.,20 WHO-CHOICE25 |
| CD4 count (per test) | 25.00 | Médecins sans Frontières51 |
| HIV RNA (per test) | 87.00 | Médecins sans Frontières51 |
| Laboratory tests at antiretroviral therapy initiation | 14.35 | Yazdanpanah et al.20 |
| Opportunistic infection prophylaxis (annual) | ||
| Cotrimoxazole | 2.69 | Yazdanpanah et al.20 |
| Antiretroviral therapy (annual) | Médecins sans Frontières,2 Yazdanpanah et al.20 |
|
| 1st-line ART (NNRTI-based) | 121.00 | |
| 2nd-line ART (PI-based) | 749.00 | |
| Minor drug toxicity (per event) | 2.33 | |
| Major drug toxicity (per event) | 23.27 | |
| Routine care costs (monthly) | Yazdanpanah et al.20 | |
| CD4 count ≥200 cells/μL | 29.69 | |
| CD4 count <200 cells/μL | 21.69 | |
| Terminal care & mortality | 51.90 | |
Abbreviations: SD = standard deviation; WHO = World Health Organization; NNRTI = non-nucleoside reverse transcriptase inhibitor; PI = protease inhibitor; and IQR = interquartile range.
Note: Unless otherwise indicated, model variables were varied +/-50% to assess the impact of clinically plausible variations in assumptions and parameter values.
First-line ART efficacy data were derived from the ACONDA cohort, in which 52% received an initial ART regimen of stavudine, lamivudine, and nevirapine; 22% received stavudine, lamivudine, and efavirenz; and 20% received zidovudine, lamivudine, and efavirenz (with the remaining 6% receiving other regimens). We assumed a dosing scheduled in accordance with WHO recommendations — 300 mg once daily (zidovudine), 150 mg twice daily (lamivudine), 30 mg twice daily (stavudine), 600 mg once daily (efavirenz), and 200 mg once daily (nevirapine).
For 1st-line ART, CD4 count increases were 76 (standard deviation (SD) 19) cells/μL per month for months 1–2 and 4 (SD 1) cells/μL per month thereafter. For 2nd-line ART, CD4 count increases were 65 (SD 16) cells/μL per month for months 1–2 and 3 (SD 1) cells/μL per month thereafter.
In the absence of data, the ratio of minor to major ART-related toxic events was assumed to be similar to those occurring due to cotrimoxazole prophylaxis, or approximately 2.7 times as many minor as major toxic events 22.
We defined the resistance penalty as the relative percent decrease in 2nd-line 24-week virologic suppression for each month that a patient remained on a virologically failed 1st-line regimen. The resistance penalty is based on PI-based 2nd-line ART efficacy in the absence of resistance (77.0% suppressed at 24 wks) and the presence of resistance (73.3% suppressed at 24 wks), as well as time between 1st-line ART virologic and observed failure (10.8 months, range: 0.3–4.8 yrs). The baseline value of the resistance penalty was varied between 0% and 1.63% in sensitivity analysis.
Cost estimates did not include direct non-medical costs, patient time costs, or the opportunity cost of foregone earnings due to illness. All costs were adjusted to 2006 price levels and converted, when necessary, from local currency to US dollars using official exchange rates. Antiretroviral drug costs were not adjusted for inflation since these costs typically represent negotiated costs governed by patents, political forces, and other externalities.
Antiretroviral Therapy
Effectiveness of non-nucleoside reverse transcriptase inhibitor- (NNRTI-) based 1st-line ART was derived from a prospective cohort study of treatment-naïve patients in Abidjan.44 At 24 weeks, 80.2% of patients experienced HIV RNA suppression to ≤300 copies/mL and a median CD4 count increase of 127 cells/μL (IQR 64, 201).44 We assumed that, in the absence of resistance, the effectiveness of protease inhibitor- (PI-) based 2nd-line ART was similar to that for 1st-line ART (at 24 weeks, 77.0% suppressed to <400 copies/mL and a mean CD4 count increase of 186 cells/μL).47 Incidence of ART-related severe adverse events was 10.8 (95% CI: 5.4–12.0) per 100 person-years;48 these events led to a switch in drug of similar cost, effectiveness, and drug class.
To derive the baseline value for the resistance penalty, we used 3 pieces of information: PI-based ART efficacy in the absence of resistance, PI-based ART efficacy in the presence of resistance (i.e., thymidine analogue mutations resulting from failure of 1st-line nucleoside reverse transcriptase inhibitors), and time spent on virologically failed ART. For PI-based ART efficacy in the absence of resistance, 24-week virologic suppression (<400 copies/mL) was 77.0%.47 In the presence of resistance, 24-week virologic suppression (<400 copies/mL) was 73.3% for patients on a 2nd-line, PI-based regimen.49 For time spent on virologically failed ART, we estimated that mean time spent on a virologically failed 1st-line ART regimen was 10.8 months.50 We assumed that this estimate reflected the difference between higher HIV RNA suppression (i.e., 77.0%) in the absence of resistance and lower HIV RNA suppression (i.e., 73.3%) in the presence of resistance. We substituted these three estimates into Equation 1 to solve for the baseline value for the resistance penalty:
These data resulted in an overall estimate of a 0.45% relative decrease in baseline 24-week HIV RNA suppression per month on virologically failed 1st-line ART. We evaluated a wide range (0%–1.63%) of values for the resistance penalty, reflecting overlap in both the 95% confidence intervals of the ART efficacy data and uncertainty in the variables informing the resistance penalty.
Costs
We estimated direct medical costs for HIV-related care (e.g., inpatient care, outpatient visits, treatment of acute clinical events, other routine care, medications, and laboratory costs) from the placebo arm of ANRS 059, a trial evaluating cotrimoxazole prophylaxis in Abidjan, as well as from the literature.2, 22, 51 These costs were adjusted to 2006 price levels and converted, when necessary, from local currency to US dollars using official exchange rates. Costs of antiretroviral therapy came from a publicly available pricing guide for developing countries.2 Reflecting 1st-line ART in the ACONDA cohort,44 we calculated a cost of 1st-line ART of $121/year. This was the weighted average of several regimens — 52% stavudine, lamivudine, nevirapine ($100 annually), 22% stavudine, lamivudine, efavirenz ($120 annually), 20% zidovudine, lamivudine, efavirenz ($177 annually), and 6% other ($120 annually). We assumed that 2nd-line ART costs included tenofovir/emtricitabine ($199 annually) plus lopinavir/ritonavir ($550 annually), for a total cost of $749 per year. We assumed all drug costs reflected a WHO-recommended dosing schedule. For each cost estimate, we established plausible upper and lower bounds to evaluate real-world cost differences (e.g., due to projected decreases or realistic variation in 2nd-line ART costs2, 53) as well as to assess uncertainty.
Results
Base-Case Analysis
Undiscounted life expectancy was 2.2 years for cotrimoxazole prophylaxis only and 12.0 years for 1st-line ART only plus cotrimoxazole prophylaxis, with projected undiscounted life expectancies ranging from 14.9 years for clinical monitoring to 17.5 years for biannual CD4 monitoring to 19.3 years for biannual HIV RNA monitoring to guide switching to 2nd-line ART. Compared with only one line of ART, the incremental benefits from the availability of 2nd-line ART ranged from a 24.3% increase in undiscounted life expectancy with clinical monitoring to a 46.4% increase with CD4-based monitoring, to a 61.3% increase with HIV RNA monitoring (Table 3). Given the availability of 2nd-line ART, CD4-based monitoring increased undiscounted life expectancy 17.6% compared to clinical monitoring; HIV RNA monitoring resulted in a further 10.2% increase in undiscounted life expectancy compared to CD4-based monitoring.
Table 3. Benefits and Cost-effectiveness of Select Monitoring Strategies to Guide Switching to 2nd-line ART.
| Strategy* | Relative Increase in LE versus 1st-line ART (%) | Mean CD4 at Observed ART failure (cells/μL) | Incremental Cost-effectiveness Ratio ($/YLS) | ||
|---|---|---|---|---|---|
|
HIV RNA test cost=$87 |
HIV RNA test cost=$50 |
HIV RNA test cost=$25 |
|||
| Cotrimoxazole only | -- | N/A | -- | -- | -- |
| 1st-line ART only plus cotrimoxazole | -- | N/A | 580 | 580 | 580 |
| 1st- & 2nd-line ART, plus cotrimoxazole | |||||
| 1 WHO stage III-IV event‡ | 24.3 | 129 | 1,670 | 1,670 | 1,670 |
| 50% ↓ in peak CD4 count§ | 46.4 | 189 | 2,120 | 2,120 | dominated† |
| HIV RNA, 1 log10 ↑ or return to pre-treatment HIV RNA | 61.3 | 467 | 2,920 | 2,280 | 1,990 |
Abbreviations: LE = life expectancy; ART = antiretroviral therapy; N/A = not applicable; and WHO = World Health Organization.
ART strategies assume prophylaxis with 960 mg of cotrimoxazole daily (800 mg sulfamethoxazole plus 160 mg trimethoprim).35
This strategy is more costly and less cost-effective (i.e., dominated), compared to the next less expensive strategy.
In this strategy, clinical events to guide switching to 2nd-line ART did not include tuberculosis or invasive bacterial diseases.
Strategy recommended in current (2006) WHO guidelines.4
Mean CD4 counts at 1st-line observed failure ranged from 129 to 467 cells/μL, with earlier detection of failure (as occurred with the HIV RNA monitoring strategy) associated with a higher CD4 count at time of failure detection and switching.
Table 3 also shows the incremental cost-effectiveness ratios (ICERs) for each strategy assuming three potential costs for HIV RNA monitoring ($87, $50, and $25). Compared to clinical monitoring, CD4-based monitoring (switching to 2nd-line ART when a 50% decrease in peak CD4 count is observed on 1st-line ART) had an incremental cost-effectiveness ratio of $2,120 per year of life gained (YLS). In comparison, virologic monitoring (with a failure criterion of 1-log10 increase in HIV RNA or return to pre-treatment HIV RNA level) had an incremental cost-effectiveness ratio ranging from $2,920 ($87 per HIV RNA test) to $1,990 ($25 per HIV RNA test) per YLS. Complete results for the base case analysis are shown in the Appendix.
While no consensus exists on a universal threshold below which an intervention would be considered “cost-effective”, benchmarks can be useful to compare the relative value provided by different interventions to improve health. For example, the Commission on Macroeconomics and Health has suggested that an incremental cost-effectiveness ratio of less than 3 times a country's annual per capita gross domestic product (GDP) represents a cost-effective intervention.54, 55 Based on three sources for the annual GDP per capita at nominal values for Côte d'Ivoire (US$1,016 to US$1,178), an approximate cost-effectiveness threshold of three times that would range from approximately US$3,000 to US$3,500.56-58
Sensitivity Analysis
Figure 1 shows the results of sensitivity analyses in which parameters were varied to assess their impact on the incremental cost-effectiveness ratio of virologic monitoring to detect 1st-line ART failure. The analysis was conducted using baseline HIV RNA test costs of both $50 (Upper Panel) and $87 (Lower Panel). In addition to HIV RNA test costs, cost-effectiveness results were most sensitive to the cost of 2nd-line ART and the relative decrease in 2nd-line ART efficacy per month on virologically failed 1st-line ART (i.e., the “resistance penalty”). Cost-effectiveness results were less sensitive to chronic care costs, the cost of CD4 count tests, the efficacy of 2nd-line ART, the discount rate, and the probability of late failure.
Figure 1.
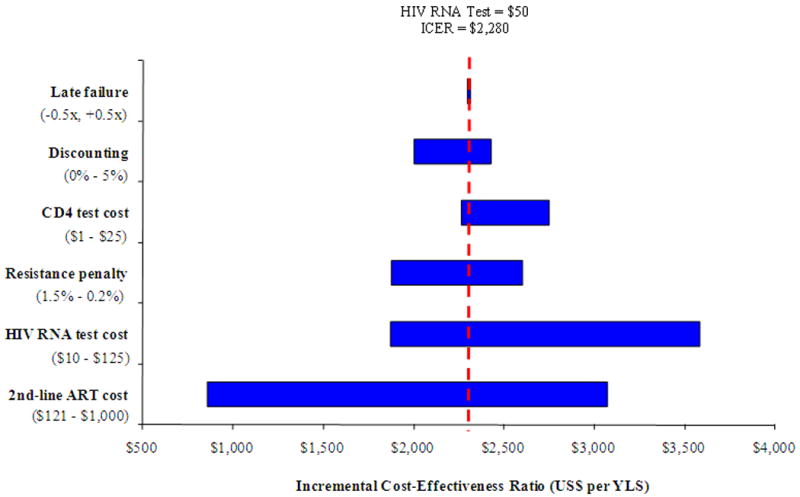
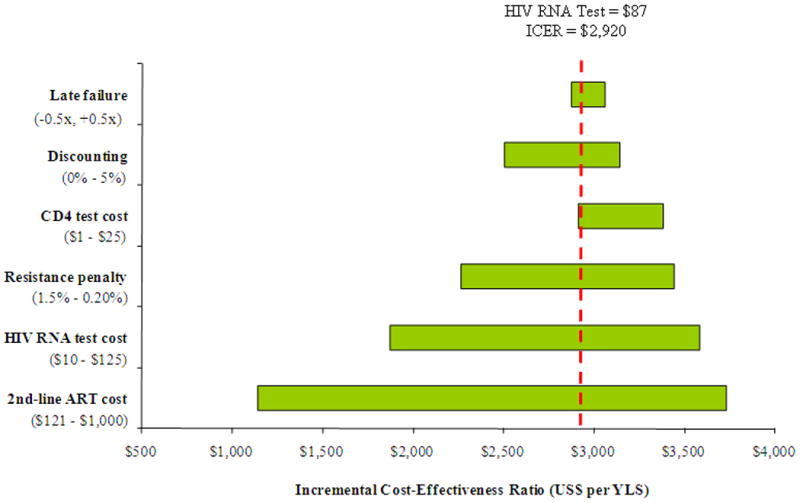
Sensitivity analysis: incremental cost-effectiveness of virologic monitoring. This figure depicts the results of sensitivity analyses on the incremental cost-effectiveness of virologic monitoring with HIV RNA test costs of $50 (Upper Panel) and $87 (Lower Panel). The horizontal axis shows variations in the incremental cost-effectiveness ratio (US$ per YLS) due to changes in values of select model variables listed on the vertical axis. Late failure refers to the monthly risk of virological failure for virologically suppressed patients. “Resistance penalty” refers to the decrease in 2nd-line ART efficacy due to time on virologically failed 1st-line ART (see Methods for details). Values in parentheses specify the upper and lower bounds assessed for each variable. The vertical broken line indicates the incremental cost-effectiveness ratio of virologic monitoring at an HIV RNA test cost of either $50 (upper) or $87 (lower). ICER: incremental cost-effectiveness ratio; ART: antiretroviral therapy; YLS: year of life gained.
As the cost of 2nd-line therapy was reduced, the cost-effectiveness of virologic monitoring became more attractive. If the cost of 2nd-line ART approximated that of 1st-line ART (∼$121 per year) the incremental cost-effectiveness ratio of virologic monitoring improved to less than $1,000 per YLS (HIV RNA test cost of $50) and to less than $1,200 per YLS (HIV RNA test cost of $87). Decreasing the “resistance penalty” influenced both life expectancy and cost-effectiveness for the HIV RNA monitoring strategy. If the baseline resistance penalty was increased from 0.45% (base case) per month to 1.5% per month— as might occur in 3rd-line and subsequent ART regimens — HIV RNA monitoring was both more effective and more cost-effective than all other strategies.
An influential assumption on the cost-effectiveness of virologic monitoring was the duration of 2nd-line ART following detected failure. Consistent with clinical care in many countries, we assumed that 2nd-line ART was continued until death, in spite of clinical, immunologic, and/or virologic failure;4 the increase in life expectancy associated with this base case assumption was approximately 8 months, compared with stopping 2nd-line ART after virologic failure. Given the disproportionate increase in costs across these two extreme assumptions, reduction in the cost of 2nd-line ART and/or stopping 2nd-line ART at some point after virologic failure, had a major influence on the cost-effectiveness of HIV RNA monitoring.
Alternative criteria for detecting 1st-line ART failure
Figure 2 shows the relationship between lifetime costs and life expectancy for the three main base case monitoring strategies and variations of these strategies that alter the criteria for 1st-line ART failure. Strategies that rely on laboratory monitoring — either CD4 count or HIV RNA — to guide switching always resulted in higher life expectancy than strategies relying on clinical monitoring alone. Expanding the clinical failure criterion to include both TB and invasive bacterial diseases was more costly and less cost-effective than the base-case criterion of WHO Stage III-IV events, excluding TB and invasive bacterial diseases, or WHO Stage III-IV, including TB but not invasive bacterial diseases. Changing the CD4 monitoring criterion for 1st-line ART failure from a 50% to a 25% decline in peak CD4 also was an efficient strategy; it was more costly and more effective than the base case strategy, although it was less effective than HIV RNA monitoring. None of the strategies that combined clinical and immunologic or virologic monitoring was more effective, less costly, or more cost-effective, than the base case strategies.
Figure 2.
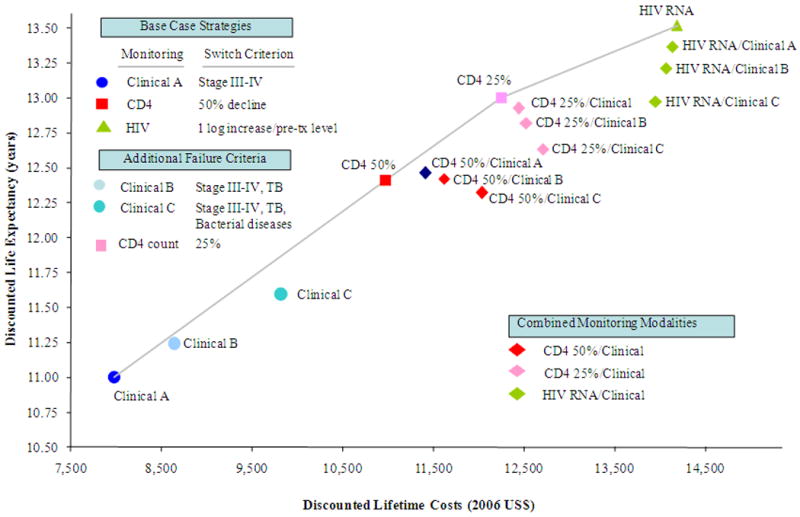
Cost-effectiveness of switching to 2nd-line antiretroviral therapy: the efficient frontier. This figure shows 4 strategies considered to be efficient, including Clinical A (clinical monitoring with a failure criterion of WHO Stage III-IV event (excluding tuberculosis and invasive bacterial diseases)), CD4 count (immunologic monitoring with 1st-line ART failure criteria based on CD4 declines of 50% or 25% from peak on-treatment CD4 count), and HIV RNA test (virologic monitoring with failure criteria based on a log10 increase in or return to pre-treatment HIV RNA). All other strategies shown are more costly and less effective (i.e., strongly dominated), or more costly and less cost-effective (i.e., weakly dominated). Where applicable, an HIV RNA test cost of $87 was assumed.
We also assessed the impact of a 6-month delay in initiation of 2nd-line ART following observed failure of 1st-line ART for all HIV RNA monitoring strategies. This strategy generally was not more effective or more cost-effective than virologic monitoring strategies that did not employ a delay. Results for these sensitivity analyses are shown in the Appendix.
Discussion
In resource-limited settings, the role of CD4 count and HIV RNA monitoring in ART management remains an area of widespread debate, despite being standard clinical practice in most developed countries.5, 16, 59-65 We addressed the impact of using CD4 count and/or HIV RNA monitoring to guide switching to 2nd-line ART in Côte d'Ivoire. We found that earlier detection of 1st-line ART failure (via immunologic or virologic monitoring) resulted in higher CD4 counts upon observed 1st-line ART failure, shorter duration on virologically failed 1st-line ART, and earlier switching to 2nd-line ART. Accordingly, while the incremental life-expectancy gains associated with providing 2nd-line ART (compared with 1st-line ART only) was 24.3% with clinical monitoring, laboratory monitoring substantially increased these survival gains: 46.4% with CD4 count monitoring and 61.3% with HIV RNA monitoring.
This analysis suggests that the cost-effectiveness of laboratory monitoring is influenced most by the cost of 2nd-line ART, the impact of resistance on 2nd-line ART efficacy, and the duration of 2nd-line ART following virologic failure. We found that virologic monitoring would be cost-effective, according to the criteria of the Commission on Macroeconomics and Health, in all of the following instances: the decrease in 2nd-line efficacy due to time spent on virologically failed 1st-line ART is greater than 1% per month, cost of 2nd line ART is less than $300, or if the HIV RNA test cost is less than $90. With the exception of situations where virologic monitoring dominates (i.e., is more effective and less costly, or more effective and more cost-effective) CD4-based monitoring — for example, at very low HIV RNA test costs of $25 — switching to 2nd-line ART based on a 50% decline in CD4 cell counts is consistently cost-effective. At very low HIV RNA test costs, we found that if the CD4 count costs were decreased to less than $15 per test, CD4-based monitoring was no longer dominated. In this case, HIV RNA testing had a cost-effectiveness ratio of $2,030 per life year gained compared to CD4 monitoring, and CD4 count monitoring had a cost-effectiveness ratio of $1,970 per life year gained compared to clinical monitoring.
Due to the high cost of 2nd-line ART, one of the most influential assumptions on the cost-effectiveness of virologic monitoring was the duration of time that 2nd-line ART was continued following failure. Importantly, there is a substantial life expectancy gain associated with continuing ART following virologic failure; however, this clinical benefit is accompanied by an even greater increase in costs. We found that a reduction in 2nd-line ART costs or discontinuing ART after 2nd-line failure – at some point before the end of life – improved the cost-effectiveness of HIV RNA monitoring. It is likely that as HIV-infected individuals in Côte d'Ivoire and other resource-limited settings begin to fail 2nd-line therapy, further downward pressure on drug prices will also provide the opportunity for 3rd-line therapy, including newer drugs. If that is the case, and there is ongoing development of resistance with continuation of 2nd-line therapy after virologic failure of those regimens, then it will also improve long-term outcomes to switch from 2nd- to 3rd-line therapy at the time of virologic failure. This would further support the use of HIV RNA monitoring in the future.
We also assessed several variations of the three main monitoring strategies using alternative clinical criteria for 1st-line failure. Expanding the clinical failure criterion to include TB or invasive bacterial diseases was more costly and less cost-effective than a criterion of WHO Stage III-IV events, excluding TB and invasive bacterial diseases (base case), or WHO Stage III-IV events, including TB but not invasive bacterial diseases. Changing the CD4 monitoring criterion for 1st-line ART failure to a 25% decline in peak CD4 count was an efficient strategy. Although less effective than HIV RNA monitoring, it was both more effective (and more costly) than a criterion of a 50% decline in peak CD4 count (base case). None of the strategies that combined clinical and immunologic or virologic monitoring was more effective or less costly, or more cost-effective, than the base case strategies.
These results have important implications for clinical and budgetary planning. While the results provide information about the value of different laboratory monitoring techniques to detect the timing of 1st-line antiretroviral failure, they can also inform issues related to affordability and budget planning. For example, for a clinic of 10,000 patients — similar to the CePRef clinic in Abidjan44— the percent of patients alive at ten years with CD4-guided switching of antiretroviral therapy would be 66% compared to 60% without CD4 monitoring. Total per person costs of care would increase to $6,120 from $5,040, with the additional costs attributable primarily to earlier switching from 1st-line to more expensive 2nd-line ART.
Several modeling studies have sought to address the debate on laboratory monitoring to guide HIV treatment management in resource-limited settings.5, 19, 61, 64, 66, 67 While results from this analysis correspond with those found in some — but not all — existing studies 61, 64, the current analysis differs from the literature in several ways. First, the underlying model structure varies across studies. For example, Bishai et al. did not explicitly model resistance and used US input data in their model. Bendavid et al. also did not model resistance, and used data from Southern Africa. Both of these studies examined initiation and switching of antiretroviral therapy, not just switching as in the current study.
The different findings in the current study compared to that by Phillips et al. are primarily due to changes in model input parameters. The Phillips study assumed that all patients had a WHO stage 4 event before starting ART, and the mean CD4 count of the cohort at the time of ART initiation was 66/μL. In the current study, only 0.5–20% of the cohort had a prior Stage 3/4 event, and the mean CD4 count was 140/μL. Because the cohort had less severe illness at initiation and experienced lower mortality, the potential benefits of earlier switching using CD4 or HIV RNA testing were greater, leading to lower cost-effectiveness ratios for all monitoring tests.
This study has several limitations. First, we assumed that results from CD4 count and HIV RNA tests accurately reflect underlying patient-level disease status and that laboratories used to analyze test measurements yield accurate and consistent results.68-70 Second, we did not assess different CD4 count and HIV RNA test technologies, nor did we consider alternative delivery mechanisms. Third, limited data were available to inform the “resistance penalty”. Although an emerging literature exists on drug- and/or regimen-specific mutation accumulation,40 little information exists on the impact of regimen-specific mutations on subsequent antiretroviral efficacy. Therefore, we believe the method used to characterize the impact of resistance as a function of time on virologically failed ART most accurately reflects the evidence base.41, 42 To that end, we used the most current data available to inform the resistance penalty and performed extensive sensitivity analysis on this parameter. Fourth, we did not account for the fact that CD4 count decline may be discordant with virologic failure; therefore, without HIV RNA monitoring some people will be unnecessarily switched to 2nd-line therapy.71, 72 Accounting for this discordant response would make HIV RNA monitoring even more favorable. Finally, we did not factor into the analysis the impact of resistance on HIV transmission dynamics. Specifically, we did not account for any population-level benefit of decreased HIV transmission of wild type or resistant virus due to earlier switching from a virologically failed 1st-line regimen to an effective 2nd-line regimen. Inclusion of these effects likely would result in HIV RNA monitoring appearing even more favorable.
As ART becomes increasingly available for HIV-infected individuals in Côte d'Ivoire and in other resource-limited settings, it is critical to understand both the clinical and economic value of laboratory monitoring for HIV management. This analysis suggests that CD4 count and HIV RNA monitoring to guide switching to 2nd-line ART in resource-limited settings improves survival and under most conditions is cost-effective. These results support the value of investing in low-cost HIV RNA tests, reducing prices for 2nd-line ART, and developing a better understanding of the relationships between delayed switching, development of resistance mutations, and subsequent antiretroviral efficacy.
Acknowledgments
We are grateful to technical assistance provided by Brandon Morris, Lauren Uhler, Caroline Sloan and Sarah Bancroft Lorenzana at the US study site. We also extend thanks to the Côte d'Ivoire ANRS research site study team (Programme PAC-CI, Abidjan, Côte d'Ivoire), the Association Aconda study team (Abidjan, Côte d'Ivoire), the CeDReS laboratory team (CHU de Treichville, Abidjan, Côte d'Ivoire) and the INSERM U897 research team (University of Bordeaux 2, France). Special thanks are extended to the patients who have been participating in the ANRS clinical studies in Abidjan since 1996 and who have greatly contributed in increasing knowledge of HIV natural history and treatment efficacy in Côte d'Ivoire.
Supported in part by the National Institute of Allergy and Infectious Diseases (T32 AI007433, R01 AI058736, K24 AI062476, K25 AI50436, and CFAR P30 AI42851), the French Agence National de Recherches sur le SIDA (ANRS 1286), the Agency for Healthcare Research and Quality (T32 HS000055), the Doris Duke Charitable Foundation (CSDA 2005075), the Project on Justice, Welfare and Economics, Weatherhead Center for International Affairs, Harvard University, and the Graduate Society Summer Fellowship, Graduate School of Arts and Sciences, Harvard University.
Technical Appendix
The text below provides additional detail on the methods informing this paper, as well as supplementary results and sensitivity analysis.
Appendix Methods
Strategies
To quantify the benefit from the availability of 2nd-line therapy, we included two relevant comparators among the base case strategies: cotrimoxazole prophylaxis only and 1st-line ART only plus cotrimoxazole prophylaxis. In the base case, we assessed three main monitoring approaches: (1) clinical monitoring, with failure defined as a WHO stage III-IV event; (2) immunologic monitoring, with failure defined as a 50% decrease from peak regimen-specific CD4 count (consistent with WHO recommendations); and (3) virologic monitoring, with failure defined as a minimum 1-log10 increase in HIV RNA and/or return to pre-treatment HIV RNA level. In a secondary analysis, we evaluated variations of the three main monitoring strategies. These included: (1) alternative clinical criteria for 1st line failure (WHO stage III-IV event or TB, WHO stage III-IV event or TB or invasive bacterial diseases); (2) alternative immunologic criteria for 1st line failure (25% decrease from peak regimen-specific CD4 count); (3) combined clinical and immunologic / virologic monitoring (e.g., WHO stage III-IV event or a minimum 1-log10 increase in HIV RNA and/or return to pre-treatment HIV RNA level); (4) delayed initiation of second-line ART following virologic failure. A complete list of strategies is shown in Appendix Table A1.
Model Structure
We employed a 1st-order Monte Carlo simulation model — the CEPAC-International model — of HIV disease progression and treatment. The model is characterized by three main health states — Chronic HIV, Acute Events, and Death — which are further defined by current and setpoint HIV RNA, current and nadir CD4 count, and current and prior opportunistic infections. Using a random number generator to draw from an initial distribution of country-specific demographic (age, sex) and clinical characteristics (CD4 count, HIV RNA level, history of opportunistic infection), the model simulates individual patients whose clinical course is tracked from model entry until death. A sequence of monthly transition probabilities determines each individual patient's chance of transitioning to or remaining in a particular health state.
The model projects state-specific intermediate outcomes (e.g., mechanism of detection for antiretroviral failure, mean CD4 cell count upon observed antiretroviral therapy failure, mean time between virologic failure and observed failure) associated with each health state and long-term aggregate outcomes (e.g., mean life expectancy and lifetime costs). To obtain stable estimates for each strategy, one million simulations are conducted, one at a time, with summary statistics calculated across the simulated cohort. The model is coded in the C programming language and compiled in VC++ 6.0 (Microsoft, Redmond, WA).
The Resistance Penalty
In the presence of ineffective antiretroviral therapy (ART) (i.e., upon true, but not yet detected, virologic failure), we hypothesize that individuals faced consequences for time on ineffective treatment. Specifically, upon virologic failure, we assume patients receiving antiretroviral therapy while not fully suppressed virologically are at greater risk of developing resistance to subsequent drug regimens.1 The resistance penalty characterizes resistance based on an individual's cumulative time spent on failed antiretroviral therapy2, 3 and yields a reduction in the efficacy of subsequent antiretroviral regimens containing drugs in the same class from which resistance arose. Please see the main text for the detailed information regarding specification of the resistance penalty.
Antiretroviral Therapy Initiation
In the base case, HIV-infected individuals received 1st-line antiretroviral therapy when a patient's pre-treatment CD4 cell count fell below 200 cells/mm3; a patient experienced any one severe opportunistic infection (bacterial enteritis, other invasive bacterial diseases, tuberculosis, other WHO stage III–IV events, malaria, or other non-specific severe events); or when a patient presented with CD4 cell count above 200 cells/mm3 but below 350 cells/mm3 along with a primary or secondary opportunistic infection.4 In settings in which laboratory tests were not routinely available (see Secondary Analysis), patients started 1st-line antiretroviral therapy after experiencing any one of severe opportunistic infections (bacterial enteritis, other severe bacterial diseases, tuberculosis, other WHO stage III–IV events, malaria, or other non-specific severe events).
Assumptions
We made a number of assumptions in the model: First, HIV-infected individuals initiated 1st-line ART in accordance with current WHO guidelines.4 We also assumed that CD4 counts were used to initiate 1st-line ART no matter the monitoring strategy; however, CD4 tests after antiretroviral initiation were administered only if specified by the monitoring strategy. Second, due to possible initial patient adherence issues, detection of 1st-line ART failure could not occur until at least 12 months after initiation of the 1st-line regimen. Third, we assumed that all opportunistic infections were detected and treated. Fourth, we assumed that variations in immunologic measurements (due to individual biologic variation or test measurement error) and virologic measurements (due to individual biologic variation, test measurement errors, or virologic “blips”) were captured in CD4 cell count and HIV RNA strata. Fifth, laboratory tests were repeated to verify immunologic or virologic failure of antiretroviral therapy. Sixth, diagnostic tests were discontinued after observed failure of the last ART regimen and patients remained on the 2nd-line regimen for the duration of his or her lifetime.4 Finally, regimen-specific virologic suppression on antiretroviral therapy was limited to ≤15 years. Model assumptions were evaluated in sensitivity analysis.
Clinical Data
Additional data not shown in Manuscript Table 2 are shown in Appendix Table A2. Information on the derivation of select estimates is discussed in the text that follows.
Table A2. Additional Model Input Variables.
| Variable | Base Case Value | Reference(s) | |||||||||||
|---|---|---|---|---|---|---|---|---|---|---|---|---|---|
| Clinical characteristics in the absence of antiretroviral therapy | |||||||||||||
| Mean monthly CD4 count decline (SD) by HIV RNA stratum (cells/μL) | Mellors et al.8 | ||||||||||||
| > 30,000 copies/mL | 6.4 (0.3) | ||||||||||||
| 10,001–30,000 copies/mL | 5.4 (0.2) | ||||||||||||
| 3,001–10,000 copies/mL | 4.6 (0.2) | ||||||||||||
| 500–3,000 copies/mL | 3.0 (0.3) | ||||||||||||
| <500 copies/mL | 3.0 (0.3) | ||||||||||||
| Rate of clinical events, by CD4 count (events per 100 person-years)* | Minga et al.,9 Seyler et al.10 | ||||||||||||
| ≤50 cells/mL | 51–100 cells/mL | 101–200 cells/mL | 201–350 cells/mL | 350–500 cells/mL | >500 cells/mL | ||||||||
| HIV-related, severe | |||||||||||||
| WHO stage III–IV | |||||||||||||
| Visceral | 35.54 | 17.32 | 4.21 | 2.45 | 0.65 | 0.43 | |||||||
| Non-visceral | 33.42 | 15.99 | 5.55 | 1.44 | 0.71 | 0.27 | |||||||
| Non-specific | 25.23 | 11.80 | 5.72 | 1.72 | 1.07 | 0.54 | |||||||
| Bacterial enteritis | 16.10 | 15.60 | 10.24 | 5.78 | 3.91 | 2.19 | |||||||
| Bacterial infections | 15.66 | 40.81 | 17.67 | 9.11 | 6.34 | 4.96 | |||||||
| Malaria | 36.27 | 34.28 | 22.62 | 14.94 | 20.64 | 17.01 | |||||||
| Tuberculosis | 4.21 | 8.03 | 7.96 | 3.09 | 1.70 | 0.28 | |||||||
| HIV-related, mild | |||||||||||||
| Fungal infections | 119.28 | 56.43 | 31.58 | 13.94 | 12.41 | 8.10 | |||||||
| Bacterial infections | 24.37 | 22.95 | 21.71 | 16.19 | 12.93 | 12.07 | |||||||
| Other | 50.79 | 35.21 | 31.80 | 18.93 | 12.51 | 10.60 | |||||||
| Other severe events† | 5.10 | 4.10 | 3.10 | 2.10 | 1.00 | 0.70 | |||||||
| % acute mortality, by CD4 count stratum | Minga et al.,9 Seyler et al.10 | ||||||||||||
| ≤50 cells/mL | 51–100 cells/mL | 101–200 cells/mL | 201–350 cells/mL | 350–500 cells/mL | >500 cells/mL | ||||||||
| HIV-related, severe | |||||||||||||
| WHO stage III–IV | |||||||||||||
| Visceral and non-specific events | 40.00 | 32.3 | 9.72 | 4.65 | 1.50 | 0.00 | |||||||
| Bacterial infections and malaria | 14.29 | 14.29 | 5.77 | 3.25 | 0.00 | 0.00 | |||||||
| Tuberculosis | 50.00 | 50.00 | 22.22 | 4.17 | 1.50 | 0.00 | |||||||
| Non-HIV–related† | 14.29 | 14.29 | 5.77 | 3.25 | 0.00 | 0.00 | |||||||
| Rate of chronic HIV/AIDS mortality in the absence of antiretroviral therapy, by CD4 count stratum (events per 100 person-years)* | Minga et al.,9 Seyler et al.10 | ||||||||||||
| ≤50 cells/mL | 51–100 cells/mL | 101–200 cells/mL | 201–350 cells/mL | 350–500 cells/mL | >500 cells/mL | ||||||||
| WHO stage III–IV events, excluding TB and invasive bacterial diseases | 63.95 | 63.95 | 34.79 | 18.11 | 1.58 | 0.00 | |||||||
| HIV-related TB and invasive bacterial diseases, malaria, and other severe events | 13.25 | 13.25 | 5.96 | 3.30 | 1.58 | 0.00 | |||||||
| Efficacy and toxicity of cotrimoxazole‡ | Anglaret et al.,11 Yazdanpanah et al.12 | ||||||||||||
| Efficacy (% reduction in risk of opportunistic infection) | |||||||||||||
| Mild bacterial infection | 48.8 | ||||||||||||
| Bacterial enteritis and other severe bacterial infection | 49.8 | ||||||||||||
| Malaria | 88.4 | ||||||||||||
| Isosporiasis | 81.8 | ||||||||||||
| Toxoplasmic encephalitis | 83.3 | ||||||||||||
| Acute unexplained fever | 17.9 | ||||||||||||
| Toxicity (per 100 person-months) | |||||||||||||
| Minor events | 1.9 | ||||||||||||
| Major events | 0.7 | ||||||||||||
| Antiretroviral efficacy | Delfraissy et al.,5 Johnson et al.,6 Marconi et al.7 | ||||||||||||
| 3rd-line antiretroviral therapy in the absence of resistance | |||||||||||||
| HIV RNA suppression§ | 77.0% at 24 weeks | ||||||||||||
| CD4 count increase¶ | +105 cells/μL at 24 weeks | ||||||||||||
| Resistance penalty (monthly relative decrease)§ | -1.00% in 3rd-line HIV RNA suppression at 24 weeks per month on virologically failed 1st- and 2nd-line ART | ||||||||||||
| Costs (2006 US$)‖ | |||||||||||||
| Opportunistic infection treatment (per event) | Yazdanpanah et al.12 | ||||||||||||
| HIV-related, severe* | |||||||||||||
| WHO stage III–IV | |||||||||||||
| Visceral | 98.16 | ||||||||||||
| Non-visceral | 98.16 | ||||||||||||
| Non-specific | 93.69 | ||||||||||||
| Bacterial enteritis | 137.39 | ||||||||||||
| Bacterial infections | 137.39 | ||||||||||||
| Malaria | 96.17 | ||||||||||||
| Tuberculosis | 329.74 | ||||||||||||
| HIV-related, mild | |||||||||||||
| Fungal infections | 47.32 | ||||||||||||
| Bacterial infections | 53.43 | ||||||||||||
| Other | 53.43 | ||||||||||||
| Non-HIV–related† | 94.65 | ||||||||||||
| Antiretroviral therapy (annual) | Médicins sans Frontières,13 Yazdanpanah et al.12 | ||||||||||||
| 3rd-line ART (PI-based)** | 749.00 | ||||||||||||
Abbreviations: WHO = World Health Organization; PY = person-year; NNRTI = non-nucleoside reverse transcriptase inhibitor; PI = protease inhibitor; and IQR = interquartile range.
Note: Unless otherwise indicated, model variables were varied +/-50% to assess the impact of clinically plausible variations in assumptions and parameter values.
Clinical events categorized as WHO stage III–IV events did not include invasive bacterial diseases or tuberculosis unless otherwise specified. In the model, WHO stage III-IV events consisted of severe visceral events, non-visceral events, and non-specific events. We defined visceral events as the occurrence of toxoplasmosis, isosporosis, cryptococcosis, Kaposi's sarcoma, lymphoma, cryptosporidiosis, microsporidiosis, non-tuberculosis mycobacteriosis, invasive herpes simplex virus, or cytomegalovirus infection. Non-visceral events included chronic genital herpes simplex virus and oesophogeal candidiasis. Non-specific events consisted of unexplained diarrhea for >30 days and fever of unexplained origin (no foccus, non-specific pneumonia, and non-specific neurologia). Other severe opportunistic infections included tuberculosis and severe bacterial events (pneumonia, isolated bacteremia, invasive uro-genital events, and severe bacterial infections from other causes). Estimates assumed no administration of cotrimoxazole to the study population. In sensitivity analysis, we varied incidence of opportunistic events by +/-50%.
Other severe events were defined as severe events requiring hospitalization (e.g., acute unexplained fever or acute unexplained diarrhea with hospitalization).
In accordance with WHO guidelines, patients received 960 mg of cotrimoxazole daily (800 mg sulfamethoxazole plus 160 mg trimethoprim).14
We assumed 3rd-line HIV RNA suppression in the presence of resistance was 61.3% at 24 weeks;6 in the absence of resistance, we assumed a value of 77.0% suppressed at 24 weeks.5 In the absence of data on time on virologically failed 2nd-line ART, we derived the value for the resistance penalty as applied to 3rd-line ART by calibrating the value of the resistance penalty (1.0% per month) until aggregate outcomes across all simulated patients reflected 61.3% HIV RNA suppression (24 weeks)6 in patients receiving 3rd-line ART.
For 3rd-line ART (assessed in a secondary analysis), we estimated 24-week CD4 count increases from baseline of 105 cells/μL, which reflects adjustments for loss to follow-up and reporting time.
Cost estimates did not include direct non-medical costs, patient time costs, or the opportunity cost of foregone earnings due to illness. All costs were adjusted to 2006 price levels and converted, when necessary, from local currency to US dollars using official exchange rates.
The Resistance Penalty
For the resistance penalty (i.e., the decrease in subsequent antiretroviral efficacy due to accumulated resistance mutations), we drew upon data from the literature and assumptions to determine a conservative baseline value and plausible range. Antiretroviral efficacy estimates for a 2nd-line, PI-based regimen in the absence of resistance were derived from the MONARK trial, which evaluated lopinavir/ritonavir plus zidovudine and lamivudine in 53 treatment naïve patients (77% HIV RNA suppressed <400 copies/mL at 24 weeks).5 Second-line, PI-based antiretroviral efficacy in the presence of resistance was derived from 80 treatment-experienced patients receiving atazanavir plus ritonavir, tenofovir, and 1 nucleoside reverse transcriptase inhibitor (didanosine, stavudine, lamivudine, zidovudine, or abacavir); HIV RNA suppression <400 copies/mL was estimated as 73.3% at 24 weeks.6
We assumed the cumulative time on virologically failed 1st-line ART was 10.8 months, which reflects median duration of ART prior to study enrollment in 124 subjects experiencing virologic failure after 24 weeks on their 1st ART regimen.7 While some study subjects enrolled were receiving a PI-based regimen at the time of enrollment, over 90% were receiving an NNRTI-based regimen. We assumed a range for time on virologically failed 1st-line ART of 3 months (for patients observed to have failed via virologic criterion) to 58 months (for patients observed to have failed via immunologic criterion (25% decrease in peak CD4)). These data yielded an estimate of a 0.45% (range: 0.00%–1.63%) relative monthly decrease in 2nd-line HIV RNA suppression at 24 weeks due to time on virologically failed 1st-line ART.
For a secondary analysis in which we assumed treatment expansion to 3rd-line ART, we estimated a resistance penalty of 0.45% per month on virologically failed 1st-line ART (as in the base case) and 1.00% per month on virologically failed 2nd-line ART. The latter estimate was obtained by calibrating the value of the resistance penalty until aggregate outcomes across all simulated patients reflected 61.3% HIV RNA suppression (24 weeks)6 in patients receiving 3rd-line ART.
Appendix Results
Base Case and Modified Base Case Strategies
Complete results for all 19 monitoring strategies (base case strategies and variations of these strategies), along with cotrimoxazole prophylaxis and 1st-line ART only plus cotrimoxazole prophylaxis, are shown in Appendix Table A3. Undiscounted life expectancy was 2.2 years for cotrimoxazole prophylaxis only and 12.0 years for 1st-line ART only plus cotrimoxazole prophylaxis. In the base case, undiscounted life expectancy associated with the availability of 2nd-line ART ranged from 14.9 years for clinical monitoring (1st-line ART failure criterion of 1 WHO stage III-IV event, excluding tuberculosis and invasive bacterial diseases) to 17.5 years for biannual CD4 monitoring (50% decrease in peak CD4) to 19.3 years for biannual HIV RNA monitoring to guide switching to 2nd-line ART (immediate switch). Compared with only 1 line of ART, the incremental benefits from the availability of 2nd-line ART ranged from a 24.3% increase in undiscounted life expectancy to a 46.4% increase to a 61.3% increase, respectively. Mean CD4 counts at 1st-line observed failure ranged from 129 to 467 cells/μL, with earlier detection of failure (as occurred with HIV RNA monitoring strategies) associated with a higher CD4 count at time of failure detection and switching.
Appendix Table A3 shows the discounted costs and incremental cost-effectiveness ratios for each strategy assuming an HIV RNA test cost of $87 per test. Compared to clinical monitoring, CD4-based monitoring (switching to 2nd-line ART when a 50% decrease in peak CD4 count is observed on 1st-line ART) had an incremental cost-effectiveness ratio of $2,120 per year of life gained (YLS). In comparison, virologic monitoring (with a failure criterion of 1-log10 increase in HIV RNA or return to pre-treatment HIV RNA level) had an incremental cost-effectiveness ratio of $3,750 per YLS.
Appendix Table A3 also shows complete results of the modified base case strategies with alternative 1st-line ART failure criteria. None of the strategies that combined clinical and immunologic or virologic monitoring were more effective, less costly, or more cost-effective, than the base case strategies. These modified base case strategies are presented pictorially in Figure 2 of the main text.
In the base case, we examined the impact of different monitoring strategies on the timing of ART (Appendix Figure A1). For HIV RNA monitoring (immediate switch), mean duration on virologically failed 1st-line ART was 1.1 years, representing approximately 5.5% of total life expectancy. In contrast, mean time on virologically failed ART for a CD4-based monitoring strategy (50% decrease in peak CD4) was 5.1 years, or 28.9% of total life expectancy. Detecting ART failure earlier — as occurs when using HIV RNA monitoring — resulted in a shorter duration on virologically failed 1st-line ART and longer total duration on 2nd-line ART.
We also evaluated the influence of different monitoring strategies on survivorship (Appendix Figure A2). Median survivals were 12.79 years for a clinical switching strategy, 16.13 years for a CD4-based switching strategy, and 18.96 years for an HIV RNA-based switching strategy. By approximately 2 years, the proportion of the initial cohort surviving when relying on HIV RNA-based switching criteria always exceeded the proportion surviving when relying on CD4-based criteria. By approximately 5 years, the proportion of the initial cohort surviving when relying on CD4-based criteria always exceeded the proportion surviving when relying on clinical criteria.
Secondary Analyses
Settings in Which No Laboratory Monitoring is Available
In this secondary analysis, we assumed that no CD4 and/or HIV RNA tests were available and that all treatment-related decisions, including antiretroviral therapy initiation, relied solely on clinical information. First-line ART only resulted in discounted life expectancy of 9.39 years and discounted lifetime costs of $5,290. With the availability of 2nd-line ART, mean CD4 count at 1st-line observed failure ranged from 129 to 243 cells/μL using failure criterions of 1 WHO stage III-IV event, excluding tuberculosis but not invasive bacterial diseases, and 1 WHO stage III-IV event, including both tuberculosis and invasive bacterial diseases, respectively. Using 1 WHO stage III–IV event, excluding both tuberculosis and severe bacterial diseases, to guide switching increased discounted life expectancy by 1.62 years and lifetime costs by $2,700, for an incremental cost-effectiveness ratio of $1,670 per year of life gained compared to 1st-line ART only. The addition of tuberculosis to the clinical failure criterion increased life expectancy 0.23 years for an additional $650. Including both tuberculosis and invasive bacterial diseases resulted in an additional 0.35 years and $1,170, for an incremental cost-effectiveness ratio of $3,340 compared to clinical monitoring with a failure criterion of 1 WHO stage III-IV event, including tuberculosis only.
Treatment Expansion to 3rd-line ART
Because 3rd-line and subsequent regimens are becoming increasingly available in settings like Côte d'Ivoire, we assessed the impact of available downstream regimens in sensitivity analysis. Compared to a clinical monitoring strategy, a CD4-based strategy with failure defined as at least a 50% decrease in peak on-treatment CD4 increased discounted life expectancy by 1.90 years and lifetime costs by $3,590. Using a 1-log10 increase in HIV RNA or return to pre-treatment HIV RNA level provided the greatest clinical benefit of all monitoring strategies assessed (discounted life expectancy of 14.7 years) for an additional $3,920 compared to CD4-based monitoring.
Sensitivity Analysis
We assessed the robustness of results through clinically plausible variations in assumptions and parameter values. In the text that follows and in Appendix Table A4, we present select results not discussed in the main text.
Select One-way Sensitivity Analyses
CD4 at Presentation (Table A4-a)
We considered three cohorts entering care with CD4 counts of 100 (standard deviation (SD) 25), 250 (SD 25), and 425 (SD 25) cells/μL (versus CD4 count 140 (SD 116) cells/μL in the base case). No matter the stage at which patients entered care, we found that life expectancy for HIV RNA monitoring strategies exceeded CD4 monitoring strategies, which in turn exceeded clinical monitoring strategies. When patients entered care later (i.e., initial CD4 count 100 (SD 25) cells/μL), monitoring strategies resulting in earlier detection of 1st-line ART failure (as occurred with HIV RNA monitoring) became increasingly cost-effective compared to monitoring strategies detecting 1st-line ART failure later (as occurred with CD4-based monitoring strategies).
Effectiveness of Antiretroviral Therapy (Table A4-b)
Decreasing 2nd-line HIV RNA suppression in the absence of resistance from 80.4% to 64.0% (24 weeks) diminished both discounted life expectancy and discounted lifetime costs for all monitoring strategies. When we assumed that 2nd-line HIV RNA suppression increased (88% suppressed at 24 weeks), both life expectancy and lifetime costs for all monitoring increased. However, in both cases, the relative ranking of the monitoring strategies did not change and our policy conclusions remained consistent.
We also assessed the delay in CD4 decline after virologic failure. When we assumed a delay in CD4 decline >18 months after virologic failure (versus 12 months in the base case), we found that an HIV RNA temporal strategy (i.e., relying on HIV RNA to identify failure and postponing the switch to 2nd-line ART by 6 months) became an efficient strategy (results not shown). However, variations in our assumptions regarding the delay in CD4 decline after virologic failure did not change overall policy conclusions.
Monitoring Frequency (Table A4-c)
We explored the implications of using different CD4 and HIV RNA monitoring frequencies. Monitoring HIV RNA every 12 months (rather than every 6 months, as in the base case) followed by an immediate switch decreased both lifetime costs and life expectancy; however, lifetime costs decreased at a rate faster than life expectancy, thereby decreasing the incremental cost-effectiveness ratio compared to CD4 monitoring. While discounted life expectancy for this strategy decreased by about 1% compared to the base case (13.36 years vs. 13.52 years), discounted lifetime costs decreased by over 10.3% ($12,860 vs. $14,190).
Table A1. Monitoring Strategies to Guide Switching to 2nd-line ART.
| Strategy* | Test Modality | Criteria for 1st-line ART Failure |
|---|---|---|
| Clinical Monitoring (Stage III-IV)† | Clinical | WHO stage III-IV event |
|
| ||
| Stage III-IV & TB | Clinical | WHO stage III-IV event or TB |
| Stage III-IV & TB, Bacterial | Clinical | WHO stage III-IV event or TB or severe bacterial infection |
|
| ||
| Immunologic Monitoring (50%↓CD4)‡ | CD4 | 50% ↓ in peak CD4 |
|
| ||
| 25% ↓ in peak CD4 | CD4 | 25% ↓ in peak CD4 |
| Stage III-IV/CD4 | Clinical/CD4 | WHO stage III-IV event or 50% ↓ in peak CD4 |
| Stage III-IV & TB/CD4 50% | Clinical/CD4 | WHO stage III-IV event or TB or 50% ↓ in peak CD4 |
| Stage III-IV & TB, Bacterial/CD4 50% | Clinical/CD4 | WHO stage III-IV event or TB or severe bacterial infection or 50% ↓ in peak CD4 |
| Stage III-IV/CD4 25% | Clinical/CD4 | WHO stage III-IV or 25% ↓ in peak CD4 |
| Stage III-IV & TB/CD4 25% | Clinical/CD4 | WHO stage III-IV event or TB or 25% ↓ in peak CD4 |
| Stage III-IV & TB, Bacterial/CD4 25% | Clinical/CD4 | WHO stage III-IV event or TB or severe bacterial infection or 25% ↓ in peak CD4 |
|
| ||
| Virologic Monitoring (1-log ↑/pre-tx) | HIV RNA | 1-log10 ↑ or return to pre-treatment HIV RNA |
|
| ||
| Delayed switch to 2nd-line (6 months) | HIV RNA | WHO stage III-IV event or 1-log10 ↑ or return to pre-treatment level |
| Stage III-IV/HIV RNA | Clinical/HIV RNA | WHO stage III-IV event or 1-log10 ↑ or return to pre-treatment HIV RNA |
| Stage III-IV & TB/HIV RNA | Clinical/HIV RNA | WHO stage III-IV event or TB or 1-log10 ↑ or return to pre-treatment HIV RNA |
| Stage III-IV & TB, Bacterial/HIV RNA | Clinical/HIV RNA | WHO stage III-IV event or TB or severe bacterial infection or 1-log10 ↑ or return to pre-treatment HIV RNA |
| Stage III-IV/HIV RNA (6 months) | Clinical/HIV RNA | WHO stage III-IV or 1-log10 ↑ or return to pre-treatment HIV RNA |
| Stage III-IV & TB/HIV RNA (6 months) | Clinical/HIV RNA | WHO stage III-IV event or TB or 1-log10 ↑ or return to pre-treatment HIV RNA |
| Stage III-IV & TB, Bacterial/HIV RNA (6 months) | Clinical/HIV RNA | WHO stage III-IV event or TB or severe bacterial infection or 1-log10 ↑ or return to pre-treatment HIV RNA |
Abbreviations: ART = antiretroviral therapy; WHO = World Health Organization; and TB = tuberculosis.
Shaded rows indicate the 3 general base case strategies. Strategies evaluated in secondary analyses are shown without shading. In the strategies, clinical, immunologic, and virologic observed failure criteria for 1st-line ART were not mutually exclusive. For example, observed 1st-line ART failure could occur based on either clinical criteria (i.e., 1 WHO stage III-IV event excluding TB and bacterial infections) or immunologic criteria (i.e., 25% decrease in peak, regimen-specific CD4).
Clinical events categorized as WHO stage III–IV events did not include invasive bacterial diseases or tuberculosis unless otherwise specified. In the model, WHO stage III-IV events consisted of severe visceral events, non-visceral events, and non-specific events. We defined visceral events as the occurrence of toxoplasmosis, isosporosis, cryptococcosis, Kaposi's sarcoma, lymphoma, cryptosporidiosis, microsporidiosis, non-tuberculosis mycobacteriosis, invasive herpes simplex virus, or cytomegalovirus infection. Non-visceral events included chronic genital herpes simplex virus and oesophogeal candidiasis. Non-specific events consisted of unexplained diarrhea for >30 days and fever of unexplained origin (no foccus, non-specific pneumonia, and non-specific neurologia). Other severe opportunistic infections included tuberculosis and severe bacterial events (pneumonia, isolated bacteremia, invasive uro-genital events, and severe bacterial infections from other causes). Estimates assumed no administration of cotrimoxazole to the study population. In sensitivity analysis, we varied incidence of opportunistic events by +/-50%.
Immunologic failure occurred based on a percent decrease in peak observed, regimen-specific CD4 count.
Table A3. Clinical Benefits, Costs, and Cost-effectiveness of Monitoring Strategies to Guide Switching to 2nd-line Antiretroviral Therapy: Base Case and Modified Base Case Strategies (HIV RNA Test Cost = $87).
| Strategy* | Mean CD4 at Observed ART Failure (cells/mL) | Undiscounted Life Expectancy (years) | Discounted Life Expectancy (years) | Discounted Lifetime Costs ($)† | ICER ($/years of life gained)‡ |
|---|---|---|---|---|---|
| Cotrimoxazole only | N/A | 2.21 | 2.11 | 1,060 | -- |
| 1st-line ART only plus cotrimoxazole | N/A | 11.95 | 9.39 | 5,290 | 580 |
| 1st- & 2nd-line ART plus cotrimoxazole | |||||
|
| |||||
| 1 WHO stage III-IV event§ | 129 | 14.85 | 11.01 | 7,990 | 1,670 |
|
| |||||
| 1 WHO stage III-IV event, including TB | 173 | 15.29 | 11.24 | 8,640 | dominated |
| 1 WHO stage III-IV event, including TB or invasive bacterial diseases | 243 | 15.90 | 11.59 | 9,810 | dominated |
|
| |||||
| 50% decrease in peak CD4¶ | 189 | 17.49 | 12.42 | 10,980 | 2,120 |
|
| |||||
| 50% decrease in peak CD4 or 1 WHO stage III-IV event | 214 | 17.50 | 12.47 | 11,410 | dominated |
| 50% decrease in peak CD4 or 1 WHO stage III-IV event, including TB | 230 | 17.40 | 12.41 | 11,600 | dominated |
| 50% decrease in peak CD4 or 1 WHO stage III-IV event, including TB or invasive bacterial infections | 265 | 17.18 | 12.32 | 12,030 | dominated |
|
| |||||
| 25% decrease in peak CD4 | 308 | 18.48 | 13.00 | 12,240 | 2,170 |
|
| |||||
| 25% decrease in peak CD4 or 1 WHO stage III-IV event | 310 | 18.31 | 12.93 | 12,440 | dominated |
| 25% decrease in peak CD4 or 1 WHO stage III-IV event, including TB | 312 | 18.12 | 12.83 | 12,540 | dominated |
| HIV RNA temporal (Switch 6 months after observed failure) or 1 WHO stage III-IV event, including TB or invasive bacterial diseases‖ | 418 | 17.62 | 12.61 | 12,610 | dominated |
| 25% decrease in peak CD4 or 1 WHO stage III-IV event, including TB or invasive bacterial diseases | 321 | 17.71 | 12.63 | 12,710 | dominated |
| HIV RNA temporal (Switch 6 months after observed failure) or 1 WHO stage III-IV event, including TB | 440 | 18.30 | 12.95 | 13,170 | dominated |
| HIV RNA temporal (Switch 6 months after observed failure) or 1 WHO stage III-IV event | 452 | 18.64 | 13.14 | 13,450 | dominated |
| HIV RNA temporal (Switch 6 months after observed failure) | 467 | 19.13 | 13.38 | 13,830 | dominated |
| HIV RNA (Switch immediately) or 1 WHO stage III-IV event, including TB or invasive bacterial diseases | 418 | 18.22 | 12.97 | 13,950 | dominated |
| HIV RNA (Switch immediately) or 1 WHO stage III-IV event, including TB | 440 | 18.71 | 13.22 | 14,070 | dominated |
| HIV RNA (Switch immediately) or 1 WHO stage III-IV event | 452 | 18.97 | 13.34 | 14,110 | dominated |
|
| |||||
| HIV RNA (Switch immediately)¶ | 467 | 19.28 | 13.52 | 14,190 | 3,750 |
Abbreviations: ICER = incremental cost-effectiveness ratio; N/A = not applicable; ART = antiretroviral therapy; WHO = World Health Organization; and TB = tuberculosis.
Shaded rows indicate the 3 general base case strategies. Strategies evaluated in secondary analyses are shown without shading. In the strategies, clinical, immunologic, and virologic observed failure criteria for 1st-line ART were not mutually exclusive. For example, observed 1st-line ART failure could occur based on either clinical criteria (i.e., 1 WHO stage III-IV event excluding TB and bacterial infections) or immunologic criteria (i.e., 25% decrease in peak, regimen-specific CD4). All ART strategies included cotrimoxazole prophylaxis. In accordance with WHO guidelines, patients received 960 mg of cotrimoxazole daily (800 mg sulfamethoxazole plus 160 mg trimethoprim).14
Costs are reported in 2006 US$.
Dominated strategies were either more expensive and less effective or less cost-effective, compared to the next least expensive strategy.
In clinical switching strategies, clinical events categorized as “WHO stage III–IV” did not include TB or invasive bacterial diseases unless otherwise specified.
Strategy recommended in current WHO guidelines.4
In strategies labeled “HIV RNA”, failure was defined as a 1-log10 increase in or a return to pre-treatment HIV RNA level.
Table A4.
| Table A4-a. Sensitivity Analysis on CD4 count at Presentation | |||
|---|---|---|---|
| Strategy* | Discounted Life Expectancy (years) | Discounted Lifetime Costs ($)† | ICER ($/years of life gained)‡ |
| CD4 count at Presentation = 100 (SD 25) cells/μL (Base Case = 140 (SD 116) cells/uL) | |||
| Cotrimoxazole only | 1.65 | 900 | -- |
| 1st-line ART plus cotrimoxazole | 9.09 | 4,870 | 530 |
| 1st- & 2nd-line ART plus cotrimoxazole | |||
| 1 WHO stage III-IV event§ | 10.81 | 7,660 | 1,630 |
| 50% decrease in peak CD4¶ | 12.18 | 10,840 | 2,310 |
| HIV RNA (Switch immediately) | 13.32 | 13,600 | 2,420 |
| CD4 count at Presentation = 250 (SD 25) cells/μL (Base Case = 140 (SD 116) cells/uL) | |||
| Cotrimoxazole only | 2.90 | 1,340 | -- |
| 1st-line ART plus cotrimoxazole | 10.64 | 6,510 | 670 |
| 1st- & 2nd-line ART plus cotrimoxazole | |||
| 1 WHO stage III-IV event§ | 12.27 | 9,290 | 1,700 |
| 50% decrease in peak CD4¶ | 13.95 | 12,380 | 1,840 |
| HIV RNA (Switch immediately) | 14.97 | 16,630 | 4,150 |
| CD4 count at Presentation = 425 (SD 25) cells/μL (Base Case = 140 (SD 116) cells/uL) | |||
| Cotrimoxazole only | 4.57 | 1,880 | -- |
| 1st-line ART plus cotrimoxazole | 11.58 | 6,900 | 720 |
| 1st- & 2nd-line ART plus cotrimoxazole | |||
| 1 WHO stage III-IV event§ | 12.94 | 9,270 | 1,740 |
| 50% decrease in peak CD4¶ | 14.48 | 12,270 | 1,950 |
| HIV RNA (Switch immediately) | 15.28 | 16,210 | 4,930 |
|
| |||
| Abbreviations: ICER = incremental cost-effectiveness ratio; ART = antiretroviral therapy; and WHO = World Health Organization. | |||
| * All ART strategies included cotrimoxazole prophylaxis. In accordance with WHO guidelines, patients received 960 mg of cotrimoxazole daily (800 mg sulfamethoxazole plus 160 mg trimethoprim).14 No matter the stage at which patients entered care, patients received antiretroviral therapy in accordance with WHO recommendations.4 | |||
| † Costs are reported in 2006 US$. | |||
| ‡ Dominated strategies were either more expensive and less effective or less cost-effective, compared to the next least expensive strategy. | |||
| § In clinical switching strategies, clinical events categorized as WHO stage III–IV did not include invasive bacterial diseases or tuberculosis. | |||
| ¶ Strategy recommended in current WHO guidelines.4 | |||
| ‖ In strategies labeled “HIV RNA”, failure was defined as a 1-log10 increase in HIV RNA or a return to pre-treatment HIV RNA level. | |||
| Table A4-b. Sensitivity Analysis on ART effectiveness | |||
|---|---|---|---|
| Strategy* | Discounted Life Expectancy (years) | Discounted Lifetime Costs ($)† | ICER ($/years of life gained)‡ |
| 2nd-line ART HIV RNA suppression at 24 weeks = 64.0% (Base Case = 77.0%) | |||
| Cotrimoxazole only | 2.11 | 1,060 | -- |
| 1st-line ART plus cotrimoxazole | 9.39 | 5,290 | 580 |
| 1st- & 2nd-line ART plus cotrimoxazole | |||
| 1 WHO stage III-IV event§ | 10.69 | 7,640 | 1,810 |
| 50% decrease in peak CD4¶ | 11.95 | 10,400 | 2,190 |
| HIV RNA (Switch immediately) | 12.88 | 13,380 | 3,210 |
| 2nd-line ART HIV RNA suppression at 24 weeks = 88.0% (Base Case = 77.0%) | |||
| Cotrimoxazole only | 2.11 | 1,060 | -- |
| 1st-line ART plus cotrimoxazole | 9.40 | 5,290 | 580 |
| 1st- & 2nd-line ART plus cotrimoxazole | |||
| 1 WHO stage III-IV event§ | 11.27 | 8,280 | 1,600 |
| 50% decrease in peak CD4¶ | 12.80 | 11,460 | 2,070 |
| HIV RNA (Switch immediately)¶ | 14.05 | 14,870 | 2,730 |
| Delay in CD4 decline after virologic failure = 6 months (Base Case = 12 months) | |||
| Cotrimoxazole only | 2.11 | 1,060 | -- |
| 1st-line ART plus cotrimoxazole | 9.16 | 5,170 | 580 |
| 1st- & 2nd-line ART plus cotrimoxazole | |||
| 1 WHO stage III-IV event§ | 10.78 | 7,860 | 1,660 |
| 50% decrease in peak CD4¶ | 12.24 | 10,950 | 2,110 |
| HIV RNA (Switch immediately)¶ | 13.24 | 13,870 | 2,920 |
| Delay in CD4 decline after virologic failure = 18 months (Base Case = 12 months) | |||
| Cotrimoxazole only | 2.11 | 1,060 | -- |
| 1st-line ART plus cotrimoxazole | 9.63 | 5,410 | 580 |
| 1st- & 2nd-line ART plus cotrimoxazole | |||
| 1 WHO stage III-IV event§ | 11.23 | 8,100 | 1,680 |
| 50% decrease in peak CD4¶ | 12.57 | 10,990 | 2,150 |
| HIV RNA (Switch immediately) | 13.73 | 14,430 | 2,980 |
|
| |||
| Abbreviations: ART = antiretroviral therapy; ICER = incremental cost-effectiveness ratio; and WHO = World Health Organization. | |||
| * All ART strategies included cotrimoxazole prophylaxis. In accordance with WHO guidelines, patients received 960 mg of cotrimoxazole daily (800 mg sulfamethoxazole plus 160 mg trimethoprim).14 | |||
| † Costs are reported in 2006 US$. | |||
| ‡ Dominated strategies were either more expensive and less effective or less cost-effective, compared to the next least expensive strategy. | |||
| § In clinical switching strategies, clinical events categorized as WHO stage III–IV did not include invasive bacterial diseases or tuberculosis. | |||
| ¶ Strategy recommended in current WHO guidelines.4 | |||
| ‖ In strategies labeled “HIV RNA”, failure was defined as a 1-log10 increase in HIV RNA or a return to pre-treatment HIV RNA level. | |||
| Table A4-c. Sensitivity Analysis on Monitoring Frequency | |||
|---|---|---|---|
| Strategy* | Discounted Life Expectancy (years) | Discounted Lifetime Costs ($)† | ICER ($/years of life gained)‡ |
| Monitor CD4 count every 12 months (Base Case = every 6 months) | |||
| Cotrimoxazole only | 2.11 | 1,060 | -- |
| 1st-line ART plus cotrimoxazole | 9.39 | 5,290 | 580 |
| 1st- & 2nd-line ART plus cotrimoxazole | |||
| 1 WHO stage III-IV event§ | 11.01 | 7,990 | 1,670 |
| 50% decrease in peak CD4¶ | 11.79 | 9,670 | 2,150 |
| HIV RNA (Switch immediately) | 13.52 | 14,190 | 2,610 |
| Monitor HIV RNA every 12 months (Base Case = every 6 months) | |||
| Cotrimoxazole only | 2.11 | 1,060 | -- |
| 1st-line ART plus cotrimoxazole | 9.39 | 5,290 | 580 |
| 1st- & 2nd-line ART plus cotrimoxazole | |||
| 1 WHO stage III-IV event§ | 11.01 | 7,990 | 1,670 |
| 50% decrease in peak CD4¶ | 12.42 | 10,980 | dominated |
| HIV RNA (Switch immediately) | 13.36 | 12,860 | 2,010 |
Abbreviations: ICER = incremental cost-effectiveness ratio; ART = antiretroviral therapy; and WHO = World Health Organization.
All ART strategies included cotrimoxazole prophylaxis. In accordance with WHO guidelines, patients received 960 mg of cotrimoxazole daily (800 mg sulfamethoxazole plus 160 mg trimethoprim).14
Costs are reported in 2006 US$.
Dominated strategies were either more expensive and less effective or less cost-effective, compared to the next least expensive strategy.
In clinical switching strategies, clinical events categorized as WHO stage III–IV did not include bacterial infections or tuberculosis.
Strategy recommended in current WHO guidelines.4
In strategies labeled “HIV RNA”, failure was defined as a 1-log10 increase in HIV RNA or a return to pre-treatment HIV RNA level.
Figure A1. Percent time on antiretroviral therapy, by virologic suppression status and type of monitoring strategy.

This figure depicts the percent of undiscounted life expectancy on 1st- and 2nd-line ART, by virologic suppression status and type of monitoring. Each bar reflects a representative clinical (failure criterion: 1 WHO stage III-IV event, excluding tuberculosis and invasive bacterial diseases), immunologic (failure criterion: 50% decrease in peak on-treatment CD4), or virologic (failure criterion: 1 log10 increase in or return to pre-treatment HIV RNA level, immediate switch) monitoring strategy. Time on suppressed and virologically failed 1st-line ART is shown dark red (
 ) and dark purple (
 ), respectively. Time on suppressed and virologically failed 2nd-line ART is shown in lighter red (
 ) and lighter purple (
 ), respectively. Detecting ART failure earlier — as occurs when using HIV RNA monitoring — resulted in a shorter duration on virologically failed 1st-line ART and longer total duration on 2nd-line ART. ART: antiretroviral therapy.
Figure A2. 20-year survival, by type of monitoring strategy.

This figure depicts time (x-axis) and survivorship (y-axis) for a treatment-eligible cohort entering care with mean CD4 140 cells/μL (standard deviation 116 cells/μL) for patients relying on clinical- (small dashed line), CD4- (solid line), or HIV RNA- (large dashed line) based switching strategies. Median survivals, indicated by the dotted line, were 12.79, 16.13, and 18.96 years, respectively. At approximately 2 years, the proportion of the initial cohort surviving and receiving HIV RNA monitoring began to diverge from the proportion of the cohort surviving and receiving clinical and CD4 count monitoring. By 5 years, the proportion of the initial cohort surviving and receiving CD4 count monitoring diverged from the proportion of the initial cohort surviving and receiving clinical monitoring.
- 1.Kuritzkes DR. Preventing and managing antiretroviral drug resistance. AIDS Patient Care STDS. 2004 May;18(5):259–273. doi: 10.1089/108729104323076007. [DOI] [PubMed] [Google Scholar]
- 2.Goetz MB, Ferguson MR, Han X, et al. Evolution of HIV resistance mutations in patients maintained on a stable treatment regimen after virologic failure. J Acquir Immune Defic Syndr. 2006 Dec 15;43(5):541–549. doi: 10.1097/01.qai.0000245882.28391.0c. [DOI] [PMC free article] [PubMed] [Google Scholar]
- 3.Lee KJ, Dunn D, Porter K, et al. Treatment switches after viral rebound in HIV-infected adults starting antiretroviral therapy: multicentre cohort study. AIDS. 2008 Oct 1;22(15):1943–1950. doi: 10.1097/QAD.0b013e32830e4cf3. [DOI] [PubMed] [Google Scholar]
- 4.World Health Organization. Geneva: World Health Organization; 2006. [Accessed November 3, 2008]. Antiretroviral therapy for HIV Infection in adults and adolescents in resource-limited settings: towards universal access. Recommendations for a public health approach. 2006 revision. http://www.who.int/hiv/pub/guidelines/WHO%20Adult%20ART%20Guidelines.pdf. [Google Scholar]
- 5.Delfraissy JF, Flandre P, Delaugerre C, et al. Lopinavir/ritonavir monotherapy or plus zidovudine and lamivudine in antiretroviral-naive HIV-infected patients. AIDS. 2008 Jan 30;22(3):385–393. doi: 10.1097/QAD.0b013e3282f3f16d. [DOI] [PubMed] [Google Scholar]
- 6.Johnson M, Grinsztejn B, Rodriguez C, et al. Atazanavir plus ritonavir or saquinavir, and lopinavir/ritonavir in patients experiencing multiple virological failures. AIDS. 2005 Apr 29;19(7):685–694. doi: 10.1097/01.aids.0000166091.39317.99. [DOI] [PubMed] [Google Scholar]
- 7.Marconi VC, Sunpath H, Lu Z, et al. Prevalence of HIV-1 drug resistance after failure of a first highly active antiretroviral therapy regimen in KwaZulu Natal, South Africa. Clin Infect Dis. 2008 May 15;46(10):1589–1597. doi: 10.1086/587109. [DOI] [PMC free article] [PubMed] [Google Scholar]
- 8.Mellors JW, Muñoz A, Giorgi JV, et al. Plasma viral load and CD4+ lymphocytes as prognostic markers of HIV-1 infection. Ann Intern Med. 1997 Jun 15;126(12):946–954. doi: 10.7326/0003-4819-126-12-199706150-00003. [DOI] [PubMed] [Google Scholar]
- 9.Minga A, Danel C, Abo Y, et al. Progression to WHO criteria for antiretroviral therapy in a 7-year cohort of adult HIV-1 seroconverters in Abidjan, Cote d'Ivoire. Bull World Health Organ. 2007 Feb;85(2):116–123. doi: 10.2471/BLT.06.032292. [DOI] [PMC free article] [PubMed] [Google Scholar]
- 10.Seyler C, Messou E, Gabillard D, Inwoley A, Alioum A, Anglaret X. Morbidity before and after HAART initiation in Sub-Saharan African HIV-infected adults: a recurrent event analysis. AIDS Res Hum Retroviruses. 2007 Nov;23(11):1338–1347. doi: 10.1089/aid.2006.0308. [DOI] [PubMed] [Google Scholar]
- 11.Anglaret X, Chene G, Attia A, et al. Early chemoprophylaxis with trimethoprim-sulphamethoxazole for HIV-1-infected adults in Abidjan, Cote d'Ivoire: a randomised trial. Cotrimo-CI Study Group. Lancet. 1999 May 1;353(9163):1463–1468. doi: 10.1016/s0140-6736(98)07399-1. [DOI] [PubMed] [Google Scholar]
- 12.Yazdanpanah Y, Losina E, Anglaret X, et al. Clinical impact and cost-effectiveness of co-trimoxazole prophylaxis in patients with HIV/AIDS in Cote d'Ivoire: a trial-based analysis. AIDS. 2005 Aug 12;19(12):1299–1308. doi: 10.1097/01.aids.0000180101.80888.c6. [DOI] [PubMed] [Google Scholar]
- 13.Médecins Sans Frontières. Untangling the web of price reductions: a pricing guide for the purchase of ARVs for developing countries. [Accessed October 25, 2008];2008 July; http://www.accessmed-msf.org/fileadmin/user_upload/diseases/hiv-aids/Untangling_the_Web/Untanglingtheweb_July2008_English.pdf.
- 14.World Health Organization. Guidelines on co-trimoxazole prophylaxis for HIV-related infections among children, adolescents and adults: recommendations for a public health approach. [Accessed November 3, 2008];2006 http://www.who.int/hiv/pub/guidelines/ctxguidelines.pdf.
Footnotes
Preliminary results for this manuscript were presented in part at the XVII International AIDS Conference, Mexico City, Mexico, August 3–8, 2008.
References
- 1.UNAIDS. 2008 Report on the global AIDS epidemic. Geneva: UNAIDS; 2008. [Google Scholar]
- 2.Médecins Sans Frontières. Untangling the web of price reductions: a pricing guide for the purchase of ARVs for developing countries. [Accessed October 25, 2008];2008 11th: http://www.accessmed-msf.org/fileadmin/user_upload/diseases/hiv-aids/Untangling_the_Web/Untanglingtheweb_July2008_English.pdf.
- 3.World Health Organization. Treating 3 million by 2005: Making it happen. The WHO strategy: the WHO and UNAIDS global initiative to provide antiretroviral therapy to 3 million people with HIV/AIDS in developing countries by the end of 2005. world wide web. [Accessed April 6, 2008];2003 http://www.who.int/3by5/publications/documents/isbn9241591129/en/index.html.
- 4.World Health Organization. Antiretroviral therapy for HIV Infection in adults and adolescents in resource-limited settings: towards universal access. Recommendations for a public health approach. 2006 revision. Geneva: World Health Organization; 2006. [Google Scholar]
- 5.Phillips AN, Pillay D, Miners AH, Bennett DE, Gilks CF, Lundgren JD. Outcomes from monitoring of patients on antiretroviral therapy in resource-limited settings with viral load, CD4 cell count, or clinical observation alone: a computer simulation model. Lancet. 2008 Apr 26;371(9622):1443–1451. doi: 10.1016/S0140-6736(08)60624-8. [DOI] [PubMed] [Google Scholar]
- 6.World Health Organization, UNAIDS, UNICEF. Towards universal access: Scaling up priority HIV/AIDS interventions in the health sector. Progress Report 2008. Geneva: World Health Organization; 2008. [Google Scholar]
- 7.WHO Rapid Advice: antiretroviral therapy for HIV infection in adults and adolescents. [30 November 2009]; Accessed: http://www.who.int/hiv/pub/arv/advice/en/index.html.
- 8.Ethiopia, Federal Ministry of Health, Federal HIV/AIDS Prevention and Control Office. Guidelines for Management of Opportunistic Infections and Anti Retroviral Treatment in Adolescents and Adults in Ethiopia. [Accessed October 27, 2009];2007 http://www.aidstar-one.com/sites/default/files/treatment_documents/HIV_treatment_guidelines_ethiopia_2008.pdf.
- 9.Government of India, Ministry of Health & Family Welfare, National AIDS Control Organization (NACO) Antiretroviral Therapy Guidelines for HIV-Infected Adults and Adolescents Including Post-exposure Prophylaxis. [Accessed October 27, 2009];2007 http://upaidscontrol.up.nic.in/Guidelines/Antiretroviral%20Therapy%20Guidelines%20for%20HIV%20infected%20Adults%20an.pdf.
- 10.République de Côte d'Ivoire. Guide de Prise en Charge de l'Infection a VIH/SIDA de l'Adulte et de l'Enfant. [Accessed October 6, 2009];2005 http://www.aidstar-one.com/sites/default/files/treatment_documents/hiv_treatment_guidelines_cote_d_ivoire_2005.pdf.
- 11.Botswana, Ministry of Health, Department of HIV/AIDS Prevention and Care. Botswana National HIV/AIDS Treatment Guidelines: 2008 Version. [Accessed October 27, 2009];2008 http://www.moh.gov.bw/templates/moh/File/BOTSWANA%20HIVAIDS%20TREATMENT%20%20GUIDELINES%20(November%201%202008).pdf.
- 12.Republic of Namibia, Ministry of Health and Social Services, Directorate of Primary Care, National AIDS Coordination Program (NACOP) Guidelines for Anti-Retroviral Therapy. [Accessed October 27, 2009];2003 http://www.aidstar-one.com/sites/default/files/treatment_documents/hiv_treatment_guidelines_namibia_2003.pdf.
- 13.Republic of Uganda. Katabira ET, Kamya MR, Kalyesubula I, Namale A, editors. National Antiretroviral Treatment Guidelines for Adults, Adolescents, and Children. [Accessed October 27, 2009];2008 http://idi.mak.ac.ug/resources/UGANDA-ADULTS_ADOLESCENTS_HIV_THERAPY.pdf.
- 14.The United Republic of Tanzania, Ministry of Health, (NACP) NACP. National Guidelines for the Clinical Management of HIV and AIDS. [Accessed October 27, 2009];2005 http://www.tanzaniahivaids.info/documents/Other%20Resource%20Documents/Tz%20Clinical%20Guidelines%20for%20ART-2005.pdf.
- 15.Zambia, Ministry of Health. Antiretroviral Therapy for Chronic HIV Infection in Adults and Adolescents New ART Protocols. [Accessed October 27, 2009];2007 http://www.nac.org.zm/attachments/063_new_art_protocols_may_2007.pdf.
- 16.Schooley RT. Viral load testing in resource-limited settings. Clin Infect Dis. 2007 Jan 1;44(1):139–140. doi: 10.1086/510090. [DOI] [PubMed] [Google Scholar]
- 17.UNAIDS, WHO, UNICEF. UNAIDS/WHO Epidemiological Fact Sheet on HIV and AIDS, 2008 Update. Côte d'Ivoire. [Accessed March 26, 2009];2008 http://www.who.int/GlobalAtlas/predefinedReports/EFS2008/index.asp.
- 18.World Bank. World Bank List of Economies. 2007. [Accessed August 21, 2008];2007 http://www.worldbank.org.
- 19.Goldie SJ, Yazdanpanah Y, Losina E, et al. Cost-effectiveness of HIV treatment in resource-poor settings--the case of Cote d'Ivoire. N Engl J Med. 2006 Sep 14;355(11):1141–1153. doi: 10.1056/NEJMsa060247. [DOI] [PubMed] [Google Scholar]
- 20.Yazdanpanah Y, Losina E, Anglaret X, et al. Clinical impact and cost-effectiveness of co-trimoxazole prophylaxis in patients with HIV/AIDS in Cote d'Ivoire: a trial-based analysis. AIDS. 2005 Aug 12;19(12):1299–1308. doi: 10.1097/01.aids.0000180101.80888.c6. [DOI] [PubMed] [Google Scholar]
- 21.Walensky RP, Weinstein MC, Yazdanpanah Y, et al. HIV drug resistance surveillance for prioritizing treatment in resource-limited settings. AIDS. 2007 May 11;21(8):973–982. doi: 10.1097/QAD.0b013e328011ec53. [DOI] [PMC free article] [PubMed] [Google Scholar]
- 22.Anglaret X, Chene G, Attia A, et al. Early chemoprophylaxis with trimethoprim-sulphamethoxazole for HIV-1-infected adults in Abidjan, Cote d'Ivoire: a randomised trial. Cotrimo-CI Study Group. Lancet. 1999 May 1;353(9163):1463–1468. doi: 10.1016/s0140-6736(98)07399-1. [DOI] [PubMed] [Google Scholar]
- 23.Minga A, Danel C, Abo Y, et al. Progression to WHO criteria for antiretroviral therapy in a 7-year cohort of adult HIV-1 seroconverters in Abidjan, Cote d'Ivoire. Bull World Health Organ. 2007 Feb;85(2):116–123. doi: 10.2471/BLT.06.032292. [DOI] [PMC free article] [PubMed] [Google Scholar]
- 24.Seyler C, Messou E, Gabillard D, Inwoley A, Alioum A, Anglaret X. Morbidity before and after HAART initiation in Sub-Saharan African HIV-infected adults: a recurrent event analysis. AIDS Res Hum Retroviruses. 2007 Nov;23(11):1338–1347. doi: 10.1089/aid.2006.0308. [DOI] [PubMed] [Google Scholar]
- 25.WHO-CHOICE. Estimates of unit costs for patient services for Côte d'Ivoire. [Accessed November 6, 2008];2008 http://www.who.int/choice/country/civ/cost/en/index.html.
- 26.Gold MR. Cost-effectiveness in health and medicine. New York: Oxford University Press; 1996. [Google Scholar]
- 27.Russell LB, Gold MR, Siegel JE, Daniels N, Weinstein MC. The role of cost-effectiveness analysis in health and medicine. Panel on Cost-Effectiveness in Health and Medicine. JAMA. 1996 Oct 9;276(14):1172–1177. [PubMed] [Google Scholar]
- 28.Siegel JE, Weinstein MC, Russell LB, Gold MR. Recommendations for reporting cost-effectiveness analyses. Panel on Cost-Effectiveness in Health and Medicine. JAMA. 1996 Oct 23-30;276(16):1339–1341. doi: 10.1001/jama.276.16.1339. [DOI] [PubMed] [Google Scholar]
- 29.Weinstein MC, Siegel JE, Gold MR, Kamlet MS, Russell LB. Recommendations of the Panel on Cost-effectiveness in Health and Medicine. JAMA. 1996 Oct 16;276(15):1253–1258. [PubMed] [Google Scholar]
- 30.Freedberg KA, Kumarasamy N, Losina E, et al. Clinical impact and cost-effectiveness of antiretroviral therapy in India: starting criteria and second-line therapy. AIDS. 2007 Jul;21 4:S117–128. doi: 10.1097/01.aids.0000279714.60935.a2. [DOI] [PMC free article] [PubMed] [Google Scholar]
- 31.Walensky RP, Wood R, Weinstein MC, et al. Scaling up antiretroviral therapy in South Africa: the impact of speed on survival. J Infect Dis. 2008 May 1;197(9):1324–1332. doi: 10.1086/587184. [DOI] [PMC free article] [PubMed] [Google Scholar]
- 32.Wolf LL, Ricketts P, Freedberg KA, et al. The cost-effectiveness of antiretroviral therapy for treating HIV disease in the Caribbean. J Acquir Immune Defic Syndr. 2007 Dec 1;46(4):463–471. doi: 10.1097/qai.0b013e3181594c38. [DOI] [PMC free article] [PubMed] [Google Scholar]
- 33.Mellors JW, Muñoz A, Giorgi JV, et al. Plasma viral load and CD4+ lymphocytes as prognostic markers of HIV-1 infection. Ann Intern Med. 1997 Jun 15;126(12):946–954. doi: 10.7326/0003-4819-126-12-199706150-00003. [DOI] [PubMed] [Google Scholar]
- 34.Multicenter AIDS Cohort Study. Public use dataset: Release P04. National Technical Information Service; 1995. [Google Scholar]
- 35.World Health Organization. Guidelines on co-trimoxazole prophylaxis for HIV-related infections among children, adolescents and adults: recommendations for a public health approach. [Accessed November 3, 2008];2006 http://www.who.int/hiv/pub/guidelines/ctxguidelines.pdf.
- 36.Deeks SG, Barbour JD, Martin JN, Swanson MS, Grant RM. Sustained CD4+ T cell response after virologic failure of protease inhibitor-based regimens in patients with human immunodeficiency virus infection. J Infect Dis. 2000 Mar;181(3):946–953. doi: 10.1086/315334. [DOI] [PubMed] [Google Scholar]
- 37.Cole SR, Hernan MA, Robins JM, et al. Effect of highly active antiretroviral therapy on time to acquired immunodeficiency syndrome or death using marginal structural models. Am J Epidemiol. 2003 Oct 1;158(7):687–694. doi: 10.1093/aje/kwg206. [DOI] [PubMed] [Google Scholar]
- 38.Losina E, Yazdanpanah Y, Deuffic-Burban S, et al. The independent effect of highly active antiretroviral therapy on severe opportunistic disease incidence and mortality in HIV-infected adults in Cote d'Ivoire. Antivir Ther. 2007;12(4):543–551. [PMC free article] [PubMed] [Google Scholar]
- 39.Kuritzkes DR. Preventing and managing antiretroviral drug resistance. AIDS Patient Care STDS. 2004 May;18(5):259–273. doi: 10.1089/108729104323076007. [DOI] [PubMed] [Google Scholar]
- 40.Goetz MB, Ferguson MR, Han X, et al. Evolution of HIV resistance mutations in patients maintained on a stable treatment regimen after virologic failure. J Acquir Immune Defic Syndr. 2006 Dec 15;43(5):541–549. doi: 10.1097/01.qai.0000245882.28391.0c. [DOI] [PMC free article] [PubMed] [Google Scholar]
- 41.Lee KJ, Dunn D, Porter K, et al. Treatment switches after viral rebound in HIV-infected adults starting antiretroviral therapy: multicentre cohort study. AIDS. 2008 Oct 1;22(15):1943–1950. doi: 10.1097/QAD.0b013e32830e4cf3. [DOI] [PubMed] [Google Scholar]
- 42.Petersen ML, van der Laan MJ, Napravnik S, Eron JJ, Moore RD, Deeks SG. Long-term consequences of the delay between virologic failure of highly active antiretroviral therapy and regimen modification. AIDS. 2008 Oct 18;22(16):2097–2106. doi: 10.1097/QAD.0b013e32830f97e2. [DOI] [PMC free article] [PubMed] [Google Scholar]
- 43.Seyler C, Anglaret X, Dakoury-Dogbo N, et al. Medium-term survival, morbidity and immunovirological evolution in HIV-infected adults receiving antiretroviral therapy, Abidjan, Cote d'Ivoire. Antivir Ther. 2003 Oct;8(5):385–393. [PubMed] [Google Scholar]
- 44.Toure S, Kouadio B, Seyler C, et al. Rapid scaling-up of antiretroviral therapy in 10,000 adults in Cote d'Ivoire: 2-year outcomes and determinants. AIDS. 2008 Apr 23;22(7):873–882. doi: 10.1097/QAD.0b013e3282f768f8. [DOI] [PMC free article] [PubMed] [Google Scholar]
- 45.El-Sadr WM, Lundgren JD, Neaton JD, et al. CD4+ count-guided interruption of antiretroviral treatment. N Engl J Med. 2006 Nov 30;355(22):2283–2296. doi: 10.1056/NEJMoa062360. [DOI] [PubMed] [Google Scholar]
- 46.Lopez AD World Health Organization. World mortality in 2000 : life tables for 191 countries. Geneva, Switzerland: World Health Organization; 2002. [Google Scholar]
- 47.Delfraissy JF, Flandre P, Delaugerre C, et al. Lopinavir/ritonavir monotherapy or plus zidovudine and lamivudine in antiretroviral-naive HIV-infected patients. AIDS. 2008 Jan 30;22(3):385–393. doi: 10.1097/QAD.0b013e3282f3f16d. [DOI] [PubMed] [Google Scholar]
- 48.Danel C, Moh R, Anzian A, et al. Tolerance and acceptability of an efavirenz-based regimen in 740 adults (predominantly women) in West Africa. J Acquir Immune Defic Syndr. 2006 May;42(1):29–35. doi: 10.1097/01.qai.0000219777.04927.50. [DOI] [PubMed] [Google Scholar]
- 49.Johnson M, Grinsztejn B, Rodriguez C, et al. Atazanavir plus ritonavir or saquinavir, and lopinavir/ritonavir in patients experiencing multiple virological failures. AIDS. 2005 Apr 29;19(7):685–694. doi: 10.1097/01.aids.0000166091.39317.99. [DOI] [PubMed] [Google Scholar]
- 50.Marconi VC, Sunpath H, Lu Z, et al. Prevalence of HIV-1 drug resistance after failure of a first highly active antiretroviral therapy regimen in KwaZulu Natal, South Africa. Clin Infect Dis. 2008 May 15;46(10):1589–1597. doi: 10.1086/587109. [DOI] [PMC free article] [PubMed] [Google Scholar]
- 51.Sources and prices of selected medicines and diagnostics for people living with HIV/AIDS. A joint UNICEF, UNAIDS, WHO, MSF project. world wide web] [Accessed April 6, 2009];2005 6th: http://mednet2.who.int/sourcesprices/sources.pdf.
- 52.Edejer TTT World Health Organization. Making choices in health : WHO guide to cost-effectiveness analysis. Geneva: World Health Organization; 2003. [Google Scholar]
- 53.Clinton Foundation. Clinton Foundation HIV/AIDS Initiative Antiretroviral (ARV) Price List. [Accessed October 27, 2009];2009 http://www.clintonfoundation.org/files/chaiarvpricelistaugust2009english.pdf Published August 2009.
- 54.Commission on Macroeconomics and Health. Macroeconomics and health: investing in health for economic development. Geneva: World Health Organization; 2001. [Google Scholar]
- 55.Murray CJ, Lauer JA, Hutubessy RC, et al. Effectiveness and costs of interventions to lower systolic blood pressure and cholesterol: a global and regional analysis on reduction of cardiovascular-disease risk. Lancet. 2003 Mar 1;361(9359):717–725. doi: 10.1016/S0140-6736(03)12655-4. [DOI] [PubMed] [Google Scholar]
- 56.Central Intelligence Agency. The World Factbook. [Accessed March 26, 2009];2008 https://www.cia.gov/library/publications/the-world-factbook.
- 57.International Monetary Fund. The World Economic Outlook Database, October 2008. [Accessed March 26, 2009];2008 http://imf.org.
- 58.World Bank. Word Development Indicators 2008. [Accessed March 26, 2009];2008 http://www.worldbank.org.
- 59.Calmy A, Ford N, Hirschel B, et al. HIV viral load monitoring in resource-limited regions: optional or necessary? Clin Infect Dis. 2007 Jan 1;44(1):128–134. doi: 10.1086/510073. [DOI] [PubMed] [Google Scholar]
- 60.Bendavid E. Monitoring of antiretroviral therapy in low-resource settings. Lancet. 2008 Jul 26;372(9635):288–289. doi: 10.1016/S0140-6736(08)61103-4. author reply 289. [DOI] [PubMed] [Google Scholar]
- 61.Bishai D, Colchero A, Durack DT. The cost effectiveness of antiretroviral treatment strategies in resource-limited settings. AIDS. 2007 Jun 19;21(10):1333–1340. doi: 10.1097/QAD.0b013e328137709e. [DOI] [PubMed] [Google Scholar]
- 62.Lawn SD, Bekker LG, Calmy A, Wood R. Monitoring of antiretroviral therapy in low-resource settings. Lancet. 2008 Jul 26;372(9635):287–288. doi: 10.1016/S0140-6736(08)61101-0. author reply 289. [DOI] [PubMed] [Google Scholar]
- 63.Walensky RP, Freedberg KA, Weinstein MC. Monitoring of antiretroviral therapy in low-resource settings. Lancet. 2008 Jul 26;372(9635):288. doi: 10.1016/S0140-6736(08)61102-2. author reply 289. [DOI] [PubMed] [Google Scholar]
- 64.Bendavid E, Young SD, Katzenstein DA, Bayoumi AM, Sanders GD, Owens DK. Cost-effectiveness of HIV monitoring strategies in resource-limited settings: a southern African analysis. Arch Intern Med. 2008 Sep 22;168(17):1910–1918. doi: 10.1001/archinternmed.2008.1. [DOI] [PMC free article] [PubMed] [Google Scholar]
- 65.Moore DM, Mermin J. Monitoring antiretroviral failure in resource-poor settings. Lancet. 2008 Apr 26;371(9622):1396–1397. doi: 10.1016/S0140-6736(08)60607-8. [DOI] [PubMed] [Google Scholar]
- 66.Vijayaraghavan A, Efrusy MB, Mazonson PD, Ebrahim O, Sanne IM, Santas CC. Cost-effectiveness of alternative strategies for initiating and monitoring highly active antiretroviral therapy in the developing world. J Acquir Immune Defic Syndr. 2007 Sep 1;46(1):91–100. doi: 10.1097/QAI.0b013e3181342564. [DOI] [PubMed] [Google Scholar]
- 67.Hallett TB, Gregson S, Dube S, Garnett GP. The impact of monitoring HIV patients prior to treatment in resource-poor settings: insights from mathematical modelling. PLoS Med. 2008 Mar 11;5(3):e53. doi: 10.1371/journal.pmed.0050053. [DOI] [PMC free article] [PubMed] [Google Scholar]
- 68.Bartlett JA, DeMasi R, Dawson D, Hill A. Variability in repeated consecutive measurements of plasma human immunodeficiency virus RNA in persons receiving stable nucleoside reverse transcriptase inhibitor therapy or no treatment. J Infect Dis. 1998 Dec;178(6):1803–1805. doi: 10.1086/314503. [DOI] [PubMed] [Google Scholar]
- 69.Lathey JL, Hughes MD, Fiscus SA, et al. Variability and prognostic values of virologic and CD4 cell measures in human immunodeficiency virus type 1-infected patients with 200-500 CD4 cells/mm(3) (ACTG 175). AIDS Clinical Trials Group Protocol 175 Team. J Infect Dis. 1998 Mar;177(3):617–624. doi: 10.1086/514250. [DOI] [PubMed] [Google Scholar]
- 70.Glencross DK, Aggett HM, Stevens WS, Mandy F. African regional external quality assessment for CD4 T-cell enumeration: development, outcomes, and performance of laboratories. Cytometry B Clin Cytom. 2008;74 1:S69–79. doi: 10.1002/cyto.b.20397. [DOI] [PubMed] [Google Scholar]
- 71.Reynolds SJ, Nakigozi G, Newell K, et al. Failure of immunologic criteria to appropriately identify antiretroviral treatment failure in Uganda. AIDS. 2009 Mar 27;23(6):697–700. doi: 10.1097/QAD.0b013e3283262a78. [DOI] [PMC free article] [PubMed] [Google Scholar]
- 72.Moore DM, Awor A, Downing R, et al. CD4+ T-cell count monitoring does not accurately identify HIV-infected adults with virologic failure receiving antiretroviral therapy. J Acquir Immune Defic Syndr. 2008 Dec 15;49(5):477–484. doi: 10.1097/QAI.0b013e318186eb18. [DOI] [PubMed] [Google Scholar]