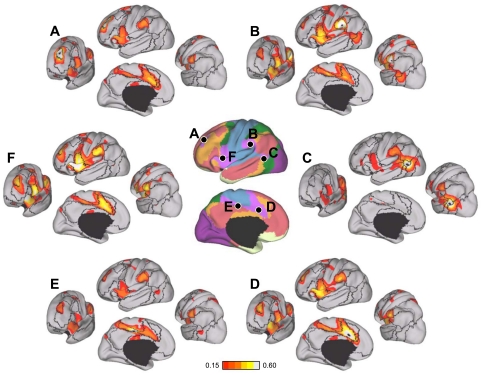
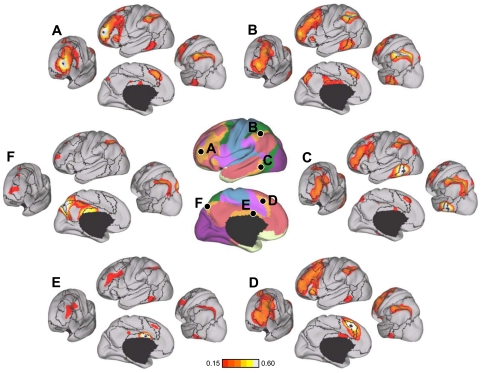
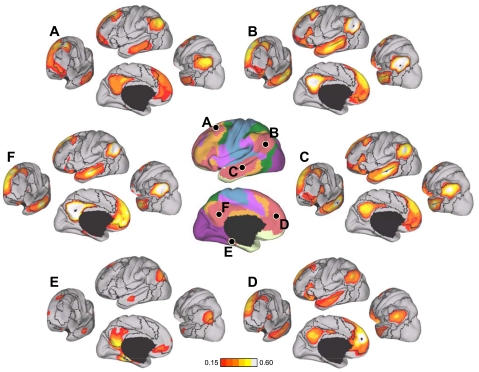
Abstract
Information processing in the cerebral cortex involves interactions among distributed areas. Anatomical connectivity suggests that certain areas form local hierarchical relations such as within the visual system. Other connectivity patterns, particularly among association areas, suggest the presence of large-scale circuits without clear hierarchical relations. In this study the organization of networks in the human cerebrum was explored using resting-state functional connectivity MRI. Data from 1,000 subjects were registered using surface-based alignment. A clustering approach was employed to identify and replicate networks of functionally coupled regions across the cerebral cortex. The results revealed local networks confined to sensory and motor cortices as well as distributed networks of association regions. Within the sensory and motor cortices, functional connectivity followed topographic representations across adjacent areas. In association cortex, the connectivity patterns often showed abrupt transitions between network boundaries. Focused analyses were performed to better understand properties of network connectivity. A canonical sensory-motor pathway involving primary visual area, putative middle temporal area complex (MT+), lateral intraparietal area, and frontal eye field was analyzed to explore how interactions might arise within and between networks. Results showed that adjacent regions of the MT+ complex demonstrate differential connectivity consistent with a hierarchical pathway that spans networks. The functional connectivity of parietal and prefrontal association cortices was next explored. Distinct connectivity profiles of neighboring regions suggest they participate in distributed networks that, while showing evidence for interactions, are embedded within largely parallel, interdigitated circuits. We conclude by discussing the organization of these large-scale cerebral networks in relation to monkey anatomy and their potential evolutionary expansion in humans to support cognition.
Keywords: prefrontal, parietal, association cortex, functional magnetic resonance imaging, functional connectivity, default network, connectome
complex behaviors are subserved by distributed systems of brain areas (Felleman and Van Essen 1991; Goldman-Rakic 1988; Mesulam 1990). The organization of these systems can be studied in nonhuman animals by using invasive techniques including histology, anatomical tract tracing, electrophysiology, and lesion methods. The organization of brain systems in the human has been inferred by comparing cytoarchitectonically defined homologies between species and by noting similarities in neuropsychological deficits following accidental brain injury to deficits present in animal ablation studies. General agreement has emerged from these comparisons that the basic organization of brain systems is similar across mammalian species. However, there is also evidence that the human cerebral cortex, particularly association cortex, is not simply a scaled version of other species.
The German anatomist Korbinian Brodmann (1909) first emphasized that areas comprising the human inferior parietal lobule do not have clear homologs in the monkey, an observation that continues to motivate contemporary debates (Orban et al. 2004). Gross differences are also observed in the human brain when it is compared to those of our evolutionarily closest relatives. For example, the human brain is triple the size of modern great ape brains, but motor and visual cortices are about the same absolute size (Blinkov and Glezer 1968; Frahm et al. 1984). This observation suggests that expansion of the human cerebrum disproportionately involves areas beyond those subserving basic sensory and motor functions. In a recent analysis of cortical expansion based on 23 homologous areas between the macaque and human, Van Essen and colleagues noted that the greatest growth occurs in regions distributed across frontal, parietal, and temporal association cortices (Van Essen and Dierker 2007; Hill et al. 2010). Preuss (2004) came to a similar conclusion in a detailed review of comparative anatomy. Thus, in addition to expecting the human brain to show broadly similar organizational properties with other well-studied species, expansion and perhaps elaboration of association networks is also expected.
In this article we report results of a comprehensive analysis of networks within the human cerebral cortex using intrinsic functional connectivity MRI (fcMRI). The analysis was based on 1,000 young adults who contributed uniformly collected MRI data. The data were brought into a common surface coordinate system to help preserve the surface topology of the cortical mantle. Analyses were motivated by two goals. First, we sought to provide reference maps that are a current best estimate of the organization of the human cerebral cortex as measured by functional connectivity. Second, we wanted to better understand how patterns of functional connectivity might give rise to the organizational properties that underlie distributed brain systems. Particular focus was placed on parietal and frontal association cortices. The foundations for the present work come from traditional anatomical studies of cortical organization.
Organizational Properties of the Cerebral Cortex in the Nonhuman Primate
Distributed brain systems are organized to facilitate both serial and parallel processing (Felleman and Van Essen 1991; Mesulam 1998). The concept of serial hierarchies is embedded within early ideas about brain organization. For example, William James (1890) proposed that principles governing the reflex arc extend to the cerebral hemispheres. He hypothesized that excitement of sensory systems propagates upwards from lower to higher cerebral centers governing “ideas” and then to centers producing (or inhibiting) movements. Hubel and Wiesel (1962) formally proposed the concept of serial processing across a hierarchy in cat visual cortex based on their observations of increasingly complex receptive field properties from the lateral geniculate nucleus (LGN) to the simple and complex cells of the primary visual cortex (V1). Based on studies of corticocortical connections in the macaque, Pandya and Kuypers (1969) and Jones and Powell (1970) suggested that hierarchical processing across sensory systems converges on transmodal association areas.
The discovery of widespread connections among multiple cortical areas, as well as extensive feedback projections from higher to lower sensory areas, suggested strictly serial processing is not the only organizational scheme in the cerebral cortex. Instead, it was proposed that hierarchical processing exists in a distributed fashion that can be inferred from the laminar distribution of anatomical connectivity (Friedman 1983; Maunsell and Van Essen 1983; Rockland and Pandya 1979). The comprehensive meta-analysis of corticocortical connections in the macaque monkey by Felleman and Van Essen (1991) provided strong evidence that unimodal and heteromodal areas in both the visual and somatomotor systems are organized into separate distributed hierarchies (also see Ungerleider and Desimone 1986; Van Essen et al. 1992). Some projections between areas are organized as feedforward (ascending) projections, others as feedback (descending) projections, and still others as lateral projections. For example, consistent with serial processing, the primary visual area (V1) sends forward connections to and receives feedback connections from V2 in a topographic fashion that connects the corresponding receptive field representation in each area. In contrast to strictly serial processing, these unimodal sensory cortical areas (V1 and V2) both project to higher sensory areas. Lateral projections between areas are also common [e.g., central inferior temporal area (CIT) and posterior superior temporal polysensory area (STPp)].
It becomes considerably more difficult to make inferences about the organization of circuits involving association cortex. Historically, of the four criteria (function, cytoarchitecture, connectivity, and topography) used to define cortical areas and thereby constrain models of organization, topography (e.g., retinotopy) and function are difficult to discern in heteromodal association areas. Cytoarchitecture and connectivity thus become especially valuable for inferring brain circuit organization beyond the sensory and motor systems. However, as noted by Felleman and Van Essen (1991), the number of violated constraints to hierarchical connectivity increases in the progression from early sensory cortex up to association cortex (red lines near the top of the visual hierarchy in Fig. 4 of Felleman and Van Essen 1991).
Fig. 4.
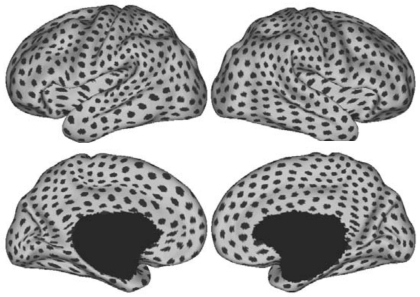
Cortical regions utilized in constructing functional connectivity profiles. A total of 1,175 regions were sampled uniformly on the surface-based representations of the left and right hemispheres within the FreeSurfer surface coordinate system and are shown in Caret PALS space, where each dark patch represents the location of a single regional vertex. Each vertex in the surface coordinate system is characterized by its profile of functional connectivity to the 1,175 regions. The visually nonuniform distribution of the regions in Caret PALS space is due to the nonlinear deformation from FreeSurfer space to Caret PALS space. This image thus also serves to illustrate the subtle differences between the 2 surface coordinate systems.
This raises the interesting possibility that the association areas may not follow as rigid a hierarchical organization as canonical sensory and motor areas. Violations of strict hierarchical arrangements are apparent in the visual system as noted above, but violations and alternative connectivity patterns become common in association areas. For example, paired tracer injections in association areas 7a and 46 lead to interdigitating columnar patterns of terminations in some areas and complementary (feedforward and feedback) patterns in other areas (Selemon and Goldman-Rakic 1988).
While recognizing that convergence and integration of pathways occur in the association cortex, Goldman-Rakic (1988) emphasized that primate association cortex is organized into parallel distributed networks (see also Mesulam 1981). There are two key features to her proposed organization that depart from hierarchical organizational models. First, each distributed network consists of association areas spanning frontal, parietal, temporal, and cingulate cortices. Networks are densely interconnected such that two areas in the parietal and frontal cortices belonging to the same network are not just anatomically connected to each other, but they are also both connected with other components of the same network (Selemon and Goldman-Rakic 1988). Second, multiple distributed networks exist adjacent to each other: adjacent areas in the parietal cortex belonging to separate networks are differentially connected to adjacent areas of corresponding networks in the frontal, temporal, and cingulate cortices (Cavada and Goldman-Rakic 1989a, 1989b).
The possibility of parallel distributed circuits is an important consideration in our analysis of fcMRI networks in the human, particularly within association cortices. An intriguing possibility is that the majority of the human cerebral cortex involves multiple parallel circuits that are interdigitated throughout association cortex such that each cortical lobe contains components of multiple association networks. That is, the expansion of the cerebral association cortex in humans relative to that in the monkey may preferentially involve networks organized in the form outlined by Goldman-Rakic (1988) and anticipated by others (e.g., Mesulam 1981). To explore this possibility, our analyses focus on evidence for hierarchical relations across regions as well as evidence for distributed networks that are interdigitated throughout association cortex.
Insights Into the Organization of the Cerebral Cortex Revealed Through Neuroimaging
Noninvasive neuroimaging methods including positron emission tomography (PET; Raichle 1987) and functional MRI (fMRI; Kwong et al. 1992; Ogawa et al. 1992) allow functional response properties to be measured in the human cerebral cortex. The measures are indirect, reflecting blood flow and oxygenation changes that are coupled to neural activity through incompletely understood mechanisms (Logothetis 2008), and the methods are presently limited to a spatial resolution of a few millimeters (e.g., Engel et al. 1997). Neuroimaging approaches have nonetheless been extremely valuable for providing insights into cortical organization. In some cases it has been possible to directly map the topography within (and borders between) cortical areas (Engel et al. 1994; Sereno et al. 1995). More generally, differential response properties between regions are the source of information about cortical mapping. For example, the increase in the complexity of receptive field properties measured from primary to secondary sensory areas in visual (Wandell et al. 2007), somatosensory (Iwamura 1998), and auditory cortices (Wessinger et al. 2001) suggest that serial hierarchical processing exists in human sensory cortex.
Neuroimaging studies of a wide range of cognitive tasks reveal simultaneous activation in multiple regions in the parietal, frontal, temporal, and cingulate cortices, suggesting distributed systems of brain areas are involved in cognition. However, it is difficult to assess the organization of these distributed systems based solely on task activity because these cognitive tasks likely tap into multiple, overlapping processes, some of which reflect the operation of distributed systems and others which reflect distinct processing demands of the tasks (see Mesulam 1990 and Posner et al. 1988 for relevant discussion). For these reasons, methods that can measure connectivity may provide novel insights into the organization of distributed brain systems.
Functional Connectivity and Diffusion MRI Provide Tools to Explore Cortical Organization
Diffusion MRI (dMRI) and fcMRI have recently emerged as promising tools for mapping the connectivity of the human brain, each with distinct strengths and weaknesses. dMRI measures the diffusion of water, thus allowing direct noninvasive mapping of white matter pathways (Basser et al. 1994). However, dMRI is presently limited to resolving major fiber tracts. By contrast, fcMRI measures intrinsic functional correlations between brain regions (Biswal et al. 1995) and is sensitive to coupling between distributed as well as adjacent brain areas (e.g., see Sepulcre et al. 2010 for discussion). Although not a direct measure of anatomical connectivity, the functional couplings detected by fcMRI are sufficiently constrained by anatomy to provide insights into properties of circuit organization (for reviews, see Fox and Raichle 2007; Van Dijk et al. 2010). When describing these correlations, we use the term functional connectivity as coined by Karl Friston (1994) to denote “temporal correlations between remote neurophysiological events” for which the causal relation is undetermined.
There are important limitations of fcMRI, including sensitivity to indirect anatomical connectivity and functional coupling that changes in response to recent experience and the current task being engaged (Buckner 2010). For these reasons, some discussions of fcMRI have emphasized that intrinsic activity measured by fcMRI reflects the prior history of activity through brain systems and not simply static anatomical connectivity (Power et al. 2010). fcMRI also does not presently provide information about whether connections are feedforward (ascending) or feedback (descending). These limitations constrain how analyses are conducted and results can be interpreted.
Directly relevant to the present study, prior investigations using fcMRI provide estimates of large-scale cortical networks that have generally (but not in all details) converged across a variety of analytic approaches, including seed-based fcMRI (Biswal et al. 1995), independent component analysis (Beckmann and Smith 2004; Smith et al. 2009), clustering (Bellec et al. 2010; Golland et al. 2007), and graph theory (Dosenbach et al. 2007). Because of uncertainties regarding their relation to underlying anatomical brain systems, networks identified using fcMRI have often been labeled on the basis of their relations to task-based functional networks. Some of these networks, such as the default network (Greicius et al. 2003) and dorsal attention system (Fox et al. 2006), have been proposed to be related to anatomical tracing and task-based fMRI in the macaque (Buckner et al. 2008; Saleem et al. 2008; Vincent et al. 2007).
Motivated by the usefulness of connectivity in establishing the organization of the cerebral cortex in nonhuman primates, this study analyzed fcMRI data from 1,000 subjects with two main goals. First, the analyses sought to provide reference maps that are a current best estimate of the organization of human cortical networks as measured by functional connectivity. Second, by using the power of a large data sample to quantitatively measure functional connectivity strength among many regions, the study explored the patterns of corticocortical functional coupling that give rise to these networks.
METHODS
Overview
The present study explored the organization of large-scale distributed networks in the human cerebral cortex using resting-state fcMRI. The main analyses were based on a core dataset of 1,000 healthy, young adults whose fMRI data were acquired using the same MRI sequence on the same hardware (3-Tesla field strength, 12-channel receive coil array). For several analyses the data were divided into discovery (n = 500) and replication (n = 500) data samples to test for reliability and for unbiased quantification of functional connectivity patterns. Additional supplementary datasets were used to address specific questions that arose during analysis. A first supplementary fMRI data set (n = 16) contrasted different passive tasks engaged during resting-state functional data acquisition. A second supplementary fMRI data set (n = 4) consisted of data acquired during visual stimulation optimized to define retinotopic boundaries of early visual areas (Hinds et al. 2009; Polimeni et al. 2005). A final supplementary data set used human histological data to define a range of cytoarchitectonic areas including human V1 (Amunts et al. 2000, Fischl et al. 2008) and the putative homolog to macaque middle temporal area complex (MT+; Malikovic et al. 2007, Yeo et al. 2010b). All data (fMRI and histological) were brought into a common surface coordinate system based on the cortical surface as reconstructed from each participant's structural anatomy. Data analyses began by examining broad properties of cortical network organization and progressed to quantify the detailed patterns of functional connectivity within and between networks.
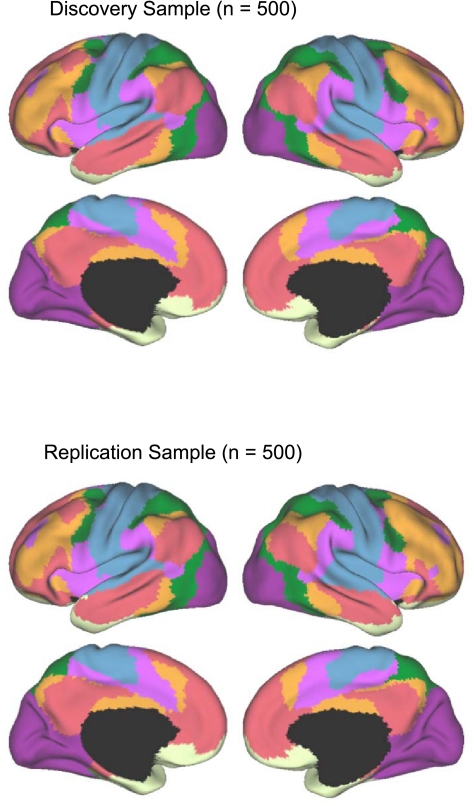
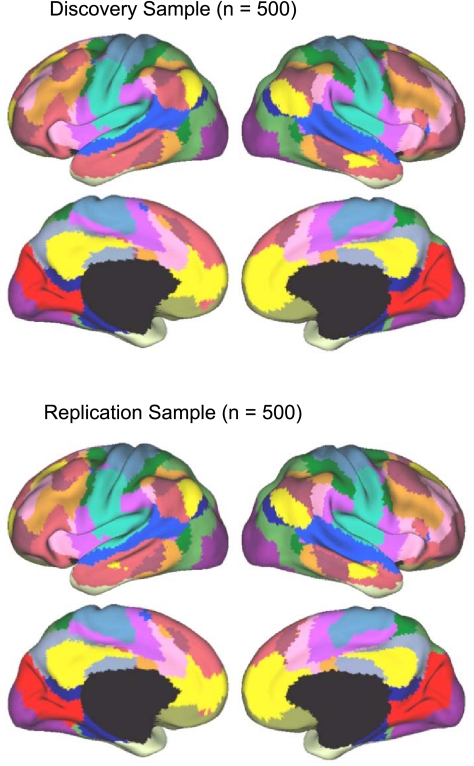
In the first set of analyses, a clustering algorithm was used to parcellate the cerebral cortex into networks of functionally coupled regions. Parcellations were examined for a coarse solution that organized the cortex into 7 networks as well as a finer solution that identified 17 networks. As the results reveal, the estimated networks were consistent across the discovery and replication data samples and were confirmed by region-based fcMRI analyses. The full data set was used to construct a best-estimate parcellation of the human cerebral cortex to serve as a reference for future studies.
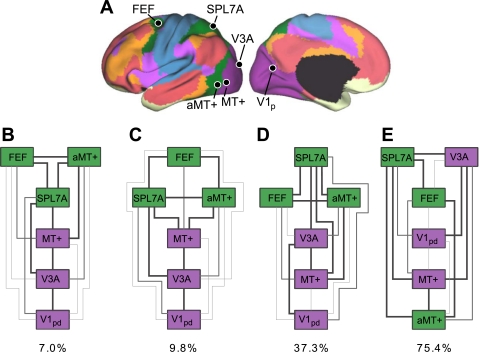
The second set of analyses explored the coupling of regions that fell within sensory and motor pathways. Since these areas are relatively well understood in both humans and macaques, they provide the opportunity to evaluate the utility and limitations of functional connectivity methods. Analyses examined quantitative coupling properties between individual regions that were within the same network as well as coupling properties between networks focusing on a sensory-motor pathway that is the putative homologue of the well-studied system in the monkey involving MT+, parietal regions at or near lateral intraparietal area (LIP), and premotor regions at or near frontal eye field (FEF).
The final set of analyses characterized the organization of distributed networks in higher order association cortex. The connectivity patterns of regions within frontal and parietal association cortices were quantified. These analyses involved constructing a series of small seed regions across frontal and parietal cortices and examining functional connectivity strength to multiple regions distributed throughout the cerebral cortex, allowing the “fingerprint” of functional coupling to be identified for each region. For these analyses, regions were always defined in the discovery data sample or some other source, such as histology, and functional connectivity was quantified in the independent replication data sample.
Participants
Paid participants were clinically healthy, native English-speaking young adults with normal or corrected-to-normal vision (ages 18–35 yr). Subjects were excluded if their fMRI signal-to-noise ratio (SNR) was low (<100; see below), artifacts were detected in the MR data, their self-reported health information indicated the presence of any prior neurological or psychiatric condition, or they were taking any psychoactive medications. The core data set consisted of 1,000 individuals imaged during eyes open rest (EOR) and was divided into two independent samples (each n = 500; labeled the discovery and replication samples). Age and sex were matched for the discovery (mean age = 21.3 yr, 42.6% male) and replication (mean age = 21.3 yr, 42.8% male) data sets. These data are new data presented for the first time in this study and were acquired as part of a collaborative effort across multiple local laboratories all acquiring data on matched MRI scanners (at Harvard and at the Massachusetts General Hospital). Participants provided written informed consent in accordance with guidelines set by institutional review boards of Harvard University or Partners Healthcare.
Two smaller supplementary data sets were also analyzed. The task effect data set (n = 16, mean age = 21.1 yr, 25.0% male) consisted of fMRI data collected under different passive conditions (eyes closed rest, ECR; EOR; and fixation, FIX) and was analyzed previously (Van Dijk et al. 2010). The visuotopic dataset (n = 4; mean age = 34.5 yr, 100% male) consisted of previously published visuotopic data (Hinds et al. 2009; Polimeni et al. 2005).
MRI Data Acquisition
All data were collected on matched 3T Tim Trio scanners (Siemens, Erlangen, Germany) using a 12-channel phased-array head coil, except for the visuotopic data set, which was acquired on a custom-built 4-channel phased-array surface coil. A software upgrade (VB15 to VB17) occurred on all scanners during the study. Validation studies that acquired structural and functional data on the same individuals before and after the upgrade could not detect an effect of the upgrade. The functional imaging data were acquired using a gradient-echo echo-planar imaging (EPI) sequence sensitive to blood oxygenation level-dependent (BOLD) contrast. Whole brain coverage including the entire cerebellum was achieved with slices aligned to the anterior commissure-posterior commissure plane using an automated alignment procedure, ensuring consistency among subjects (van der Kouwe et al. 2005). Structural data included a high-resolution multiecho T1-weighted magnetization-prepared gradient-echo image (multiecho MP-RAGE; van der Kouwe et al. 2008).
For the core data set, subjects were instructed to remain still, stay awake, and keep their eyes open. EPI parameters were as follows: repetition time (TR) = 3,000 ms, echo time (TE) = 30 ms, flip angle (FA) = 85°, 3 × 3 × 3-mm voxels, field of view (FOV) = 216, and 47 axial slices collected with interleaved acquisition and no gap between slices. Each functional run lasted 6.2 min (124 time points). One or two runs were acquired per subject (average of 1.7 runs). Parameters for the structural scan (multiecho MP-RAGE; van der Kouwe et al. 2008) were as follows: TR = 2,200 ms, inversion time (TI) = 1,100 ms, TE = 1.54 ms for image 1 to 7.01 ms for image 4, FA = 7°, 1.2 × 1.2 × 1.2-mm voxels, and FOV = 230. The multiecho MP-RAGE allows increased contrast through weighted averaging of the four derived images.
For the task effect data set, subjects were instructed to remain still with their eyes open (EOR; 2 runs) or closed (ECR; 2 runs) or to passively fixate a centrally presented crosshair (FIX; 2 runs). For details, see Van Dijk et al. (2010). The order of rest conditions was counterbalanced across subjects. EPI parameters were as follows: TR = 3,000 ms; TE = 30 ms; FA = 90°; 3 × 3 × 3-mm voxels; FOV = 288, and 43 slices collected with interleaved acquisition and no gap between slices. Each functional run lasted 5.20 min (104 time points). Parameters for structural scans (MP-RAGE) were as follows: TR = 2,530 ms, TI = 1,100 ms, TE = 3.44 ms, FA = 7°, 1 × 1 × 1-mm voxels, and FOV = 256.
The visuotopic data set was collected using a custom-built four-channel phased-array surface coil placed at the back of the head. During each functional run, subjects were presented with one of four visual stimuli: a clockwise rotating wedge, a counterclockwise rotating wedge, an expanding ring, or a contracting ring (DeYoe et al. 1996; Engel et al. 1994; Sereno et al. 1995). Because the four-channel surface coil provided only partial brain coverage, structural data for these four subjects were collected separately on a 1.5T Allegra scanner (Siemens). Further details of the acquisition and data processing protocol can be found elsewhere (Hinds et al. 2009; Polimeni et al. 2005).
Except where noted, the description of data processing and analysis below applies to the whole brain data (the core data set of 1,000 subjects and the task effect data set) and not the visuotopic data.
Functional MRI Data Preprocessing
The fMRI data were preprocessed with a series of steps common to fMRI analyses. Preprocessing involved 1) discarding the first four volumes of each run to allow for T1-equilibration effects, 2) compensating for slice acquisition-dependent time shifts per volume with SPM2 (Wellcome Department of Cognitive Neurology, London, UK), and 3) correcting for head motion using rigid body translation and rotation with the FSL package (Jenkinson et al. 2002; Smith et al. 2004).
The data underwent further processing using procedures adapted from Biswal et al. (1995) and optimized for fcMRI analysis (Fox et al. 2005; Van Dijk et al. 2010; Vincent et al. 2006). Briefly, constant offset and linear trend over each run were removed and a temporal filter was applied to retain frequencies below 0.08 Hz. Sources of spurious variance, along with their temporal derivatives, were removed through linear regression, including 1) six parameters obtained by correction for rigid body head motion, 2) the signal averaged over the whole brain, 3) the signal averaged over the ventricles, and 4) the signal averaged over the deep cerebral white matter. This regression procedure minimized signal contributions of nonneuronal origin, including respiration-induced signal fluctuations (Van Dijk et al. 2010). Unlike previously established fcMRI preprocessing procedures, no spatial smoothing of the resting-state data occurred up to this point of the preprocessing stream.
Structural MRI Data Preprocessing and Functional-Structural Data Alignment
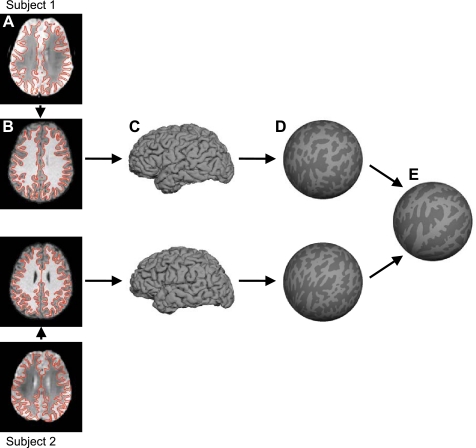
The structural data were processed using the FreeSurfer (http://surfer.nmr.mgh.harvard.edu) version 4.5.0 software package. FreeSurfer constitutes a suite of automated algorithms for reconstructing accurate surface mesh representations of the cortex from individual subjects' T1 images (Fig. 1, B and C) and the overlay of fMRI on the surfaces for group analysis (Fig. 1E). Briefly, the cortical surface extraction process (Fig. 1, B and C) involved 1) correcting for intensity variations due to MR inhomogeneities (Dale et al. 1999), 2) removing extracerebral voxels through “skull-stripping” (Ségonne et al. 2004), 3) segmenting cortical gray and white matter voxels based on the intensity difference and geometric structure of the gray-white interface (Dale et al. 1999), 4) computing cutting planes to disconnect the two hemispheres and subcortical structures (Dale et al. 1999), 5) filling the interior holes of the segmentation using a connected-component analysis (Dale et al. 1999), 6) tessellating a triangular mesh over the gray-white boundary of each hemispheric volume and deforming the mesh to produce a smooth representation of the gray-white interface and pial surface (Dale et al. 1999), and 7) correcting topological defects in the surface so that the mesh achieves a spherical topology (Fischl et al. 2001; Ségonne et al. 2007).
Fig. 1.
Surface coordinate system for functional magnetic resonance imaging (fMRI) analysis. For each subject, the T2* images yielding blood oxygenation level-dependent (BOLD) contrast fMRI data (A) were registered to the T1-weighted structural data (B). The cortical gray-white and pial surfaces were estimated from the structural data. The red lines show the estimated gray-white surface (A and B). Pial surface is shown in C. The gray-white surface was inflated into a sphere (D). The inflated spheres were then aligned across subjects using surface-based registration of the cortical folding pattern, resulting in a common spherical coordinate system (E). BOLD data of individual subjects (A) can then be projected onto the spherical coordinate system (E) in a single transformation step to reduce artifacts due to multiple interpolations.
After segmentation of the cortical surface, spatial correspondences among the subjects' cortical folding patterns were established via the use of a spherical coordinate system (Fig. 1, D and E). Briefly, the process involved 1) inflating each subject's surface mesh into a sphere while minimizing geometric distortion of the original cortical surface as measured by geodesic distances among surface vertices and ensuring the inflation constituted a one-to-one mapping, and 2) computing a smooth, invertible deformation of the resulting spherical mesh to a common spherical coordinate system that aligned the cortical folding patterns across subjects (Fischl et al. 1999a, 1999b).
Once the common spherical coordinate system was established, the structural and functional images were aligned (Fig. 1, A and B) using boundary-based registration (Greve and Fischl 2009) that is provided as part of FreeSurfer's companion package, FsFast (http://surfer.nmr.mgh.harvard.edu/fswiki/FsFast). The preprocessed resting-state fMRI data were then propagated to the common spherical coordinate system via sampling from the middle of the cortical ribbon in a single interpolation step (Fig. 1, A–E). The choice of sampling fMRI data from the middle of the cortical ribbon was motivated by the desire to reduce the blurring of fMRI signal across sulci or gyri and also by a recent study on the point-spread function of fMRI (Polimeni et al. 2010). The study showed that large draining vessels on the pial surface increased BOLD signal close to the pial surface but reduced spatial specificity of the hemodynamic response. Sampling fMRI data from the middle of the cortical ribbon therefore represented a trade-off between spatial specificity and signal sensitivity. Since our fMRI voxels were relatively large (3 mm), we were not as concerned about laminar bias in the functional connectivity analysis.
The cerebral cortex is a thin sheet, with common organizational features along its radial axis. Along the dimensions parallel to this sheet is a mosaic of cortical areas that differ in function, cytoarchitecture, connectivity, and topography (Felleman and Van Essen 1991; Kaas 1987). The spherical representation of the cortex therefore affords a more accurate alignment of the cortical folding pattern and has the consequence of improving cytoarchitectonic (Fischl et al. 2008; Hinds et al. 2008; Yeo et al. 2010a) and functional (Fischl et al. 1999b; Van Essen 2005) correspondences across subjects compared with three-dimensional volumetric registration, even though cortical folds do not completely predict cytoarchitecture or function (Rajkowska and Goldman-Rakic 1995; Thirion et al. 2007; Yeo et al. 2010b). The acquisition resolution and inherent limitations of the BOLD signal also provided restrictions on achievable resolution.
A 6-mm full-width half-maximum (FWHM) smoothing kernel was applied to the fMRI data in the surface space, and the data were downsampled to a 4-mm mesh.1 Smoothing after the fMRI data were projected onto the surface helped to minimize the blurring of fMRI signal across sulci or gyri. Since our algorithms are not perfectly accurate, any registration or segmentation errors will likely cause blurring of fMRI signal across sulci or gyri. Consequently, we did not expect to eliminate the blurring issues completely, which is important to keep in mind when interpreting the results. The steps taken could only minimize the problem.
The processing of the visuotopic data set was broadly similar except that older versions of FreeSurfer and FsFast were used for the processing, so manual interventions were required to correct the T2* to T1 registration. Details of the processing can be found elsewhere (Hinds et al. 2009; Polimeni et al. 2005).
Quality Control
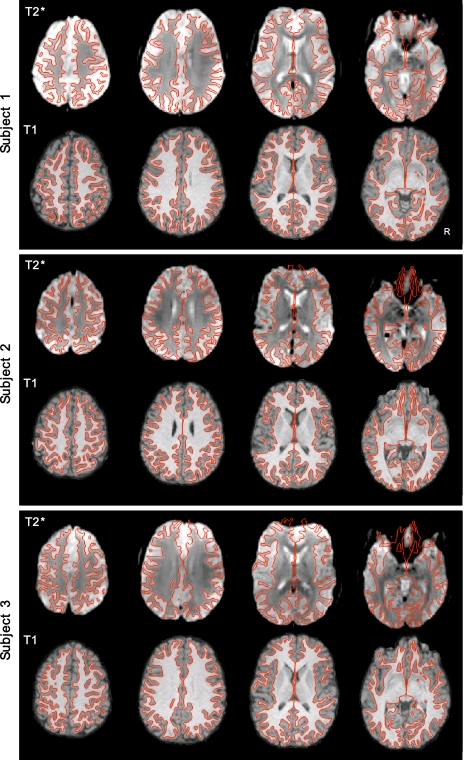
Visual inspection of the registered data suggested that accurate representation of the cortical surface was extracted for each subject and that structural and functional image registration was successful. Figure 2 shows the results of cortical surface extraction from the T1 images and T2* to T1 registration of three randomly chosen subjects. These examples represent typical subjects. Note that functional data distortion remains in areas prone to susceptibility artifacts, including anterior prefrontal regions, regions near lateral temporal cortex, and orbital frontal cortex.
Fig. 2.
Examples of intrasubject surface extraction and registration of structural-functional images. Examples of extracted cortical gray-white surfaces (red lines) are overlaid on T2* and T1 images of 3 random subjects in their native T1 space. Imperfections are apparent in BOLD data, especially in regions of susceptibility artifact (e.g., orbital frontal cortex).
Visualization
Although all subsequent analyses were performed in FreeSurfer surface space, for the purpose of visualization, all maps were transformed and displayed on the inflated PALS cortical surfaces using Caret software (Van Essen 2004, 2005; Van Essen and Dierker 2007). In addition, this study also transformed and visualized the estimated networks in FMRIB Software Library (FSL) MNI152 space (Smith et al. 2004). The mapping between FSL MNI152 volumetric space and FreeSurfer surface space is detailed in our companion study (Buckner et al., in press).
SNR Maps
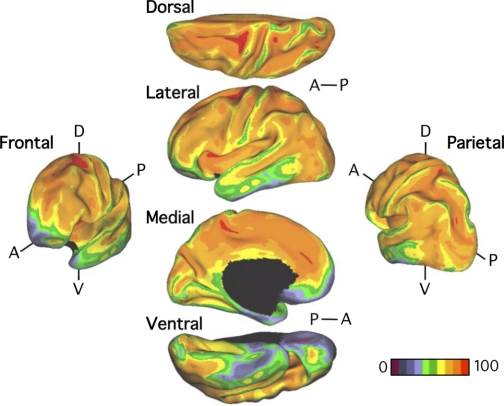
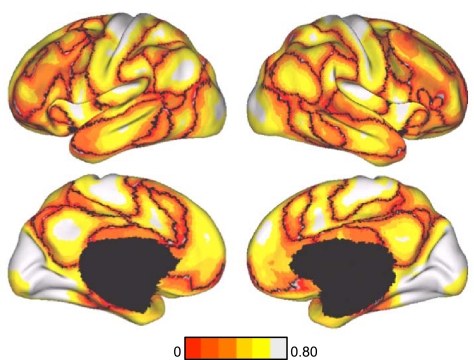
Signal loss and distortion (susceptibility artifacts) occur as a result of magnetic field inhomogeneities. Field inhomogeneities are particularly pronounced in regions where the brain is adjacent to air, causing signal loss and distortion in T2*-dependent (BOLD) images (Ojemann et al. 1997). To estimate the effects of susceptibility artifacts in the present data, we computed the SNR of the motion-corrected fMRI time series for each voxel in subjects' native volumetric space by averaging the signal intensity across the whole run and dividing it by the standard deviation over time. SNR was also used as exclusionary criteria. If the SNR for the whole brain (mean SNR over all voxels within the brain mask) was <100 for an fMRI run, the subject was excluded. Thus all 1,000 subjects contributed data with SNR > 100 for each fMRI run. For subjects with two runs, the SNR was averaged across the runs. The SNR was then projected to FreeSurfer surface space, averaged across the 1,000 subjects from the core data set, and displayed in Caret PALS space (Fig. 3). As expected, low SNR is present in the anterior portion of the inferior and medial temporal lobe, as well as in the orbital frontal cortex. There is also clear spatial variation in the SNR across the cortical mantle, which is important to keep in mind when interpreting the results, such as the absence of a cortical region of low SNR from a network.
Fig. 3.
Signal-to-noise ratio (SNR) maps of the functional data from the full sample (N = 1,000). The mean estimate of the BOLD fMRI data SNR is illustrated for multiple views of the left hemisphere in Caret PALS space. A, anterior; P, posterior; D, dorsal; V, ventral.
Clustering
We applied a clustering approach to define the boundaries of functionally distinct cortical regions and their relations to regions distributed throughout the cerebral cortex (forming networks). Distinguishing neighboring cortical regions by their pattern of connectivity has a long history in both nonhuman primate (e.g., Cavada and Goldman-Rakic 1989a; Goldman-Rakic 1988; Passingham et al. 2002) and human research (e.g., Cohen et al. 2008; Johansen-Berg et al. 2004; Nelson et al. 2010). We began our analyses by defining cortical networks to be sets of cortical regions with similar profiles of corticocortical functional connectivity. The idea follows the empirical finding that in primates, regions of association cortex that are anatomically connected tend to have similar patterns of anatomical connectivity to other cortical and subcortical regions, thus forming a densely connected distributed network (Goldman-Rakic 1988). Note that this assumption about the organizational properties of corticocortical connectivity is probably neither a characteristic of all cortical regions nor a full characterization of the connectivity pattern of any cortical region. As will be shown, the procedure identified functionally coupled networks that could be verified with seed-based regional analyses that made no assumptions about the connectivity patterns.
For this initial analysis, we defined the connectivity profile of a cortical region to be its functional coupling to 1,175 region of interest (ROI) vertices. The 1,175 ROI vertices were uniformly sampled in FreeSurfer surface space (shown in Caret PALS space in Fig. 4) and consisted of single vertices spaced about 16 mm apart. For each subject, we computed the Pearson's product moment correlation between the fMRI time series at each spatial location (18,715 vertices) and the 1,175 ROI vertices. Each spatial location is therefore characterized by its functional coupling to the 1,175 ROI vertices. We binarized the 18,715 × 1,175 matrix of correlations for each subject by keeping the top 10% of the correlations and averaged the binarized matrices independently across each group of 500 subjects in the discovery and replication samples. If a subject had two runs, we averaged the correlation matrices across the two runs before binarization. Binarization of the correlation matrix leads to significantly better clustering results, although the algorithm appears robust to the particular choice of threshold. Visual inspection of the connectivity profiles (not shown) suggested that the 1,175 ROI vertices were sufficiently dense to capture spatial variation in corticocortical connectivity given the limits of our acquisition procedures.
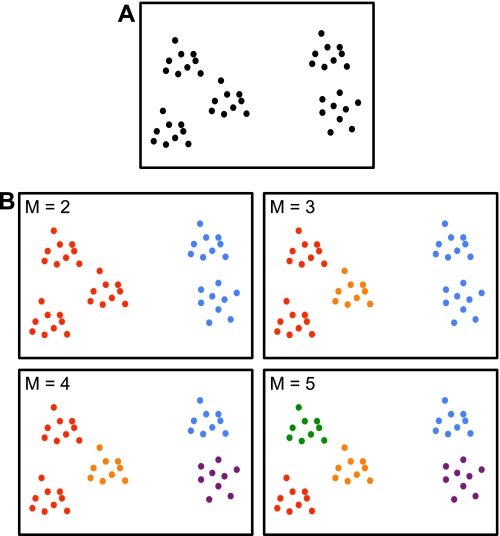
A clustering algorithm was then applied separately to the discovery and replication samples to estimate networks of cortical regions with similar connectivity profiles. The two independent data sets thus allowed exploration of the reliability of estimated networks. The idea behind clustering can be illustrated with a toy example. Figure 5A shows hypothetical points scattered in a structured fashion on a two-dimensional canvas. Clustering aims to recover this structure by dividing the points into different groups so that points within a group are physically close, as shown in Fig. 5B.
Fig. 5.
Toy example illustrating clustering. A: hypothetical points are scattered in a structured fashion on a 2-dimensional canvas. Clustering aims to recover the underlying structure. B: example solutions for M = 2, 3, 4, or 5 clusters are shown. The solutions for M = 2 or 5 clusters agree with visual assessment of the underlying structure and are therefore useful representations. On the other hand, seeking 3 or 4 clusters does not lead to satisfying solutions because solutions are ambiguous. For example, the M = 3 solution is not unique in the sense that an “equally good” alternate solution is for one group of points in the red cluster to be grouped with the orange cluster. Seeking M = 3 or 4 clusters is therefore unstable in the sense that different random initializations of the clustering algorithm lead to different “equally good” solutions. In the present study we employed a stability analysis to estimate the numbers of clusters and also examined both a relatively coarse solution (7 networks) and a fine-resolution solution (17 networks) to survey the solution space broadly (see Fig. 6).
The clustering algorithm employed in this study modeled the data with a von Mises-Fisher distribution (Lashkari et al. 2010). More specifically, the data were modeled as 18,715 points on an 1,174-dimensional unit hypersphere embedded in an 1,175-dimensional Euclidean space, where distances between points were measured by their geodesic distance on the hypersphere. Like the toy example, clustering aims to group vertices that are close together in this non-Euclidean canvas (i.e., have similar connectivity profiles) into the same cluster or network. Measuring distances between points by their geodesic distance is equivalent to defining the similarity between two correlation profiles to be the correlation between the correlation profiles. By using correlation as a measure of similarity, differences in correlation strength were normalized among points so that regions are clustered together based on their connectivity profiles (rather than their strengths of connectivity). In theory, this should mitigate some of the effects of spatial variation in SNR (Fig. 3).
The algorithm operated by randomly assigning the 18,715 points to different groups and then iteratively reassigning the group memberships of points to maximize the agreement of connectivity profiles among points of the same group. More details of the clustering algorithm can be found elsewhere (Lashkari et al. 2010).
Stability Analysis
A drawback of most clustering approaches is that one must choose the number of clusters a priori. In this instance the question is, how many clusters (cerebral networks) are needed to correctly parcellate the cortex? We do not have an answer to this question or know if there is a single correct answer given that the cerebral cortex possesses complex patterns of diverging and converging connections among areas. As such, none of our conclusions will depend on a strong assumption that there is a single correct solution to parcellating the cortex. Nonetheless, we sought a principled approach to identify parcellation solutions that captured significant portions of the correlation structure among cortical regions.
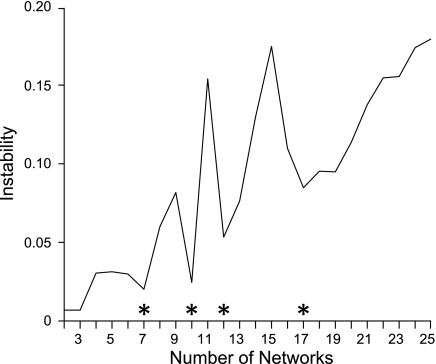
One popular method for estimating the number of clusters is by analyzing the stability of the clustering algorithm (Ben-Hur et al. 2002; Lange et al. 2004; also see Fig. 5). We employed two variations of the stability analysis on the full set of 1,000 subjects. Both variations estimated the same numbers of clusters. The first variation involved (repeatedly and randomly) dividing the ROIs into two groups and measuring the reproducibility of the clustering algorithm's results when applied separately to the two groups of ROIs. The second variation involved (repeatedly and randomly) dividing the 18,715 vertices into two groups and applying the clustering algorithm separately to the two groups of vertices. The model parameters learned from clustering one group of vertices were then used to predict the clustering results of the second group of vertices. The agreement between the prediction and clustering results of the second group measured the generalization power of the clustering results (Fig. 6). Further details of the stability analysis can be found elsewhere (Lange et al. 2004).
Fig. 6.
Seven and 17 networks can be stably estimated. Instability of the clustering algorithm is plotted as a function of the number of estimated networks for the vertex-resampling variant of the stability analysis applied to 1,000 subjects. The clustering algorithm is less stable with increasing number of estimated networks, which is an expected property, since the number of estimated networks enlarges the solution space (and thus complexity) of the clustering problem. The local minima of the graphs (marked with asterisks) indicate the number of networks that can be stably estimated by the clustering algorithm. The stability analysis suggests that 7, 10, 12, or 17 networks can be stably estimated. Resampling the regions of interest yields almost identical results and is not shown. In this study we focus on the 7- and 17-network estimates to provide a broad survey of the solution space.
The stability analyses (Fig. 6) suggested 7 and 17 networks were appropriate starting points for parcellating the cortex. As the results reveal, these parcellation solutions were excellent for capturing significant components of the regional variation that could be replicated across data sets and independently revealed by seed-based analyses. However, the focus on 7- and 17-network solutions should not be taken to imply that meaningful properties are absent in alternative parcellation schemes. By focusing on both a relatively coarse solution (7 networks) and a fine-resolution solution (17 networks), we were able to survey the solution space broadly.
Parcellation Maps
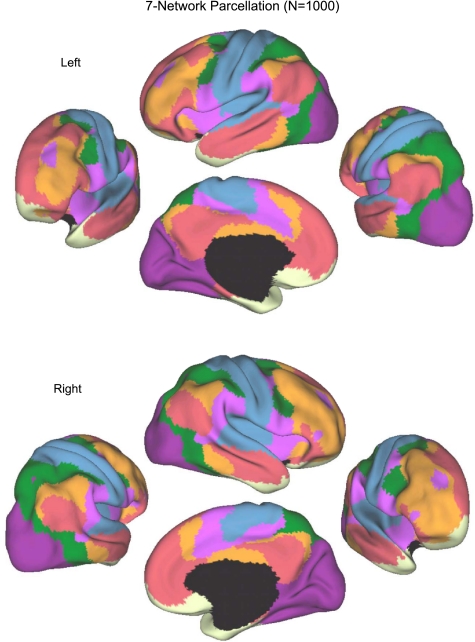
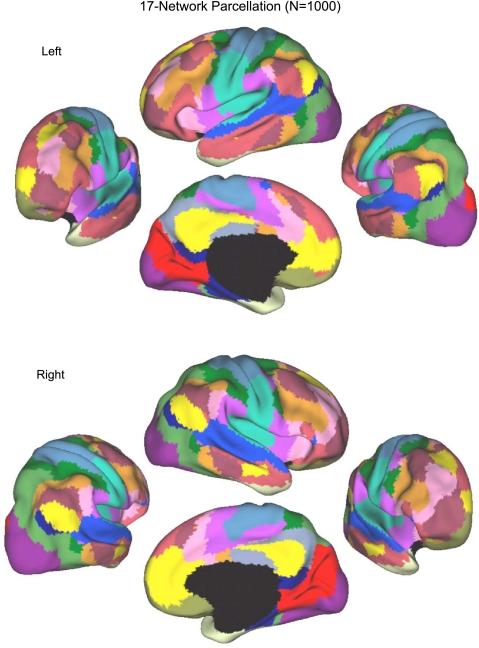
Parcellation maps of the cerebral cortex were generated for both 7-network and 17-network solutions for the discovery sample and replicated in the replication sample. The reliability analysis was conducted to illustrate the stability of the topographic boundaries on which the solutions converged. In this regard, a powerful feature of analyzing large data samples is that the analyses are able to detect the presence of stable cerebral networks and also to establish the boundaries of regions with a high degree of confidence, including contiguous regions that may be part of distinct networks. As a final step, the full sample (N = 1,000) was used to compute parcellations that represent our best estimates of the networks (see Figs. 11 and 13).
Fig. 11.
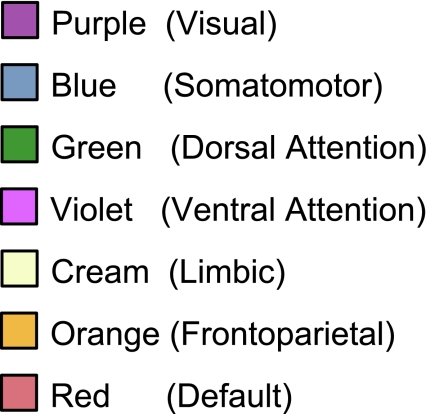
A coarse (7-network) parcellation of the human cerebral cortex based on 1,000 subjects. To provide the best estimates of the 7 cortical networks, clustering was performed on the fMRI data of the full 1,000 subjects. A salient feature is the separation of the early sensory and late motor cortices (blue and purple) from the association cortex. The association networks converged and extended on networks previously described in the resting-state literature, including the dorsal attention, ventral attention, frontoparietal control, and default networks.
Fig. 13.
A fine-resolution (17-network) parcellation of the human cerebral cortex based on 1,000 subjects. To provide the best estimates of the 17 cortical networks, clustering was performed on the fMRI data of the full 1,000 subjects. The 17-network estimate fractionated the 7-network into smaller networks. Some aspects of the fractionations have been previously noted in other studies.
Confidence Maps
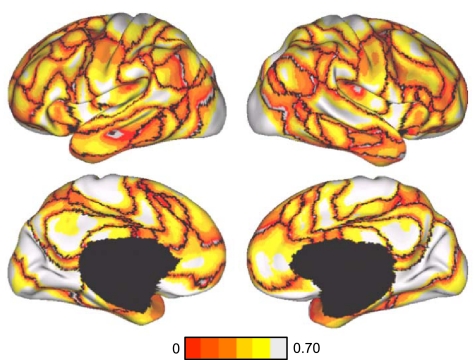
A useful visualization of the cortical parcellation is to look at the confidence of each spatial location belonging to its assigned network. We used the silhouette measure (Rousseeuw 1987) from the clustering literature for this purpose (see Figs. 8 and 10). The silhouette of a data point (spatial location in our case) measures the similarity (correlation in our case) of the data point to other data points of the same cluster (network in our case) compared with data points belonging to the next closest cluster. The resulting silhouette at each spatial location lies between −1 and 1 so that a larger value indicates higher confidence of the spatial location in belonging to its assigned network. A negative value indicates that the connectivity profile at the spatial location is on average closer to the next closest cluster than to its assigned cluster. A negative value is therefore unlikely but is still possible because the clustering cost function is not equivalent to the silhouette measure.
Fig. 8.
Confidence of the 7-network estimate in the discovery data set. Confidence (silhouette) value for each vertex with respect to its assigned network is shown for the discovery data set. Regions close to the boundaries between networks were less confident of their assignment, although we also observed structured spatial variation within individual components of the estimated networks, such as lateral prefrontal cortex, which foreshadows its division in the 17-network estimate (see Fig. 9).
Fig. 10.
Confidence of 17-network estimate in the discovery data set. Confidence (silhouette) value for each vertex with respect to its assigned network is shown for the discovery data set. Again, regions close to the boundaries between networks were less confident of their assignment.
Correlation Maps and Correlations Between Regions
Large-scale cortical networks can be reliably estimated. To better understand the meaning of the networks resolved by the clustering technique, we followed up all salient results with focused analyses using seed-based regional analysis. The coordinates for all seed regions used in these analyses can be found in Tables 1–5. For these analyses, group-averaged functional connectivity maps were used to inspect the validity of clustering results and to visualize differences in connectivity patterns of regions in sensory and association cortices.
Table 1.
Locations of visual cortex seed regions
| Seed Region | Coordinates | Confidence | Literature |
|---|---|---|---|
| V3pv | −12, −67, −3 | 0.74 | Rottschy et al. 2007; Wilms et al. 2010 |
| ExP | −3, −74, 23 | 0.81 | |
| V1p | −16, −74, 7 | 0.78 | Amunts et al. 2000; Fischl et al. 2008 |
| V3cv | −23, −91, −15 | 0.67 | Rottschy et al. 2007; Wilms et al. 2010 |
| ExC | −32, −89, −1 | 0.75 | |
| V1c | −13, −100, −8 | 0.48 | Amunts et al. 2000; Fischl et al. 2008 |
V1c and V1p seed regions are selected from the central and peripheral regions of V1, respectively. V3cv and V3pv seed regions are selected from the central and peripheral regions at or near V3v, respectively. ExC and ExP are selected from the extrastriate visual cortex in the estimated locations of the central and peripheral fields, respectively. The confidence of the seeds in their network assignment was computed from the replication data set. Coordinates reflect the approximate center location based on the atlas space of the Montreal Neurological Institute (MNI).
Table 2.
Locations of seed regions utilized in the sensory-motor pathway analysis
| Seed Region | Coordinates |
|---|---|
| MT+d | −44, −72, 8 |
| MT+ | −45, −72, 3 |
| MT+v | −45, −79, −1 |
| aMT+ | −51, −64, −2 |
| V1pd | −18, −70, 8 |
| V1pv | −8, −63, 6 |
| V1cd | −8, −95, 3 |
| V1cv | −8, −92, −5 |
| V3A | −17, −92, 20 |
| V4 | −22, −65, −9 |
| FEF | −26, −6, 48 |
| PrCv | −50, 6, 30 |
| IPS2 | −40, −37, 42 |
| IPS3m | −31, −48, 46 |
| SPL7A | −28, −61, 60 |
| SPL7P | −14, −68,64 |
| IPS1 | −46, −49, 51 |
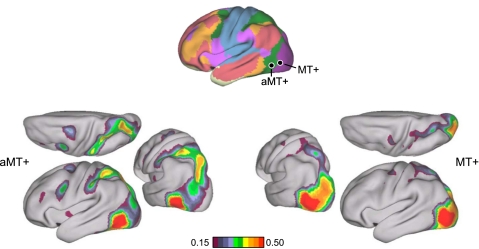
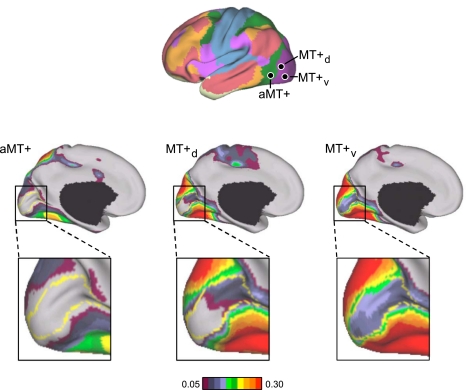
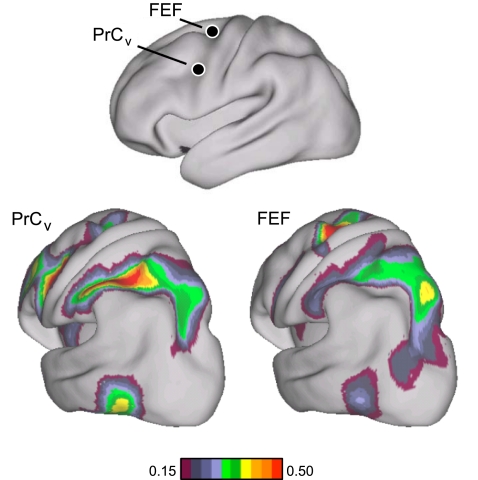
Four V1 seed regions were selected using the calcarine fissure, histological V1 estimates (Amunts et al. 2000; Fischl et al. 2008) and the 17-network boundary estimate in the discovery data set. V1pd and V1pv were selected from the dorsal and ventral parts of peripheral V1, likely representing the ventral and dorsal peripheral visual fields, respectively. V1cd and V1cv were selected from the dorsal and ventral parts of central V1, likely representing the ventral and dorsal central visual fields, respectively. MT+d, MT+, and MT+v seed regions were selected from the dorsal, central, and ventral parts of the histological map of the MT+ complex so that MT+d and MT+v likely represent peripheral and central visual fields, respectively. Based on the overrepresentation of the lower visual field within macaque MT (Maunsell and Van Essen 1987), it is possible that the 3 MT+ seed regions might also represent the lower visual field. aMT+ was selected to be anterior and outside the MT+ histological map. V3A and V4 were selected based on their high correlation with MT+ in the discovery sample and were named using the approximate map of human visual areas (Van Essen 2004) as reference. Frontal eye field (FEF) and precentral ventral frontal cortex (PrCv) were selected from the caudal frontal cortex, whereas IPS2, IPS3m, SPL7A, SPL7P, and IPS1 were at or near the intraparietal sulcus (IPS). FEF, IPS2, SPL7A, and SPL7P were derived from the meta-analysis of functional magnetic resonance imaging (fMRI) studies (see Table 4). The PrCv region was selected based on its correlation with aMT+. IPS3m was chosen spatially between IPS2 and SPL7A. IPS1 was chosen on the lateral wall of rostral IPS. IPS2, IPS3m, SPL7A, SPL7P, and IPS1 were named using the probabilistic histological maps of the parietal cortex as reference (Choi et al. 2006; Scheperjans et al. 2008a; 2008b). Coordinates reflect the approximate center location based on the MNI atlas space.
Table 3.
Summary of fMRI meta-analysis to obtain coordinates for IPS2, SPL7A, SPL7P, and FEF
| Seed Region | Coordinates | Putative Macaque Homolog | Literature |
|---|---|---|---|
| IPS2 | −40, −37, 42 | AIP (anterior intraparietal) | Binkofski et al. 1998, 1999; Culham et al. 2003; Grefkes et al. 2002; Jäncke et al. 2001; Shikata et al. 2001, 2003 |
| SPL7A | −28, −61, 60 | LIP (lateral intraparietal) | Hagler et al. 2007; Heide et al. 2001; Koyama et al. 2004; Luna et al. 1998; Medendorp et al. 2003; Sereno et al. 2001 (as reported in Table 1 of Hagler et al. 2007); Shulman et al. 2003 |
| SPL7P | −14, −68, 64 | PIP (posterior intraparietal) | Faillenot et al. 2001; Shikata et al. 2001; Shikata et al. 2003; Taira et al. 2001 |
| FEF | −26, −6, 48 | FEF (frontal eye field) | Connolly et al. 2000, 2002; Corbetta et al. 1998; Heide et al. 2001; Koyama et al. 2004; Luna et al. 1998; Perry and Zeki 2000 |
For studies that only report right hemisphere coordinates, left hemisphere coordinates were obtained by reflection across the midline. Coordinates reflect the approximate center location based on the MNI atlas. For IPS2, tasks generally involved perception of 3-dimensional objects. Studies reporting responses at or near SPL7A used saccadic eye movement tasks. Studies reporting responses at or near SPL7P involved tasks requiring surface/orientation discrimination. FEF coordinates come from studies of saccadic eye movements.
Table 4.
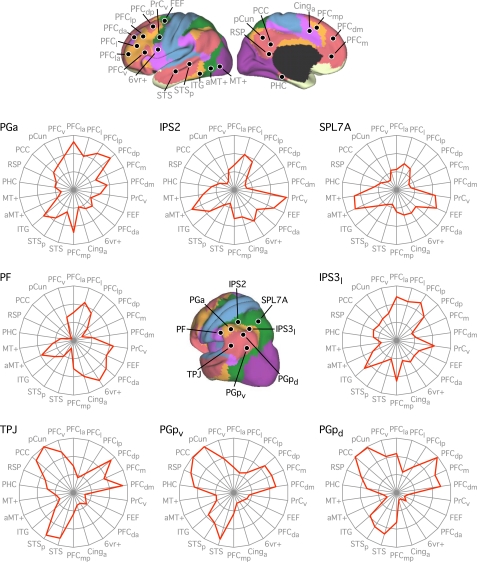
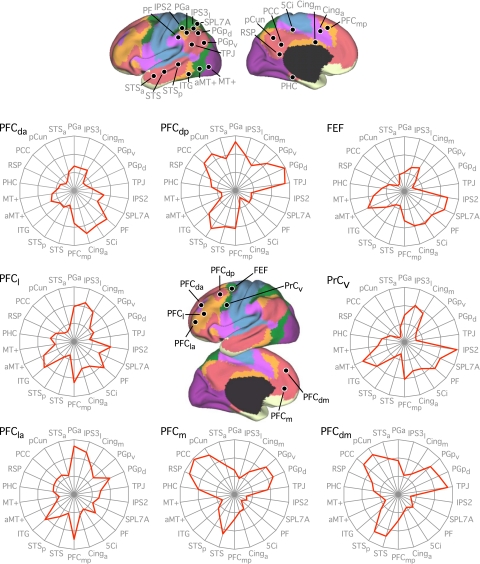
Locations of seed regions used for analysis of connectivity fingerprints
| Seed Region | Coordinates |
|---|---|
| Parietal cortex/posterior cingulate | |
| PGa | −52, −50, 49 |
| IPS2 | −40, −37, 42 |
| SPL7A | −28, −61, 60 |
| IPS3l | −35, −56, 42 |
| PGpd | −49, −63, 45 |
| PGpv | −49, −69, 28 |
| TPJ | −51, −57, 27 |
| PF | −60, −37, 38 |
| 5Ci | −16, −32, 39 |
| PCC | −3, −49, 25 |
| pCun | −10, −57, 35 |
| Frontal cortex/anterior cingulate | |
| PFCla | −41, 55, 4 |
| PFCl | −38, 33, 16 |
| PFCda | −31, 39, 30 |
| PFClp | −45, 29, 32 |
| PFCdp | −44, 15, 48 |
| PrCv | −50, 6, 30 |
| FEF | −26, −6, 48 |
| PFCv | −55, −24, −13 |
| 6vr+ | −55, 6, 11 |
| PFCm | −7, 46, −2 |
| PFCdm | −4, 49, 32 |
| PFCmp | −5, 22, 47 |
| Cinga | −10, 13, 40 |
| Cingm | −5, 2, 29 |
| Occipital/temporal cortex | |
| STSa | −49, 5, −26 |
| STS | −55, −10 −16 |
| STSp | −49, −34, −4 |
| ITG | −59, −53, −14 |
| aMT+ | −51, −64, −2 |
| MT+ | −45, −72, 3 |
| Medial temporal/retrosplenial cortex | |
| PHC | −25, −31, −20 |
| RSP | −7, −50, 7 |
Seed regions correspond to locations in Figs. 30 and 31. Where possible, seed regions were carried forward from previous analyses (i.e., IPS2, SPL7A, FEF, PrCv, aMT+, and MT+; see Tables 2 and 3). Seed regions PF and PGa were at or near human inferior parietal areas PF and PGa, respectively (Caspers et al. 2006; 2008). The IPS3l seed region was selected to be on the lateral lip of the IPS at or near human hIPS3, whereas the 5Ci seed region corresponded to the human posterior cingulate sulcal region 5Ci (Scheperjans et al. 2008a; 2008b). PGpd and PGpv correspond to the dorsal and ventral aspects of area PGp in the inferior parietal lobule (Caspers et al. 2006; 2008). The temporoparietal junction (TPJ) seed region was selected based on the peak coordinates reported in a human fMRI study of mental state inference (Saxe and Powell 2006), which accords well with the predicted mean peak in a recent meta-analysis on the same topic (Van Overwalle and Baetens 2009). Seed region 6vr+ was selected to be anterior to the map of premotor area 6 (Geyer 2004) and was labeled to reflect a new cytoarchitectonic delineation within the ventral precentral region (Amunts et al. 2010). Seed region PFCv fell within the histological map of BA45 (Amunts et al. 1999; Fischl et al. 2008). The remaining seed regions were selected to provide comprehensive coverage of the lateral and medial aspects of the cortical surface such that each association network was represented by multiple targets. Labels for the remaining seed regions were determined according to gross anatomical landmarks and were given subscripts to denote relative positions: Cing, cingulate sulcus; pCun, precuneus; ITG, inferior temporal gyrus; PCC, posterior cingulate cortex; PFC, prefrontal cortex; PHC, parahippocampal cortex; RSP, retrosplenial cortex; STS, superior temporal sulcus. Subscripts: a, anterior; p, posterior; l, lateral, m, medial, d, dorsal; v, ventral. Coordinates reflect the approximate center location based on the MNI atlas.
Table 5.
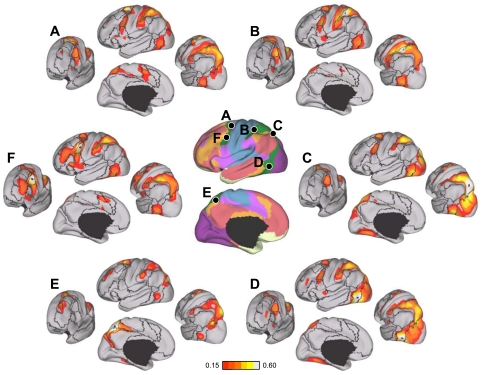
Locations of seed regions used for analysis of parallel networks in association cortex
| Seed Region | Coordinates | Confidence |
|---|---|---|
| Dorsal attention A | −22, −8, 54 | 0.54 |
| Dorsal attention B | −34, −38, 44 | 0.53 |
| Dorsal attention C | −18, −69, 51 | 0.46 |
| Dorsal attention D | −51, −64, −2 | 0.55 |
| Dorsal attention E | −8, −63, 57 | 0.32 |
| Dorsal attention F | −49, 3, 34 | 0.49 |
| Ventral attention A | −31, 39, 30 | 0.49 |
| Ventral attention B | −54, −36, 27 | 0.63 |
| Ventral attention C | −60, −59, 11 | 0.27 |
| Ventral attention D | −5, 15, 32 | 0.65 |
| Ventral attention E | −8, −24, 39 | 0.57 |
| Ventral attention F | −31, 11, 8 | 0.67 |
| Control A | −40, 50, 7 | 0.52 |
| Control B | −43, −50, 46 | 0.51 |
| Control C | −57, −54, −9 | 0.25 |
| Control D | −5, 22, 47 | 0.43 |
| Control E | −6, 4, 29 | 0.27 |
| Control F | −4, −76, 45 | 0.25 |
| Default A | −27, 23, 48 | 0.46 |
| Default B | −41, −60, 29 | 0.63 |
| Default C | −64, −20, −9 | 0.61 |
| Default D | −7, 49, 18 | 0.60 |
| Default E | −25, −32, −18 | 0.22 |
| Default F | −7, −52, 26 | 0.61 |
Each region consisted of single surface vertex (∼4 × 4 mm) but should be considered spatially more extensive because of the spatial smoothing and intersubject averaging. Correlation maps were obtained by computing the Pearson's product moment correlation between the region's preprocessed resting fMRI time course and the time courses of all other vertices across the cortical mantle. To obtain a group-averaged correlation z-map, the correlation map of each subject in the group was converted to individual subject z-map using Fisher's r-to-z transformation and then averaged across all subjects in the group. The Fisher's r-to-z transformation increases normality of the distribution of correlations in the sample. For subjects with multiple runs, the individual subject z-maps were first averaged across the runs before submitting to the group average. An inverse Fisher's r-to-z transformation was then applied to the group-averaged correlation z-map, yielding a group-averaged correlation map.
To quantify functional connectivity among regions, Fisher's r-to-z-transformed correlations were computed among the regions for each subject within a group. For several targeted, a priori analyses, classical statistical tests, including t-tests (e.g., see Figs. 20 and 21) and ANOVA (e.g., see Figs. 22 and 27), were performed on the z-transformed correlations using Matlab 7.4 (The Mathworks, Natick, MA) or SPSS 18.0 (IBM, Armonk, NY). All tests survive Bonferroni correction for multiple comparisons.
Fig. 20.
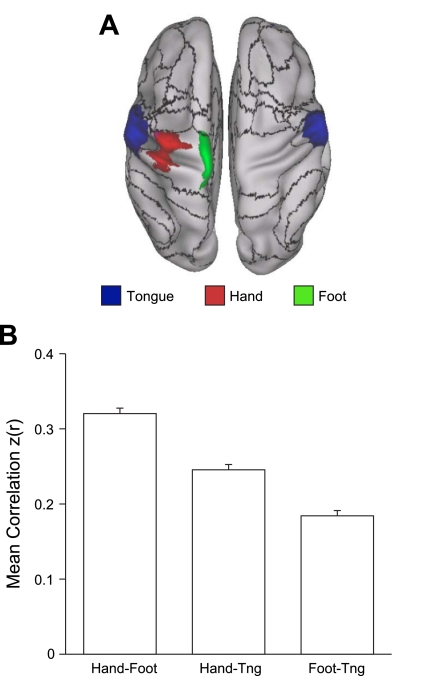
Evidence that the fractionation of the somatomotor cortex reflects fcMRI topography within the somatosensory and motor cortex. A: average fMRI activation maps of 24 subjects instructed to move their tongue (blue), right hand (red), or right foot (green) across separate conditions. Black lines correspond to boundaries of the 17-network estimate. The dorsoventral split of the somatomotor network occurs spatially between the tongue and hand activations. B: quantification of correlation strength between the left hemisphere tongue, hand, and foot seed regions selected from the activation maps. Hand coordinates = −41, −20, 62; foot coordinates = −6, −26, 76; and tongue coordinates: −55, −4, 26. Hand-foot correlation is significantly higher than hand-tongue correlation, which is in turn significantly higher than foot-tongue correlation. Tng, tongue.
Fig. 21.
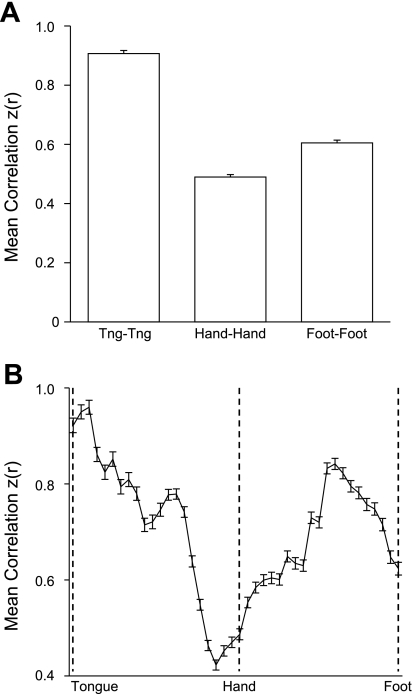
Evidence that the interhemispheric fcMRI of homotopic regions within the primary motor cortex is topographically organized. A: correlation strength of left hemisphere tongue, hand, and foot seed regions with corresponding contralateral seed regions averaged over all 1,000 subjects. Right hemisphere vertices were obtained by reflection across the midline. Hand coordinates = ±41, −20, 62; foot coordinates = ±6, −26, 76; and tongue coordinates = ±55, −4, 26. The tongue representation has the strongest interhemispheric correlation, followed by the foot and then the hand. B: plot of interhemispheric correlation along the ventral (tongue) to dorsal (foot) extent of motor cortex. Maximal interhemispheric correlation is highest near the tongue representation and also peaks between the hand and foot representations, possibly corresponding to the trunk representation.
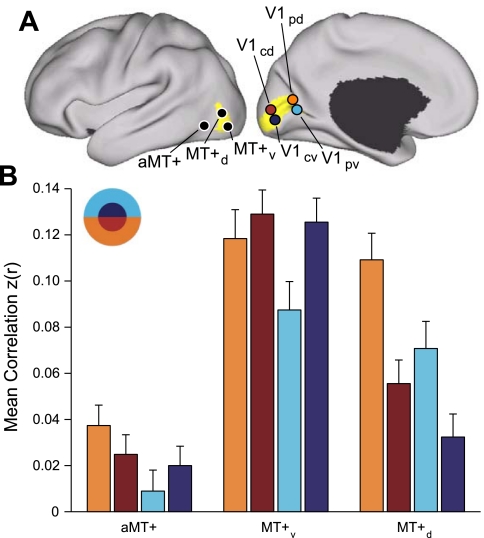
Fig. 22.
Functional connectivity between MT+ and V1 is topographically organized. A: 2 MT+ seed regions, MT+d and MT+v, were selected in the dorsal and ventral portions of the histological MT+ estimate, respectively. The anterior MT+ (aMT+) seed region was selected anterior to histological MT+. Four V1 seed regions were selected using the histological V1 estimate: V1cd and V1cv were selected in dorsal and ventral central V1; V1pd and V1pd were selected in dorsal and ventral peripheral V1. Coordinate locations of seed regions are reported in Table 2. B: correlation strength of aMT+ and MT+ seed regions with V1 in the replication dataset. There are 4 observations to be noted: 1) V1-aMT+ correlation is weaker than V1-MT+ correlation, 2) MT+ correlation with the lower visual field is stronger than the upper visual field, 3) MT+d correlation with peripheral V1 is stronger than central V1, and 4) MT+v correlation with central V1 is stronger than peripheral V1.
Fig. 27.
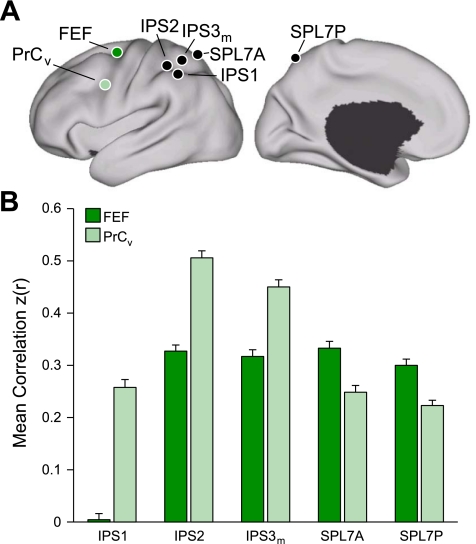
Evidence for segregated pathways linking caudal frontal cortex with SPL and IPS. A: 5 parietal seed regions were selected along the rostrocaudal extent of SPL and IPS. Two frontal seed regions, FEF and PrCv, were selected in dorsal and ventral precentral sulcus. All seed regions were selected using the discovery data set or meta-analysis of fMRI studies (Table 3). The coordinate locations are reported in Table 2. B: functional connectivity of FEF and PrCv with the 5 parietal seed regions, arranged in rostral (lateral) to caudal (medial) order, from the replication data set. Rostrolateral IPS seed regions (IPS1, IPS2, and IPS3m) are more strongly correlated with PrCv than FEF, whereas the mediocaudal SPL seed regions (SPL7A and SPL7P) are more strongly correlated with FEF than PrCv.
Selecting Regions for Functional Connectivity Analysis
Throughout the analyses, seed regions for functional connectivity were selected using different criteria depending on the purpose of the analysis. In all cases, if a particular data set was used for selecting the region (e.g., discovery sample), functional connectivity was always computed with a different data set (e.g., replication sample), thus providing an unbiased measurement of correlation strength. We have detailed the method used for region selection in the results as implemented for each particular analysis in results. The following procedures describe the general strategies adopted.
First, when testing for seed-based confirmation of resolved networks, the estimated network boundaries and confidence maps of the discovery sample were used to derive regional vertices to be tested in the replication sample (e.g., see Fig. 16). Regions were chosen for 1) maximal spatial coverage of estimated networks, 2) avoiding network boundaries, and/or 3) their confidence in network assignments. We also defined new regions based on the correlation maps from the discovery sample. For example, new regions might be chosen to be at or near the peaks of the correlation maps.
Fig. 16.
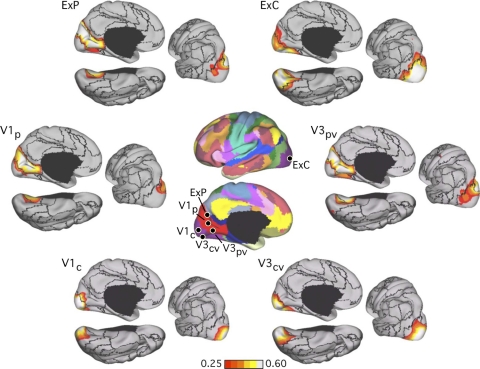
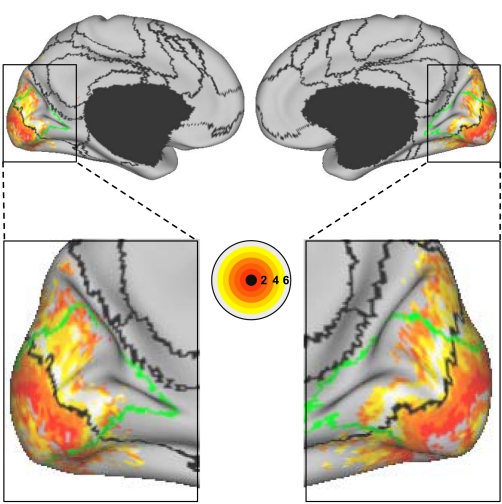
Evidence that the fractionation of the visual system reflects functional connectivity MRI (fcMRI) topography within the visual cortex. Six left hemisphere seed regions were picked from the discovery dataset: V1c and V1p correspond to central and peripheral visual field representation within V1, respectively; V3cv and V3pv correspond to central and peripheral V3v, respectively; ExC and ExP correspond to 2 seed regions within the extrastriate visual cortex in the estimated locations of the central and peripheral visual fields (purple and bright red at center). The 6 seed regions are illustrated at center, and their coordinate locations are reported in Table 1. Their left hemisphere fcMRI maps were computed using the replication data set and arranged around the center images. Note that the central visual seed regions are selectively correlated with the central visual representation, whereas the peripheral visual seed regions are selectively correlated with the peripheral visual representation.
Second, for some analyses we utilized task-based fMRI to select regions. For example, visuotopic and functional characteristics revealed using fMRI can be used to estimate visual areas in the human (Hadjikhani et al. 1998; Sereno et al. 1995). The Caret software database provides estimated locations of multiple visual areas that were mapped into Caret PALS space using surface-based registration of an individual case in Hadjikhani et al. (1998), although the foveal and peripheral extents of these areas are likely to be underestimated for technical reasons (Van Essen 2004). Landmark-based surface registration between FreeSurfer and Caret PALS allowed us to utilize these fMRI-defined visuotopic regions for guiding our selection of regions in FreeSurfer surface space (e.g., see V3A in Fig. 25). In addition, we also considered peak activation coordinates reported in fMRI literature (e.g., see Fig. 27). When the peak coordinates were reported in MNI space, we projected the coordinates to FreeSurfer surface space. The mapping between MNI152 volumetric space and FreeSurfer surface space is detailed in our companion study (Buckner et al., in press). In cases where the peak activation coordinates were reported in the atlas space of Talairach and Tournoux (1988), the coordinates were first mapped to FSL MNI152 space (Lancaster et al. 2007) before being projected to FreeSurfer surface space.
Fig. 25.
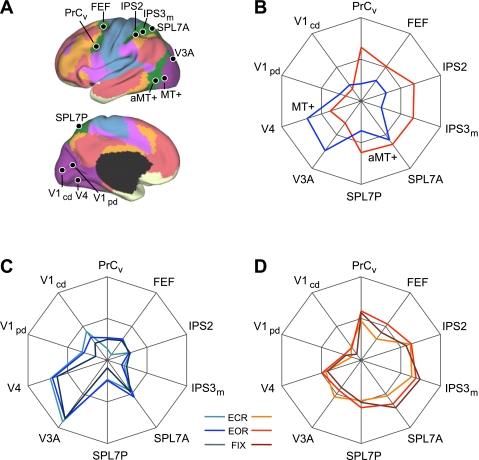
aMT+ and MT+ functional connectivity patterns generalize across task conditions. A: 4 visual, 4 parietal, and 2 frontal seed regions were used to quantify the functional coupling of aMT+ and MT+ to distributed cortical regions. Coordinate locations of the seed regions are reported in Table 2 and were chosen using either the discovery data set or meta-analysis of fMRI studies (Table 3). B: polar plots of MT+ (blue) and aMT+ (red) connectivity with the visual, parietal, and frontal seed regions were computed using the replication data set. MT+ is more strongly correlated with visual cortex compared with parietal and frontal cortices. The converse is true for aMT+. C and D: polar plots of MT+ (blue) and aMT+ (red) connectivity replicated in the task effects data set demonstrate that the functional coupling differences generalize across multiple data acquisition conditions. The polar scales range from r = −0.1 (center) to r = 0.6 (outer boundary) in 0.35-step increments.
Third, probabilistic histological maps in FreeSurfer surface space allowed for the selection of regions within histologically defined areas (e.g., see Fig. 22). Postmortem human brains of 15 subjects with no history of neurologic or psychiatric diseases were processed and analyzed (Amunts et al. 1999; Schleicher et al. 1999; Schormann and Zilles 1998). The histological sections were aligned to postmortem MR volume of the same brain using nonlinear warping (Schormann and Zilles 1998) to build an undistorted three-dimensional histological volume. Cytoarchitectonic areas, including V1 (Amunts et al. 2000) and hOc5/MT+ (Malikovic et al. 2007), were segmented using observer-independent criteria (Schleicher et al. 1999). The MR volumes were segmented to separate white matter from other tissue classes, and the segmentation was used to generate topologically correct and geometrically accurate surface representations of the cerebral cortex using FreeSurfer (Fischl et al. 2008). The cortical surfaces of the 15 subjects were registered to FreeSurfer surface space, and the histological areas were sampled onto the surface space. Whereas there were 15 subjects, each cytoarchitectonic area was only analyzed in at most 10 subjects.
Prior work has demonstrated good across-subject alignment of lower order cortical areas in the surface coordinate system, with average misregistration errors as small as 2–3 mm for V1 (Fischl et al. 2008; Hinds et al. 2008; Yeo et al. 2010a), which is around the spatial resolution of the present fMRI data. For higher order regions such as BA44, BA45, and hOc5/MT+, intersubject agreement is worse, with average misalignment errors in the order of 6–12 mm (Fischl et al. 2008; Yeo et al. 2010a; 2010b), but still an improvement from standard volumetric alignment (Amunts et al. 1999). In the case of histologically defined hOc5, considered to be putative MT+ (Malikovic et al. 2007), we were able to verify (not shown) that the probabilistic map of hOc5 in FreeSurfer surface space (Yeo et al. 2010b) was consistent with that of MT+ defined in Caret PALS space (Van Essen 2004) and peak MT+ coordinates reported in Shulman et al. (1999). Certain anatomical landmarks were also useful in the selection of regional vertices. For example, the calcarine fissure was used as a guide to select regions in the lower and upper visual field representations as well as in the central and peripheral visual field representations within V1 (e.g., see Fig. 22).
Comparison of Network Boundaries With Cytoarchitectonic Areas
In addition to their utility for selecting regions, the probabilistic histological maps were useful in relating the estimated network boundaries to human cytoarchitectonic areas. Because the Statistical Parametric Mapping (SPM) Anatomy toolbox contained a more complete set of probabilistic histological maps of the same subjects in MNI Colin27 volumetric space (Eickhoff et al. 2005), we projected these probability maps to FreeSurfer surface space by establishing spatial correspondence between Colin27 and FreeSurfer surface space using the same procedure as that used for mapping between MNI152 volumetric space and FreeSurfer surface space (Buckner et al., in press). Cytoarchitectonic areas common to both data sets were those of the primary motor cortex (areas 4a and 4p; Geyer et al. 1996), premotor cortex (area 6; Geyer 2004), primary somatosensory cortex (areas 3, 2, and 1; Geyer et al. 1999), early visual cortex (areas 17 and 18; Amunts et al. 2000), hOc5/MT+ (Malikovic et al. 2007), and BA44/45 (Amunts et al. 1999). Consistent with previous discussion about surface-based vs. volume-based registration, we found Eickhoff's probabilistic maps in FreeSurfer space to be more diffuse than the maps obtained from the purely surface-based approach, possibly a result of differences in intersubject alignment. Consequently, for cytoarchitectonic areas common to both data sets, the surface-based probabilistic maps were used (Fischl et al. 2008; Yeo et al. 2010b) (e.g., see Fig. 22). We were also able to verify reasonable overlap (not shown) between the projected Eickhoff's maps and the purely surface-based probabilistic maps for areas common to both data sets, substantiating the validity of the mapping between the Colin27 space and FreeSurfer surface space.
Effect of Resting Condition on Functional Connectivity
For certain analyses, it was important to check that findings were not the result of overt eye movements that might shift edges and visual boundaries in and out of the central field. The core dataset (N = 1,000) employed an EOR condition, because it is comparable to visual fixation in terms of signal strength (Van Dijk et al. 2010) but can be acquired in studies that do not employ a setup for visual display. To examine the effects of the task employed during the resting state, the effect of condition was analyzed for certain key analyses (e.g., for analyses that quantified the functional connectivity strengths among visual regions). As the results show, the type of resting condition (EOR, ECR, or FIX) is not a significant factor influencing our results (e.g., see Fig. 17).
Fig. 17.
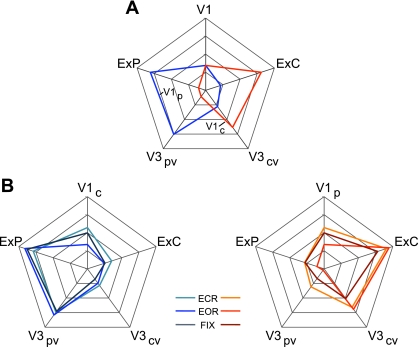
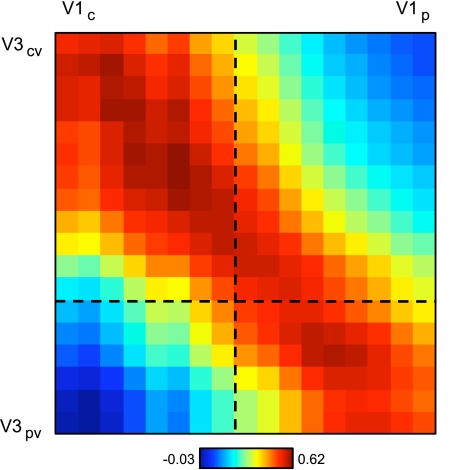
Quantification of fcMRI topography within the visual cortex and independence of the topography from task condition. A: quantification measures of functional connectivity strength are plotted in polar form for V1c (central V1) and V1p (peripheral V1) seed regions for the replication data set. Note that “V1” refers to V1c for the V1p polar plot (blue) and V1p for the V1c polar plot (red). Coordinate locations for all 6 seed regions (V1c, V1p, V3cv, V3pv, ExC, and ExP) are reported in Table 1. B: polar plots from A replicated with the task effects data set (EOR, eyes open rest; ECR, eyes closed rest; FIX, fixation) to ensure that the results obtained using the EOR replication data set were not due to overt eye movements that might shift edges and visual boundaries in and out of the central field. Left: V1p polar plot. Right: V1c polar plot. The polar plots quantify the differential functional coupling of central and peripheral V1 with higher visual areas. The polar scales range from r = −0.1 (center) to r = 0.7 (outer boundary) in 0.2-step increments.
Visuotopic fMRI Data
The analyses of the visual cortex involved the visuotopic organization of the V1-V3 complex. The fMRI data were analyzed in the native subjects' volumetric space, and the results were sampled onto FreeSurfer surface space and averaged across subjects. The details of the analysis, which provided eccentricity estimates of the visual representation in the V1-V3 complex, are described elsewhere (Hinds et al. 2009). A 1-mm smoothing kernel was applied to the averaged eccentricity estimate in FreeSurfer surface space. Because of the limited range of visual angle that could be stimulated in the MRI scanner, and because fixational eye movements that occur during visual stimulation prevent stable stimulation of the fovea, the eccentricity estimates did not cover the representation of the periphery or of the center of visual field within the V1-V3 complex (Hinds et al. 2009; Polimeni et al. 2005) but were sufficient for our analyses.
Distribution of Parcellations and Raw Data
A primary result of this study is the parcellation of cortical networks and the estimation of boundaries of regions within the networks. The parcellations of parietal and prefrontal cortices, in particular, represent demarcations of complex topographical regions that have been perplexing to understand in relation to task-based functional neuroimaging studies. We have uploaded the parcellations in Caret PALS surface space into the Surface Management System Database (SumsDB) for open use (Dickson et al. 2001) (http://sumsdb.wustl.edu:8081/sums/directory.do?id=8286317). The parcellations in FreeSurfer surface space are also available (http://www.freesurfer.net/fswiki/CorticalParcellation_Yeo2011). Movies of the region-based functional connectivity estimates can be downloaded from http://www.youtube.com/yeokrienen. The raw fMRI data from the 1,000 subjects will be made openly available to researchers using the procedures established by the OASIS data releases (Marcus et al. 2007, 2010) and the 1,000 Functional Connectomes Project (Biswal et al. 2010).
RESULTS
Estimates of Cerebral Networks Are Reliable
The cerebral cortex was parcellated into multiple networks using clustering. The parcellations resulted in networks that involved primarily adjacent areas (e.g., visual cortex) and networks that involved areas widely distributed throughout the cortex (e.g., heteromodal association cortex). Figure 7 shows the 7-network estimates for the discovery and replication samples. A total of 97.4% of the vertices were assigned to the same networks across both data sets. Varying the particular choice of binarization threshold (ranging from 5% to 15%) and smoothing (ranging from no smoothing to 6-mm FWHM) minimally affected the results (not shown). Figure 8 shows the confidence (silhouette) value for each vertex with respect to its assigned network for the 7-network estimate. Regions close to the boundaries between networks were less confident in their assignment. Spatial variation within individual components of the estimated networks was also observed beyond the boundary regions. Often these low-confidence regions anticipated further fractionation of the networks into smaller subnetworks that emerged when larger numbers of networks were allowed (e.g., compare the lateral prefrontal extent of the orange network in Fig. 7 with its confidence map in Fig. 8, and then note subsequent fractionation of this region in Fig. 9). Figure 9 shows the 17-network estimates for the discovery and replication data samples, and Fig. 10 shows the confidence map for the discovery data set. For the 17-network estimate, 97.0% of the vertices were assigned to the same networks across both data sets.
Fig. 7.
Discovery and replication of a 7-network cortical parcellation. The 7-network estimates are highly consistent across the discovery (n = 500) and replication (n = 500) data sets. A total of 97.4% of the vertices were assigned to the same network.
Fig. 9.
Discovery and replication of a 17-network cortical parcellation. The 17-network estimates are highly consistent across the discovery (n = 500) and replication (n = 500) data sets. A total of 97.0% of the vertices were assigned to the same network.
Estimates of Cerebral Networks From 1,000 Subjects
To provide the best estimates of the cerebral cortical networks, clustering was performed on the full sample of 1,000 subjects. Figures 11 and 13 show the 7- and 17-network parcellation estimates, respectively. Several results are notable. A salient feature of the estimated networks is the separation of the early sensory and late motor cortices (blue and purple) from association cortex, consistent with the observation that early sensory and late motor regions exhibit dense local anatomical connectivity in primates (Felleman and Van Essen 1991; Jones et al. 1978; Markov et al. 2010) and preferential local functional coupling in humans (Sepulcre et al. 2010). Sensory and motor cortices, whose functional connectivity networks were preferentially local, comprised only 35% of the cerebral mantle and were the exception in terms of network structure.
The majority of the human cerebral cortex is made up of multiple, distinct networks of association areas. The association networks in the 7-network estimate converged and extended on networks previously described in the resting-state literature, including those referred to as the dorsal and ventral attention (green and violet, respectively; Fox et al. 2006), the frontoparietal control (orange; Dosenbach et al. 2007; Vincent et al. 2008), and the default (red; Buckner et al. 2008; Greicius et al. 2003) networks (Fig. 12). We also note that the 7-network parcellation of the parietal cortex is similar to those proposed using seed-based approaches (Vincent et al. 2008) and using the areal boundary detection method (Cohen et al. 2008; Nelson et al. 2010). The convergence of multiple different analysis approaches suggests that the parcellation is intrinsic to the resting-state data rather than an artifact of the algorithm used.
Fig. 12.
Table of colors assigned to networks in the 7-network estimate. Common names associated with each network in the neuroimaging literature are included in parentheses. This should not be taken to mean that our estimated networks correspond exactly to those in the literature or that the networks code solely for functions associated with their assigned name. As examples of limitations of heuristic reference labels, the violet ventral attention network is likely an aggregate of (or closely adjacent to) multiple networks in the literature variably referred to as the salience (Seeley et al. 2007) and cingulo-opercular networks (Dosenbach et al. 2007), and the red default network can be fractionated (e.g., Andrews-Hanna et al. 2010). Many of these details are reflected in Fig. 13.
Generally, the 17-network estimate (Fig. 13) fractionated the 7-network estimate into smaller subnetworks. Some aspects of the fractionation, such as the emergence of a parahippocampal-retrosplenial-lateral parietal network, are anticipated by other studies using hierarchical clustering techniques (e.g., Andrews-Hanna et al. 2010). Other aspects of the fractionation were unexpected, such as the emergence of subnetworks within the visual and motor cortices that did not respect areal boundaries but rather appear to align with topographic organization. In the following sections, we quantify and further explore the patterns of functional connectivity that give rise to these networks.
A Cautionary Note About Potential Artifacts
Before exploring the estimated networks in more detail, it is important to point out aspects of the data that are difficult to interpret because of potential fMRI signal blurring across gyri and signal loss associated with susceptibility (Ojemann et al. 1997). Figure 14A illustrates one example. Somatomotor, auditory, and posterior insular cortices are correlated within a single network (also see Fig. 11). The ventral portion of somatomotor cortex is clustered with the auditory cortex in the 17-network parcellation (Fig. 13). Although nonhuman primate tracing studies suggest auditory and somatomotor cortices are connected via multiple areas within the insular cortex (Disbrow et al. 2003; Mesulam and Mufson 1982), an equally likely explanation for the observed correlation is blurring of the BOLD signal across the Sylvian fissure (Fig. 14A). We could not find a way, in these data, to resolve whether the coupling was an artifact of limited resolution or a true, coupled network.
Fig. 14.
Uncertain observations due to limited data resolution and MR susceptibility. When the clustering results are interpreted, potential artifacts and uncertainties must be considered. Because of the close proximity of the somatomotor and auditory cortices (A) and the close proximity of the pre- and postcentral gyri (B), we are unable to resolve whether the clustering of the somatomotor and auditory cortices (A) and the clustering of the primary somatosensory and primary motor cortices (B) are due to the result of fMRI blurring across sulci or a true, coupled network of distributed areas as predicted by macaque tracing studies. C: the orbital frontal-temporopolar network (cream color) consists of temporopolar and orbital frontal regions that are affected by MR susceptibility. Since MR susceptibility spatially distorts the MR signal and reduces SNR, there is uncertainty in the exact boundary of the orbital frontal-temporopolar network, and the true extent of the network is probably underestimated.
Figure 14B illustrates a second example of how fMRI signal blurring might affect the interpretation of the results. In this case, the primary somatosensory cortex (S1) and primary motor cortex (M1) are clustered within the same network (Fig. 11). Although there is anatomical evidence of direct connectivity between S1 and M1 in the macaque (Jones et al. 1978; Pons and Kaas 1986), we are unable to resolve whether the coupling was an artifact of limited resolution due to the close proximity of M1 and S1 in volumetric space.
As an example of uncertainty occurring near regions of MR susceptibility, Fig. 14C illustrates a cream-colored network of regions in the temporal pole and orbital frontal cortex (also see Fig. 11). Although there is anatomical evidence from the primate tracing literature supporting the existence of this network (Carmichael and Price 1995; Kondo et al. 2003; Moran et al. 1987), the spatial distortion and signal loss caused by MR susceptibility creates uncertainty in the location of the network boundaries.
Sensory and Motor Cortices Exhibit Topographically Specific Functional Connectivity
The sensory and motor cortices were clustered separately from the association cortex in the 7-network estimate (Fig. 11). This result by itself suggests that sensory and motor cortices distinguish themselves from distributed networks of association areas. Within the sensory and motor networks, there were a number of further observations. Of most interest, the 17-network parcellation fractionated the sensory and motor cortices into subnetworks (Fig. 13). Specifically, early visual regions formed two distinct subnetworks that did not respect areal boundaries. Somatomotor cortex was similarly fractionated along its lateral extent. Our hypothesis is that these fractionations reflect topographic organization: topographic representation of visual space in the visual regions and topographic representation of body space in the somatomotor regions.
Visual topography.
The visual network in the 7-network estimate (Fig. 11) was fractionated into two separate subnetworks (purple and bright red) in the 17-network estimate (Fig. 13). The boundary between the two visual subnetworks cut perpendicularly across the calcarine fissure, suggesting the division of the early visual areas into central and peripheral components. To evaluate this possibility, Fig. 15 overlays the eccentricity estimates of the visuotopic data set over the boundaries of the two separate visual subnetworks. The early visual areas were divided into two subnetworks along an isoeccentricity line of ∼4°. We refer to these two subnetworks as “central” and “peripheral,” although an immediate question arises as to whether the division of lower visual areas into central and peripheral components extends to higher visual areas. The particular traveling wave paradigm used in the visuotopic data set was designed to estimate visual eccentricity within the V1-V3 complex and is therefore unreliable outside the complex. To gain further clarification on visual areas outside the V1-V3 complex, we inspected the boundaries of the 17-network parcellation overlaid on the map of approximate human visual areas provided by Van Essen (2004). The boundary between the central and peripheral representations continues through the extrastriate visual areas consistent with the possibility that the division of lower visual areas into central and peripheral components generally applies to the extrastriate cortex, with certain caveats that will be taken up in the discussion.
Fig. 15.
Eccentricity estimates quantify the division of the early visual cortex into central and peripheral systems. Eccentricity estimates in the early visual areas of 4 subjects were averaged and overlaid on the boundaries (in black) of the 17-network estimate. The boundary between areas 18 and 19 estimated from the histological data set is overlaid in green. The 17-network estimate divides the early visual areas along an isoeccentricity line of ∼4°. Note that the eccentricity estimates are not reliable outside the V1-V3 complex.
To assess the validity of the clustering analysis of visual cortex, six seed regions were selected from the discovery sample (Table 1), and their fcMRI maps were computed using the replication sample. The regions were selected to include V1 and V3 regions that fell within the central and peripheral representations. Using the calcarine fissure, histological V1 estimates (Amunts et al. 2000; Fischl et al. 2008), and the network boundaries as landmarks, two regions labeled V1c and V1p were selected to correspond to central and peripheral V1, respectively. Using the probabilistic histological maps of the SPM Anatomy toolbox (Eickhoff et al. 2005), we selected two regions, labeled V3cv and V3pv, at or near visual area V3v (Rottschy et al. 2007; Wilms et al. 2010), corresponding to the central and peripheral representations, respectively. The two remaining regions were selected from the extrastriate regions of the central and peripheral visual subnetworks. In all cases, the confidence (silhouette) map of the 17-network estimate from the discovery sample (Fig. 10) was used as a guide.
The fcMRI maps of the six seed regions confirm the network demarcations (Fig. 16). Compared with the other seed regions of the central visual system, V1c demonstrated weaker correlation to the extrastriate regions of the central visual system. This is reflected by the lower confidence of V1c in its network assignment as shown in Table 1. Consistent with this observation, as the number of networks in the clustering analysis was increased (not shown), the central V1 region separated from the extrastriate component of the central visual system.
To quantify the dissociation between the central and peripheral representations within the visual subnetworks, Fig. 17A shows polar plots of the correlation of V1p and V1c with five regions in the replication sample. Since the discovery and replication samples consist of resting data collected under the EOR condition, the patterns of functional connectivity were also quantified for the task effect data set (Fig. 17B). The results revealed that the central and peripheral V1 seed regions displayed distinct patterns of functional connectivity that generalized across multiple data acquisition conditions, including ECR and FIX.
Although there are differences in visual field properties, such as magnification factors and receptive field sizes, between the central and peripheral regions of the V1-V3 complex, these differences vary smoothly from central to peripheral vision within an area (Balasubramanian et al. 2002; Dow et al. 1981; Rovamo and Virsu 1979). To explore this further, we examined functional connectivity among seed regions spanning the eccentricity axes of V1 and V3v (Fig. 18). Results did not suggest a sharp transition in functional connectivity between V1 and V3v seed regions moving from central to peripheral representations. The resulting division of the V1-V3 complex along the isoeccentricity line of 4° was therefore likely driven by the functional connectivity of visual regions outside the V1-V3 complex or may be an artifact of the small number of networks being mandated by the analyses.
Fig. 18.
V1 and V3 functional correlations display a smooth transition from the central to peripheral representations. Correlation of 2 series of seed regions spanning the eccentricity axes of V1 and V3v is shown for the full sample of 1,000 subjects. V1 seed regions of low eccentricity are strongly correlated with V3 seed regions of low eccentricity. V1 seed regions of high eccentricity are strongly correlated with V3 seed regions of high eccentricity. There is a gradual transition in functional connectivity strength between the central to peripheral representations.
Somatomotor topography.
The 7-network parcellation estimate clustered the somatomotor cortex into a single network (the blue network in Fig. 11). Figure 19 shows the boundaries of the 7-network estimate overlaid on the probabilistic histological maps of areas 6 (Geyer 2004), 2 (Grefkes et al. 2001), and 5L (Scheperjans et al. 2008a, 2008b). The histological estimates of areas 1, 3, and 4 (Geyer et al. 1996, 1999) are sandwiched between areas 2 and 6 and are not shown. Recent work (Amunts et al. 2010) has delineated three additional premotor areas anterior to the ventral half of area 6 shown in Fig. 19; the ventral half of area 6 in Fig. 19 is therefore an underestimation. On the basis of these areal references, the somatomotor network likely includes MI (area 4) and caudal premotor area 6, SI (areas 3, 1, and 2), and most, if not all, of early somatosensory area 5L. The somatomotor network also includes a small portion of the midcingulate sulcus and possibly area 5M (not shown; Scheperjans et al. 2008a; 2008b).
Fig. 19.
Seven-network boundaries on probabilistic maps of areas 6, 2, and 5L. Boundaries of 7-network estimate based on the full sample of 1,000 subjects are overlaid on the surface-based probabilistic histological maps of areas 6, 2, and 5L. The somatomotor network includes most, if not all, of areas 2 and 5L, but only the caudal half of area 6.
The 17-network parcellation divided the somatomotor strip into dorsal and ventral subnetworks across the axis that represents body space (Fig. 13). To investigate this division, the parcellations were compared with activation maps of 24 subjects who were instructed to move their tongue, hand, or foot in response to a visual cue (for a detailed explanation of this data set, see Buckner et al., in press). As shown in Fig. 20A, the boundary between the dorsal and ventral somatomotor subnetworks was roughly positioned between the hand and tongue representations. To quantify this observation, seed regions were selected from the left hemisphere hand, foot, and tongue activation maps and verified to fall within the probabilistic histological map of area 4 (Fischl et al. 2008; Geyer et al. 1996). Figure 20B shows pairwise correlations computed among the hand, foot, and tongue regions averaged over 1,000 subjects (hand coordinates: −41, −20, 62; foot coordinates: −6, −26, 76; tongue coordinates: −55, −4, 26). The hand-foot correlation was significantly higher than the hand-tongue correlation (P < 0.001) and foot-tongue correlation (P < 0.001). Thus, like the visual system, functional coupling forms networks within the somatomotor system that reflect topographic organization.
There are two further results that must be interpreted cautiously because of volumetric signal blurring. The 7- and 17-network parcellations of somatomotor cortex included both the precentral and postcentral representations of body space, thus forming networks that spanned areas (M1 and S1). This observation is difficult to interpret because precentral and postcentral gyri abut each other in volumetric space (see Fig. 14B). Similarly, the ventral somatomotor network in the 17-network parcellation included parts of the insula and auditory cortex, perhaps reflecting a polysynaptic circuit of functional coupling linked to speech movements and hearing one's own voice. We do not interpret this observation further because of their volumetric proximity (see Fig. 14A).
Asymmetry of Functional Coupling Varies Across Somatomotor Topography
Analysis of asymmetries in functional coupling is beyond the scope of this article. However, we observed an interesting variation in the asymmetry of functional coupling that reinforces the observation of functional differences along the somatomotor body representation. Specifically, pairwise correlations between homotopic pairs of hand, foot, and tongue representations (hand coordinates: ±41, −20, 62; foot coordinates: ±6, −26, 76; tongue coordinates: ±55, −4, 26) were measured between the hemispheres (Fig. 21A). The homotopic hand correlation was significantly weaker than that of the homotopic foot (P < 0.001) and tongue (P < 0.001) correlations. We are unable to rule out the possibility that the higher correlation between homotopic tongue regions is an artifact of subjects moving their tongues during scanning.
To explore the somatotopy of interhemispheric fcMRI beyond the hand, foot, and tongue representations, we estimated the sequence of vertices lying in the shortest path connecting the left tongue region with the left hand region and those lying in the shortest path connecting the left hand region with the left foot region. For each left hemisphere motor vertex, we found the corresponding right hemisphere vertex that was maximally correlated with it in the discovery sample. Figure 21B plots the correlation between the left hemisphere vertices, arranged ventral to dorsal, and the corresponding right hemisphere vertices in the replication data sample. Defining the maximally correlated right hemisphere vertices in the discovery sample avoided bias in the correlation values and the issue of picking truly homotopic representations in either hemisphere. Consistent with Fig. 21A, the maximal tongue correlation was higher than that of the foot, which was in turn higher than that of the hand. The region in between the hand and foot representations, possibly corresponding to the trunk representation, also displayed higher maximal interhemispheric correlation than those of the hand or foot representations.
The observed somatotopy of interhemispheric fcMRI is consistent with nonhuman primate studies that have shown that the representations of midline structures in S1 and M1, such as the face and trunk, have denser callosal connections than those of distal limbs, such as the hand and foot (Gould et al. 1986; Jones and Wise 1977; Killackey et al. 1983; Pandya and Vignolo 1971).
Hierarchical Processing Within a Canonical Sensory-Motor Pathway
Parcellation of the cerebral cortex into distinct networks will not capture information about interactions between regions that fall across separate networks. This is particularly problematic because the canonical system-level description of cortical processing involves interactions across hierarchical pathways of sensory and motor areas. The above analyses leave open the question of how the distinct networks interact as is expected for sensory-motor pathways.
To explore this question, we selected the canonical sensory-motor pathway that extends from primary visual cortex to the precentral motor regions (including the putative homolog of FEF) via the motion-sensitive MT+ complex and posterior parietal cortex at or near putative human LIP. In the macaque literature, this pathway has been extensively studied in relation to sensory-guided decisions resulting in eye movements and associated processes linked to spatial attention (e.g., Andersen and Buneo 2002; Colby and Goldberg 1999; Gold and Shadlen 2007; Shadlen and Newsome 2001). In the human literature, this pathway has been studied both in relation to spatially directed movements and also in relation to spatial attention, with components of the pathway sometimes referred to as the dorsal attention system or network (Corbetta and Shulman 2002). Most critically, the anatomical relations between the areas within the pathway have been extensively explored, beginning with the seminal work of Maunsell and Van Essen (1983).
Early visual cortex.
Analysis focused initially on the bottom of the sensory-motor pathway by investigating functional connectivity between V1 and putative human MT+.2 For this analysis, two V1 regions were selected in dorsal (V1cd) and ventral (V1cv) central V1 corresponding to the lower and upper visual field representations. Two additional V1 regions were selected in dorsal (V1pd) and ventral (V1pv) peripheral V1 corresponding to the lower and upper visual field representations. Two MT+ seed regions (MT+d and MT+v) were selected following the dorsoventral extent of the surface-based probabilistic histological map of MT+ (Malikovic et al. 2007; Yeo et al. 2010b). The MT+d and MT+v seed regions likely correspond to peripheral and central visual field representations, respectively (Huk et al. 2002; Maunsell and Van Essen 1987), and were analyzed to illustrate differential connectivity within MT+. Because of the overrepresentation of the lower visual field within macaque MT (Maunsell and Van Essen 1987), the distinct MT+ seed regions might also represent the lower visual field, although human fMRI studies have so far failed to yield strong evidence of this representational bias within MT+ (Amano et al. 2009; Kolster et al. 2010; Tootell et al. 1995). In the following analyses, MT+ was either analyzed as two regions using the extreme seed regions (MT+d and MT+v) or as a single region using the center seed region (MT+) for analyses that did not require the complexities of topographic distinctions. A single anterior MT+ (aMT+) region was chosen anterior to and outside the histological MT+.3 The regions are shown in Figs. 22A and 24; their coordinates are reported in Table 2.
Fig. 24.
aMT+ and MT+ demonstrate differential functional connectivity with parietal and frontal cortices. Functional connectivity maps of aMT+ and MT+ seed regions were computed using the replication data set. Coordinate locations of the regions are reported in Table 2. MT+ and aMT+ are more strongly correlated with superior parietal lobe (SPL) and intraparietal sulcus (IPS) than with inferior parietal lobe (IPL). Correlation with frontal cortex is mostly limited to precentral sulcus and gyrus. aMT+ demonstrates stronger overall correlation with parietal and frontal cortices, compared with MT+. MT+ and aMT+ are maximally correlated with different parts of parietal and frontal cortices.
Figure 22B quantifies the differential functional coupling of the four V1 regions with MT+ and aMT+ within the replication sample. V1 showed strong functional coupling to MT+ and significantly weaker coupling to aMT+ (P < 0.001 for both MT+v and MT+d). The dorsal and ventral MT+ regions also demonstrated differential functional coupling with the four V1 regions, confirmed by a 2 × 2 × 2 ANOVA including eccentricity (central or peripheral), polar angle (upper or lower visual field), and MT+ region (dorsal or ventral). Both MT+ regions were more strongly coupled with the lower visual field V1 seed regions than the upper visual field V1 seed regions (P < 0.001). Furthermore, dorsal MT+ was more strongly coupled with peripheral V1 than central V1 (P < 0.001), whereas ventral MT+ was more strongly coupled with central V1 than peripheral V1 (P < 0.05). These results suggest the topographic pathways between V1 and the MT+ complex are largely consistent with the visual field representations of the two areas.
Since V1 is a relatively large structure compared with MT+, to ensure the results were robust to the particular choice of the V1 seed regions, fcMRI maps were produced of the aMT+, MT+d, and MT+v regions computed using the replication data set (Fig. 23). By all accounts, V1 is functionally coupled to MT+, whereas aMT+ shows minimal coupling, leading to their separation into distinct networks in the cortical parcellation.
Fig. 23.
Functional connectivity maps of MT+ reveal topographic organization. Functional connectivity maps of aMT+, MT+v, and MT+d were computed using the replication data set and are shown with views focusing on V1. V1 shows little or no correlation to aMT+ but strong correlations with both MT+ seeds. In both MT+ fcMRI maps, there is stronger correlation with dorsal V1 (lower visual field) than ventral V1 (upper visual field). There is also increasing correlation with central V1 as we proceed from MT+d to MT+v. The yellow line denotes the areal boundary of V1.
Visual association and parietal association cortices.
Moving up the sensory-motor pathway, the functional connectivity of MT+ and aMT+ with parietal and frontal cortices was next examined. Figure 24 shows the fcMRI maps of MT+ and aMT+ seed regions computed using the replication sample with views focusing on the parietal and lateral frontal cortices. In the parietal lobe, both MT+ and aMT+ demonstrated correlation with the superior parietal lobule (SPL) and intraparietal sulcus (IPS) but little or no correlation with the inferior parietal lobule (IPL). In the frontal cortex, correlations were mostly limited to the precentral sulcus and gyrus. Compared with the MT+ seed region, the aMT+ seed region demonstrated stronger correlation with the parietal and frontal cortices. The MT+ and aMT+ seed regions were also maximally correlated with different parts of the parietal and frontal cortices, suggesting differential influence on nearby regions of sensory-association cortex.
To quantify the pattern of differential functional coupling, we computed the correlation of the MT+ and aMT+ seed regions with four visual, four parietal, and two frontal cortical regions (Fig. 25A). Two of the visual cortex regions, V1cd and V1pd, were previously used in the V1-MT+ connectivity analysis. V3A and V4 were selected on the basis of their high correlation with MT+ in the discovery sample and named using the approximate map of human visual areas (Van Essen 2004) as reference. The four parietal regions were chosen at or near the IPS. Three of the parietal regions (IPS2, SPL7A, and SPL7P) were selected on the basis of a meta-analysis of fMRI literature of tasks that reportedly activate the human homologs of macaque areas AIP (anterior intraparietal), LIP (lateral intraparietal), and PIP (posterior intraparietal), respectively. The final parietal region, IPS3m, was selected using the discovery sample to be physically between IPS2 and SPL7A. The parietal regions were labeled on the basis of their proximity to the probabilistic histological maps. In particular, IPS2 is at or near area hIP2 at the anterior most part of IPS (Choi et al. 2006), whereas SPL7A and SPL7P are at or near areas 7A and 7P of the SPL (Scheperjans et al. 2008a; 2008b). Finally, IPS3m is on the medial wall of IPS at or near area hIP3 (Scheperjans et al. 2008a; 2008b). The dorsal frontal region, putatively FEF, was selected on the basis of the meta-analysis of fMRI literature of saccade tasks. The ventral frontal region PrCv (precentral ventral) was selected on the basis of its high correlation with aMT+ in the discovery sample. The locations of the visual, parietal, and frontal regions are reported in Table 2. Table 3 summarizes the set of fMRI studies used to derive the coordinates of IPS2, SPL7A, SPL7P, and FEF.
Figure 25B shows the polar plots of the regional correlations using the replication sample. To ensure that the results were not the result of overt eye movements, the polar plots were also replicated using the task effect data set in Fig. 25, C and D. In all cases, MT+ had significantly stronger correlation with early visual cortex compared with aMT+. In contrast, aMT+ had significantly stronger correlation with the parietal and frontal regions compared with MT+. MT+ and aMT+ are strongly coupled to one another (r = 0.30 in the replication sample). Thus consideration of functional coupling between these regions in detail suggests that early visual areas are coupled to regions at or near MT+, which are in turn directly (or indirectly through intermediate regions, such as aMT+) coupled to parietal and frontal regions associated with sensory-motor integration. The differential coupling of MT+ and aMT+ resulted in their inclusion into distinct cortical networks.
Frontoparietal interactions.
We next considered the differential functional coupling of FEF and PrCv with the parietal cortex. Figure 26 shows the fcMRI maps of FEF and PrCv computed using the replication sample. Although both FEF and PrCv demonstrated strong correlation with the SPL and IPS, differences in correlation patterns also emerged. Specifically, PrCv was strongly correlated with more ventral portions of rostral SPL and IPS, whereas FEF was strongly correlated with caudal SPL and IPS. To quantify this phenomenon, we computed the correlation of FEF and PrCv with five parietal regions at or near SPL and IPS. Four of the parietal regions (IPS2, IPS3m, SPL7A, and SPL7P) were the same as those used in the previous analysis. With the use of the discovery sample, a fifth parietal region was selected on the lateral wall of rostral IPS, within what is often termed the frontoparietal control network (orange; Fig. 11). Since the region was located at or near the histological map of hIP1 (Choi et al. 2006) projected to FreeSurfer space, we labeled the seed IPS1. The regions are displayed in Fig. 27A, and their coordinates are reported in Table 2.
Fig. 26.
Differential connectivity of dorsal and ventral caudal frontal cortex with SPL and IPS. Functional connectivity maps of frontal eye field (FEF) and precentral ventral frontal region (PrCv) were computed using the replication data set and are shown with view focusing on parietal cortex. Both FEF and PrCv demonstrate strong correlation with SPL and IPS. PrCv is more strongly correlated with ventral portions of rostral SPL and IPS, whereas FEF is more strongly correlated with caudal SPL and IPS.
Figure 27B shows the correlation of FEF and PrCv with the five parietal regions computed in the replication sample, arranged in rostral (lateral) to caudal (medial) order. The rostrolateral IPS regions (IPS1, IPS2, and IPS3m) were more strongly correlated with PrCv than FEF, whereas the mediocaudal SPL regions (SPL7A and SPL7P) were more strongly correlated with FEF than PrCv. A 2 × 5 ANOVA including frontal regions (FEF and PrCv) and parietal regions (IPS1, IPS2, IPS3m, SPL7A, and SPL7P) found a significant interaction (P < 0.001). In particular, FEF was more strongly correlated with the three IPS seeds (all P < 0.001), whereas PrCv was more strongly correlated with SPL7A and SPL7P (both P < 0.001). These results reveal differential coupling between distinct parietal and frontal regions, likely reflecting multiple pathways involved in sensory-motor integration (Kurata 1991; Rizzolatti et al. 1998; Tanné-Gariépy et al. 2002).
Hierarchical analysis.
Assuming a visual hierarchy similar to that proposed by Maunsell and Van Essen (1983) exists in human cerebral cortex, V1 is expected to be near the bottom of the hierarchy and FEF to be near the top (also see Felleman and Van Essen 1991; Ungerleider and Desimone 1986). Although there are uncertainties as to the exact homologies of our MT+ and aMT+ seed regions, they are likely to be in the middle of the hierarchy with aMT+ higher than MT+. In our analysis, we found that V1 and MT+, which are close together in the hierarchy, have stronger correlation than V1 and aMT+, which are farther apart in the hierarchy (Figs. 22 and 25). We also found that aMT+ and FEF, which are closer in the hierarchy, have stronger correlation than MT+ and FEF, which are farther apart in the hierarchy (Figs. 24 and 25).
These results suggest that correlation between regions in the visual hierarchy may provide some insight into the organization of the pathways. To explore this hypothesis, we examined the arrangement of six seed regions (V1pd, V3A, MT+, aMT+, SPL7A, and FEF) discussed earlier based on the assumption that stronger correlations are consistent with closer positioning in the processing hierarchy. By examining alternative arrangements of regions, the analysis was able to investigate which particular arrangement was most consistent with the functional connectivity pattern. Figure 28 illustrates this approach. Figure 29 shows the two best hierarchical arrangements of the six regions when seeking a five-level hierarchy using the replication sample. In both cases, the relative ordering of the regions within the functional hierarchy agrees well with the previously proposed and refined models of macaque visual hierarchy (Felleman and Van Essen 1991; Maunsell and Van Essen 1983; Ungerleider and Desimone 1986). By contrast, alternative arrangements of the visual areas lead to large proportions of violated constraints (Fig. 29, D and E).
Fig. 28.
Examples of satisfied and violated constraints in estimating the functional hierarchy of cortical regions based on fcMRI. A functional hierarchy is estimated based on the assumption that regions closer in a hierarchy have stronger correlation. A: 5 cortical regions are arranged in a 4-level hierarchy whose functional connectivity strengths satisfy both hierarchical and lateral constraints. B: identical arrangement of 5 cortical regions in a 4-level hierarchy with different functional connectivity strengths that violate both hierarchical and lateral constraints. Thick lines correspond to strong correlations. Thin lines correspond to weak correlations. i: regions a and c are farther apart than regions a and b. In the example in A, correlation of regions a and c is weaker than correlation of regions a and b, so a hierarchical constraint is satisfied. In the example in B, correlation of regions a and c is stronger than correlation of regions a and b, so a hierarchical constraint is violated. ii: regions c and d are on the same hierarchical level. In the example in A, correlation of regions c and e is approximately the same as the correlation of regions d and e, so a lateral constraint is satisfied. In the example in B, correlation of regions c and e is stronger than the correlation of regions d and e, so a lateral constraint is violated. In the context of hierarchy estimation in this article, we consider 2 correlations within 0.2 of each other to be approximately the same when assessing lateral constraints. Given the pairwise correlations of a set of seed regions and a known number of levels in the hierarchy, we can seek the best hierarchical arrangement of the seed regions with the following local optimization procedure: 1) randomly arrange the seed regions into a hierarchy, 2) consider swapping a pair of seed regions or shifting a single seed region to a different hierarchical level without changing the number of levels in the hierarchy such that the proportion of violated constraints is maximally decreased, 3) terminate when no further improvement in the proportion of violated constraints can be achieved, and 4) repeat the preceding steps 20 times, picking the solution with the least proportion of violated constraints. The best solution obtained using this optimization procedure is (in practice) the same as a brute-force search over all possible hierarchical arrangements of the seed regions. We note that we are generally unable to infer the number of levels in the functional hierarchy, since the number of possible constraints can be drastically different for hierarchies with a different number of levels, and so the proportion of violated or satisfied constraints is not comparable across hierarchies with different levels. In practice, however, the solution space is robust; for example, the best solution for a 5-level hierarchy typically differs from the best solution for a 4-level hierarchy by the collapsing of regions from 2 adjacent levels into 1 level. Uncovering the true hierarchical structure in the macaque visual hierarchy based on anatomical connectivity has also proved to be problematic (Hilgetag et al. 1996).
Fig. 29.
Functional connectivity estimates of the hierarchical organization of a canonical sensory-motor pathway. A: 6 seed regions arranged into a 5-level functional hierarchy using the replication data set. B and C: 2 best hierarchical arrangements of the seed regions as measured by the proportion of violated hierarchical and lateral constraints. A violation occurred when the ordering placed more strongly correlated regions farther apart in the hierarchy than more weakly correlated regions (see Fig. 28). D and E: 2 poor hierarchical arrangements of the seed regions as measured by the proportion of violated hierarchical and lateral constraints. Relative ordering of the seed regions (A and B) within the functional hierarchy agrees well with the proposed macaque visual hierarchy (see text).
Control analyses using the discovery set show that the fcMRI strengths of all pairs of the six seed regions are inversely correlated (r = −0.78, P < 0.001) with respect to the hierarchical distance between the regions in the hierarchy as defined by Felleman and Van Essen (1991). By contrast, the fcMRI strengths of all pairs of the six seed regions are not correlated (P = 0.23) with respect to the physical distance between the seed regions. These results suggest that spatial proximity does not explain these correlations; rather, the pattern of correlations reflects relative positions of regions within the hierarchy.
These findings converge on two main results. First, there are functional interactions between networks, but the interactions are selective. V1 shows minimal coupling with association regions within parietal cortex, but it does couple with MT+. The between-network interactions also do not typically violate the network organizations revealed earlier by the clustering approaches: regions show stronger functional coupling to other regions within their network as contrast to regions outside their network. Second, when examined together, the pattern of correlations between regions in different networks is consistent with a hierarchical organization by which sensory information could influence regions associated with motor control (Fig. 29).
Parietal and Prefrontal Association Cortices Possess Multiple Regions With Distinct Connectivity Profiles
The above analyses describe separate sensory and motor networks and address the question of how sensory and motor networks might interact through intermediate areas such as aMT+. However, these networks make up only a minority of the human cerebral cortex. Networks of widely distributed regions comprise the majority of the human cerebral cortex as illustrated by the violet, orange, and red networks in the 7-network solution (Fig. 11). The network complexity expands when the 17-network parcellation is considered (Fig. 13). These association networks are the remaining focus of our results. First, we examined the topography of parietal and frontal association cortices to quantitatively illustrate that multiple neighboring regions possess markedly different functional connectivity fingerprints. Next, we explored the relations between distributed regions to demonstrate that the association cortex comprises multiple, interdigitated association networks.
Parietal association cortex.
The basic approach employed to characterize the connectivity properties of parietal cortex was to extend the strategy applied in Fig. 25 to construct polar plots that quantify coupling with multiple, distributed cortical regions. Following the work of Passingham et al. (2002), we refer to these plots as “functional connectivity fingerprints” with the idea that the graphical representation will facilitate the visualization of similarities in connectivity properties between regions as well as any differences that make them unique. The plots are quantitative in that eccentricity displays the strength of functional coupling between each seed region and a single target region.
For this analysis, multiple regions within parietal cortex were selected to cover the IPL and immediately adjacent portions of the SPL. Regions were further selected to survey distinct networks as revealed by the clustering maps. Some of the regions were used previously in the sensory-motor pathway analysis (IPS2 and SPL7A). Other regions (PF, PGa, IPS3l, PGpd, and PGpv) were selected using the discovery data set and then labeled according to the probabilistic histological maps. In particular, the PF and PGa seed regions were at or near human inferior parietal areas PF and PGa, respectively (Caspers et al. 2006, 2008), whereas the IPS3l seed region was on the lateral lip of the IPS at or near human hIPS3 (Scheperjans et al. 2008a; 2008b). PGpd and PGpv corresponded to the dorsal and ventral aspects of area PGp in the IPL, respectively (Caspers et al. 2006, 2008). One additional seed region at or near the temporoparietal junction (TPJ) was selected based on the peak coordinates reported in a human fMRI study of mental state inference (Saxe and Powell 2006), which accords well with the predicted mean peak in a recent meta-analysis on the same topic (Van Overwalle and Baetens 2009).
Twenty-two cortical target regions were distributed over the lateral and medial aspects of the cerebral cortex such that multiple regions covered each association network. Four of the cortical regions (aMT+, MT+, FEF, and PrCv) were used previously in the sensory-motor pathway analysis. Many labels for the frontal seed regions reflect gross anatomical landmarks, because atlas-based human histological references were not available; subscripts denote relative positions. It is worth noting that target region 6vr+ was selected to be anterior to the map of premotor area 6 (Geyer 2004) and labeled to reflect a new delineation of the ventral precentral sulcus (Amunts et al. 2010). Target region PFCv fell within the histological map of BA45 (Amunts et al. 1999). The coordinates of the parietal seed regions and cortical target regions are reported in Table 4.
The results are illustrated in Fig. 30. Parietal association cortex comprises multiple regions that can show similarities but often display markedly different functional connectivity fingerprints. Visual inspection of the plots allows appreciation of the resemblance of correlation patterns for parietal seed regions that cause them to fall within common networks. For example, the PGpd, PGpv, and TPJ seed regions all fall within the default network as defined in the extant neuroimaging literature. Their connectivity fingerprints are largely defined by their correlations with other association and limbic regions, and near complete absence of correlations with visual regions including MT+ and aMT+. This general fingerprint pattern can be directly contrasted with parietal regions such as those represented by IPS2 and SPL7A that are associated with distributed cortical regions linked to sensory and motor function (e.g., strong correlations with MT+ and aMT+). These distinct parietal regions (IPS2 and SPL7A) are likely at or near the putative human homologue to macaque AIP and LIP and fall within the functional network that has been discussed as the dorsal attention network in the human literature and described in detail in Figs. 22–29.
Fig. 30.
Adjacent parietal regions exhibit distinct functional connectivity fingerprints. Correlations of 8 parietal seed regions (center) with 22 cortical target regions (top) from the replication data set, displayed as polar plots. Colors represent the 7-network segmentation (from Fig. 11). The coordinate locations are reported in Table 4. Parietal seed regions that belong to the same network (e.g., TPJ, PGpv, and PGpd) have generally similar functional connectivity fingerprints that are distinct from other parietal seed regions. Close inspection of the polar plots reveals distinct connectivity fingerprints even for parietal regions within the same network, some of which anticipate the further fractionation of the parietal cortex in the 17-network estimate (Fig. 13). Note that the cortical targets from anterior cingulate cortex to pCun on the left side of the polar plots are the same as that of the frontal polar plots (see Fig. 31) to allow for comparison across the 2 sets of polar plots. The remaining cortical targets are different across the 2 sets of polar plots but are arranged so that cortical targets at the same location in the polar plots belong to the same network in the 7-network estimate. The polar scales range from r = −0.4 (center) to r = 0.5 (outer boundary) in 0.3-step increments.
There are also subtle differences across regions that fall within the same broad networks. For example, whereas parietal seed regions TPJ, PGpv and PGpd are strongly correlated with posterior cingulate cortex (PCC) and the precuneus (pCun), PGpv has comparatively stronger correlation to retrosplenial cortex (RSP) and parahippocampal complex (PHC). In contrast, TPJ has the strongest correlation with posterior superior temporal sulcus (STSp) and lower correlation with RSP and PHC. PGpd has the strongest correlation with medial prefrontal cortex (PFCm). These differential correlations account for the fractionation of the posterior IPL into three components in the 17-network estimate (Fig. 13) and may be important to the functional properties of the region.
Frontal association cortex.
Analysis of frontal association cortex applied the same approach as for parietal association cortex. The eight frontal seed regions selected for analysis were among the cortical targets in the parietal plots discussed previously. The 22 cortical target regions selected for analysis were distributed throughout the cortex and selected so that multiple target regions covered each association network. Eleven regions were carried forward from the previous analysis of the parietal cortex (e.g., IPS2, SPL7A, FEF, PrCv, aMT+, and MT+), and these were arranged in the same spatial locations in the polar plots (anterior cingulate cortex clockwise to pCun). The remaining 11 cortical target regions were unique to analysis of frontal cortex but were arranged in the plots so that cortical target regions at the same location in the polar plots belonged to the same network in the 7-network estimate. The arrangement of the cortical target regions therefore facilitates the comparison of polar plots across the parietal and frontal figures. The coordinates of the frontal seed regions and cortical target regions are reported in Table 4.
Figure 31 shows the polar plots of correlations for the 8 frontal seed regions with the 22 target regions in parietal, temporal, frontal, and cingulate cortices. Many of the same properties observed for parietal association cortex are again apparent. Figure 31 demonstrates that frontal seed regions in the same network generally share similar functional connectivity fingerprints that are distinct from those of neighboring seed regions belonging to a different network. A simple posterior-to-anterior hierarchy is not present as might be expected from some models of frontal hierarchy based on anatomical connectivity (e.g., Petrides 2005). Rather, regions with similar functional connectivity fingerprints appear at posterior and anterior locations as evidenced by PFCda, which is considerably rostral to most of its partner regions, and PFCdp which is considerably caudal to its partner regions.
Fig. 31.
Adjacent frontal regions exhibit distinct functional connectivity fingerprints. The format and plotting are the same as for Fig. 30 with regions tailored for exploration of frontal cortex. The coordinate locations are reported in Table 4. The polar scales range from r = −0.4 (center) to r = 0.5 (outer boundary) in 0.3-step increments.
The arrangement of the cortical target regions also allows a key feature of connectivity to be appreciated when frontal region (Fig. 31) is directly compared with parietal region (Fig. 30): parietal and frontal seed regions from the same network, for instance, PGpd and PFCm, have similar functional connectivity fingerprints. These similarities suggest that association cortex is made of parallel interdigitated networks of regions consistent with suggestions based on double-labeling analyses of monkey association cortex (Goldman-Rakic 1988; Selemon and Goldman-Rakic 1988). In our final analysis, we explored this possibility directly by comparing functional connectivity maps for multiple seed regions distributed across each association network.
Association Cortex Comprises Multiple, Interdigitated Large-Scale Networks
The parcellations derived from clustering suggest that there are multiple, large-scale networks interdigitated throughout association cortex. Thus components of the green, violet, orange, and red networks in the 7-network estimates are spatially adjacent in the parietal, temporal, and frontal cortices (Fig. 11). A similar organization is observed in the 17-network estimate (Fig. 13). However, such an impression could be an artifact of the winner-take-all implementation of clustering that assigned each cortical vertex to a single network. The complex functional connectivity fingerprints demonstrated that regions within the same networks showed similar functional connectivity fingerprints even when distributed across the cortex, consistent with their inclusion in common networks, but also revealed differences between regions that suggest subtler organizational properties. In our final analysis, we sought to explore patterns of functional connectivity using an exclusively seed-based approach in a comprehensive manner to contrast connectivity patterns for multiple regions embedded within the same networks.
For this analysis, six left hemisphere seed regions from each of the four major association networks were analyzed beginning with the canonical sensory-motor network (known as the dorsal attention network in human neuroimaging literature). The ventral attention, frontoparietal control, and default networks were subsequently explored. These four networks were identified in the 7-network estimate based on the discovery data set. Where possible, we used the same seed regions as used for the other analyses in this article. For this reason, the selected regions were not always the most confident in terms of network assignment as assessed by their silhouette plots or other means. Table 5 reports the coordinates of the seed regions.
The left hemisphere fcMRI maps of the seed regions were computed using the replication data set and are illustrated in Figs. 32–35. Each seed region is functionally coupled primarily to regions within the same network, thus largely confirming the 7-network estimate and the existence of multiple, large-scale distributed networks in human association cortex. The network patterns were even reproduced when target regions were isolated in relation to adjacent cortical regions (e.g., Fig. 33A). Thus this verifies that the networks identified via clustering capture the predominant functional coupling patterns within association cortex. Note that this result is not obligated; the maps derived from the analysis of seed regions are not constrained to respect the borders of the networks defined by clustering. Furthermore, although the broad patterns confirmed the boundaries of the networks as expected, several exceptions were also observed.
Fig. 32.
Functional connectivity for regions within the canonical distributed cortical network. This network is often called the dorsal attention network. The 6 seed regions are displayed in the center overlaid on top of the 7-network parcellation from Fig. 11. The coordinate locations are reported in Table 5. Each panel A–F displays the functional connectivity map for 1 of the 6 seed regions for the replication data set overlaid on a surface that shows the 7-network boundaries (in light black lines) as reference. Each seed region displays functional coupling with all of the regions of the distributed network. However, there are important differences between regions. In particular, the regions near aMT+ (D) and SPL7A (C) show strong functional coupling with earlier visual areas. The region at or near the putative homolog of FEF (A) shows minimal functional coupling with earlier visual areas but does show strong coupling with midline motor regions (see midline section of A). The color scale (bottom) shows the plotted correlation range for the maps.
Fig. 33.
Functional connectivity for distributed regions within a second large-scale association network. This network is often called the ventral attention network (but see Fig. 12 legend). The format and plotting are the same as for Fig. 32, and coordinate locations are reported in Table 5. Each seed region is functionally coupled mostly with regions within the same network, revealing that each component of the network recapitulates the others. There is a general absence of cross talk between networks except for local correlation around the seed regions.
Fig. 34.
Functional connectivity for distributed regions within a third large-scale association network. This network is often called the frontoparietal control network. The format and plotting are the same as for Fig. 32, and coordinate locations are reported in Table 5. In addition to a general absence of cross talk between networks, this network also shows no functional coupling to sensory and motor regions. Rather, its topography reveals a distributed network that is interdigitated with the networks illustrated in Figs. 32, 33 and 35.
Fig. 35.
Functional connectivity for distributed regions within a fourth large-scale association network. This network makes up the prominent components of the network often called the default network. The format and plotting are the same as for Fig. 32, and coordinate locations are reported in Table 5. Each seed region is functionally coupled mostly with regions within the same network, again revealing that each component of the network recapitulates components the remaining network, with some exceptions. For example, the seed region in the parahippocampal cortex (E) shows functional connectivity with the retrosplenial cortex, ventral medial prefrontal cortex, and a specific region with the caudal IPL. These patterns of functional connectivity lead to the fractionation into subnetworks as illustrated in Fig. 13. The fractionation of this particular network is largely to subdivide the broader network, rather than to display functional coupling with regions in distinct networks.
Close inspection of the maps (Figs. 32, 33, 34, and 35) reveals evidence for cross talk among the networks, consistent with the earlier analyses of the canonical sensory-motor pathway. For example, Fig. 32, C and D, suggests interaction between the dorsal attention network and regions within the visual system, possibly related to the previously described hierarchical flow of information within the sensory-motor pathway (Fig. 29). In contrast, Fig. 32F suggests functional coupling between the dorsal attention and the frontal components of the frontoparietal control and ventral attention systems.
A further observation is that the fcMRI maps of seed regions chosen from the same network anticipate fractionation of the networks in ways also suggested by the analysis of connectivity fingerprints. For example, the PHC seed region is strongly coupled with the RSP but not with the full extent of the posterior cingulate (Fig. 35E). It is also strongly coupled to the IPL but not the anterior IPL. This suggests that the 7-network estimate is likely insufficient to capture the full complexity of the functional couplings across different brain regions. As predicted by the fcMRI map of the PHC seed, the 17-network estimate differentiates the posterior IPL, RSP, and the posterior PHC into an IPL-RSP-PHC system (dark blue in Fig. 13) distinct from the other regions of the default network.
These collective results thus illustrate patterns of connectivity that are largely captured by a relatively small number of interdigitated, large-scale networks but also reveal more detailed properties that suggest cross talk and fractionation within the major networks.
DISCUSSION
The present results suggest association cortex comprises the majority of the human cerebral mantle and is made up of multiple, interdigitated association networks. The properties of association networks were found to be quite different from that of sensory and motor cortices. Sensory and motor areas are embedded within cerebral networks that are organized in a topographic fashion forming preferentially local networks, meaning that adjacent areas tend to show strong functional coupling with one another. Hierarchical relations progress from early visual areas to premotor areas. By contrast, multiple association networks involve areas distributed throughout the cortex, always including discrete regions within prefrontal, parietal, temporal, and midline cortices. These distributed association networks are interdigitated in a manner that yields complex zones, particularly in parietal and prefrontal association cortices. Within these zones, nearby regions possess markedly different connectivity patterns that can be explained by their being embedded within distinct association networks. In the following sections we explore the details of these patterns and discuss what the connectivity patterns suggest about how the human cerebral cortex may have expanded during evolution.
The Cerebral Cortex Comprises Multiple, Distinct Functionally Coupled Networks
A primary result of our analyses is the cerebral maps depicted in Figs. 11 and 13. Figure 11 displays a coarse parcellation of the cerebral cortex into 7 functionally coupled networks, and Fig. 13 displays a finer parcellation into 17 networks. These maps represent our current best estimate of the organization of the human cerebral cortex based on fcMRI. The large number of contributing subjects (N = 1,000) and surface-based alignment procedures helped to detect topographical details with considerable confidence. However, these maps are still limited in resolution owing to between-subject averaging and the acquisition resolution of the data and will presumably be improved in the future. At their present resolution, they have been surprisingly informative for providing insights into cerebral organization and, as illustrated by our companion paper (Buckner et al., in press), they also provide a basis to explore the organization of subcortical structures.
Two broad properties are immediately apparent when examining the maps, which are the focus of discussion. First, somatomotor and visual cortices form their own networks in the coarse parcellation that are fractionated into subnetworks in the finer parcellation. The fractionations do not follow simple divisions such as between somatosensory and motor areas along the central sulcus or between early (e.g., V1) and late (e.g., V3) retinotopic visual areas in the occipital cortex. We discuss hypotheses about what these fractionations might represent below. Second, association cortex comprises multiple, interdigitated networks that are distributed throughout cortex. Multiple aspects of these networks, in particular the properties of the coarse networks displayed in Fig. 11, have previously been described using seed-based (e.g., Biswal et al. 1995; Greicius et al. 2003; Fox et al. 2006; Vincent et al. 2006) and independent component analysis approaches (e.g., Beckmann et al. 2005; Damoiseaux et al. 2006; De Luca et al. 2006). Many aspects of the organization, especially within the higher resolution parcellation (Fig. 13), are novel. We discuss the details of the organization of association cortex below with particular focus on zones of parietal and prefrontal cortices that represent nexuses of convergence among multiple, distinct networks.
Visual Cortex Displays Local, Topographically Organized Functional Coupling
Early visual areas were strongly functionally coupled to one another and only minimally correlated to regions outside of visual cortex. Examining the coupling properties more closely reveals evidence for an intrinsic gradient within the early visual cortex that likely corresponds to the transition from the central to peripheral visual field representations (Figs. 15–17). The division is not absolute (Fig. 18) but appears as an abrupt division into central and peripheral networks when assignments into distinct networks are forced, providing a convenient way to map the topographical organization across visual areas. Inspection of the boundaries of the functionally coupled networks on visual areas suggests that the division of lower visual areas into central and peripheral components might extend to higher visual areas. The ventral boundary of the central and peripheral visual systems continued outside the V1-V3 complex and divided V4v in two. Since the eccentricity representation of the V1-V3 complex is continuous through V4v (Brewer et al. 2005; Hadjikhani et al. 1998), it is likely that V4v was also divided into central and peripheral components. Anterior to V4v, at least two hemifield maps have been found, all of which have a distinctly large foveal representation, respond strongly to central visual stimuli throughout their extent (Brewer et al. 2005; Wandell et al. 2005), and are therefore consistent with the inclusion of these regions within the central visual system (but see Hadjikhani et al. 1998).
However, there were inconsistencies as might be expected because of limited resolution and the inherent complexity of the visual cortex (see Wandell et al. 2007 for a review). Multiple hemifield maps have been found in the extrastriate cortex lateral to the V1-V3 complex (DeYoe et al. 1996; Larsson and Heeger 2006; Tootell and Hadjikhani 2001), such as regions that are part of the object-selective lateral occipital complex (LOC; Malach et al. 1995) and motion-selective area MT+ (Huk et al. 2002; Malikovic et al. 2007; Tootell and Taylor 1995). The inclusion of these entire visual regions within the “central” visual system suggests a violation of the central-peripheral division in these areas, although we note that the ventral visual stream (of which human LOC is a part) is dominated by signals from the fovea in the macaque monkey (Baizer et al. 1991). The dorsal boundary of the central and peripheral visual networks continued outside the V1-V3 complex and cut through the hemifield maps dorsal and lateral to V3v, possibly including V3A, V3B, and V7 (Larsson and Heeger 2006; Swisher et al. 2007; Tootell et al. 1998). Because these regions have separate foveal representation from the V1-V3 complex (Wandell et al. 2007), and because of the complex trajectory of the boundary through these regions, we were unable to judge whether the central-peripheral division applied to these regions.
The central-peripheral functional coupling of the human visual system is consistent with many aspects of known anatomy. Anatomical studies in nonhuman primates have shown that the topography of connections between visual areas generally respects the visual field representation (Cragg 1969; Maunsell and Van Essen 1983; Van Essen and Zeki 1978; Zeki 1969). For example, a region of V1 that responds strongly to a particular eccentricity and polar angle will project to the region of V2 that responds strongly to the same eccentricity and polar angle, presumably because of feedforward input (Van Essen and Zeki 1978). Because of the larger receptive field size of neurons in V2, the degenerated target area tends to be larger than that of the source lesion. Our result of higher functional connectivity strength between V1c and V3c (as well as between V1p and V3p) than between V1c and V1p may reflect the topography of anatomical connections within the visual system.
If anatomical connectivity respects visuotopic representation and functional connectivity is constrained by anatomical connectivity, the question then arises as to why the clustering analysis divided the visual areas (especially the lower visual areas) into central and peripheral regions, rather than into upper and lower visual fields. A split along the eccentricity axis is supported by proposals that higher visual areas are organized according to central vs. peripheral field bias (Baizer et al. 1991; Grill-Spector and Malach 2004; Levy et al. 2001), although such an organization has also been disputed (Wandell et al. 2005, 2007). A more mundane and likely reason is that eccentricity representation runs in parallel across multiple visual areas in contrast with angular representation that alternates in visual field sign across multiple visual areas (see Fig. 1 in Larsson and Heeger 2006; Sereno et al. 1995). Because this study utilized smoothing and intersubject averaging to boost SNR, any topography in functional connectivity that respects the high spatial frequency of angular representation is likely to be washed out. The resulting limitation in spatial resolution might also explain why visual regions dominated by foveal signals are grouped entirely within the central visual system even though they possess quarterfield or hemifield representations spanning both central and peripheral vision.
Together, these observations suggest that functional connectivity of the visual cortex followed the topographic organization of these areas up to a point. Certain observations, such as the lack of functional connectivity topography reflecting angular visual representation, could not be reconciled with prior anatomical observations. These differences may reflect the limitations of our approach, true differences between fcMRI and anatomical connectivity, or novel connectivity findings that have yet to be revealed in anatomical studies. We discuss these limitations and ambiguities later.
Somatomotor Cortex Displays Topographical Organization
Estimates of functional connectivity networks grouped multiple somatosensory and motor areas into a single functionally coupled network for the low-resolution estimate of cortical organization (Fig. 11) and into a dorsal-ventral division for the high-resolution estimate (Fig. 13).4 Like visual cortex, the somatomotor network was characterized by its strong functional coupling to nearby areas but absence of functional coupling to distributed regions across the cortex (barring regions across the insular cortex). Even when regional analyses were explored that did not constrain the topography to form separate networks, no evidence was found for functional coupling to distributed cortical regions. Figure 19 shows that the motor component of the somatomotor network included MI (area 4) and caudal premotor area 6, whereas the somatosensory component included SI and most, if not all, of early somatosensory area 5L. The somatomotor network also included a small portion of the midcingulate sulcus and possibly part of area 5M. Within the somatomotor cortex of nonhuman primates, areas 1 to 6 are densely, but not fully, connected (see meta-analysis in Felleman and Van Essen 1991) by association fibers that enter the white matter and reenter the cortex (Jones et al. 1978).
The nonhuman primate premotor area 6 has been subdivided into rostral and caudal areas that may provide further insight into the functional connectivity patterns (Barbas and Pandya 1987; Matelli et al. 1985, 1991; Zilles et al. 1995). The caudal premotor areas are densely and topographically connected to M1 but not to the prefrontal cortex. In contrast, the rostral premotor areas are connected to prefrontal cortex but not M1 (Barbas and Pandya 1987; Luppino et al. 1993; Matelli et al. 1986). The caudal premotor areas are also more densely connected to each other than the adjacent rostral premotor areas. Although there are competing hypotheses over the exact homology between primate and human premotor areas (Geyer 2004; Petrides 2005; Rizzolatti et al. 1998), converging studies have suggested a rostrocaudal subdivision of human premotor cortex (see chapter 4.4 of Geyer 2004 for a review), which might reflect the absorption of caudal human area 6 into the somatomotor network as revealed by functional coupling. Despite evidence that the early somatosensory and late motor fields are densely integrated, we must be cautious of the possibility of fMRI signal blurring across the central sulcus, which may cause an overestimation of functional coupling between the parallel strips of SI, MI, and premotor area 6.
Of most interest, the analysis also revealed a dorsoventral division of the somatomotor strip, which was confirmed by targeted regional analyses (Fig. 20). In nonhuman primates, the connections between the different somatosensory-motor areas are generally topographic so that, for example, the hand region of area 2 receives projections from the hand region of areas 3 and 1 (Pons and Kaas 1986). In addition, the somatomotor association fibers have been reported to terminate in mediolaterally oriented strips (see for example Fig. 4 in Jones et al. 1978; Jones and Wise 1977), although others have raised questions concerning the striplike nature of callosal connections (Gould et al. 1986; Killackey et al. 1983). Our observations of fcMRI correlations within the human somatomotor cortex, whose anteroposterior extents were shorter than their mediolateral extents, were therefore consistent with the observations of ipsilateral striplike anatomical connections. One possibility is that the dorsoventral boundary revealed by our clustering analysis might correspond to the boundary of the face and body representations.
Evidence for a Prototype Distributed Cortical Pathway
The results discussed above reveal interesting organizational properties of local networks of areas within somatomotor and visual cortices. In considering the organization of the cerebral cortex, an immediate question arises as to how information in the sensory systems might propagate to influence motor representations. Functional connectivity is limited in its ability to provide insight into this question, but some aspects of the results are informative and consistent with anatomical and physiological studies of sensory-motor pathways.
The canonical sensory-motor pathway that has been studied in the monkey is the pathway that includes retinotopic visual cortex, the MT+ complex, parietal area LIP, and the FEF (e.g., Andersen et al. 1990; Colby and Goldberg 1999; Gold and Shadlen 2007; Shadlen and Newsome 2001). The basic idea is that incoming visual information propagates from early visual areas to MT+, which provides constraints on decision processes that arise from interactions with LIP and FEF. FEF, in turn, interacts with motor regions to generate motor signals. Hierarchical anatomical connections support such a pathway (Felleman and Van Essen 1991; Maunsell and Van Essen 1983). The question here is whether the human functional connectivity results also reveal evidence for such a pathway and, if so, what properties emerge.
Of particular interest are the quantitative results presented in Figs. 22–27 that reveal interactions between distinct networks. Although primary visual cortex is largely absent functional coupling to association or premotor cortices, it is topographically coupled to MT+ (Fig. 22), which is in turn strongly coupled to aMT+ as well as modestly coupled to parietal regions including SPL7A (Figs. 24 and 25). aMT+ is functionally coupled to PrCv and FEF (Fig. 25), completing the pathway. Although the organization of the human MT+ complex is still unresolved, human MT+ is thought to include the human homologs of macaque MT, MST, and FST (Amano et al. 2009; Huk et al. 2002; Kolster et al. 2010). Based on its location, aMT+ might correspond to macaque MST/FST (Maunsell and Van Essen 1983; Ungerleider and Desimone 1986) or TEO/PIT (Felleman and Van Essen 1991; von Bonin and Bailey 1947). Our observation that aMT+ is less correlated with V1 than MT+ (Figs. 22 and 23) is therefore consistent with multiple studies showing that macaque TEO/PIT or MST/FST is less densely connected with V1 compared with MT (Distler et al. 1993; Felleman and Van Essen 1991; Markov et al. 2010). Although there are uncertainties to using functional connectivity to infer hierarchical arrangements among areas, if one uses the simple assumption that the more strongly two areas are functionally coupled together, the closer they are to one another in a processing hierarchy, a sensory-motor processing hierarchy emerges that is consistent with the extant literature (Figs. 28 and 29).
Analysis of interactions among networks illustrates a number of further points. Most critically, the hierarchy across networks reveals how a distributed network might serve as a bridge between sensory and motor networks that themselves possess preferentially local interactions (resulting in their parcellation into their own networks in Figs. 11 and 13). One speculation is that the distributed cortical network illustrated as the green network in Fig. 11, and known within the neuroimaging literature as the dorsal attention system, is the prototype distributed cortical network. It possesses multiple properties that are common to all association networks. Specifically, its component regions are distributed throughout temporal, parietal, and frontal cortices and show strong functional couplings between all pairs of regions (Fig. 32). We speculate that this network is a prototype, because it is more strongly functionally coupled to extrastriate sensory regions and premotor regions than the remaining association networks that are discussed later and also because it is well represented in the macaque. The presence of similar networks in humans and macaques suggests that they are homologous and thus were present in the last common ancestor, which lived about 25–30 million years ago (Pilbeam and Young 2004). As discussed in the next section, the remaining distributed association networks, which in the human represent the majority of association cortex, display the same general organization but appear to have lost direct functional coupling to sensory and motor regions, at least insofar as measured by intrinsic functional connectivity.
Another important feature of this hierarchy is apparent when one considers finer details of the functional coupling patterns. Within the broad hierarchy, there is evidence for specialization indicative of parallel hierarchical arrangements. This is perhaps best illustrated by the differential functional coupling of premotor regions FEF and PrCv with the multiple regions localized around the superior parietal lobule (Figs. 26 and 27). Anatomical tracing work in the macaque has suggested two segregated sensory-motor pathways from parietal cortex to dorsal and ventral aspects of frontal cortex, including premotor cortex (Kurata 1991; Rizzolatti et al. 1998; Tanné-Gariépy et al. 2002) and FEF (Petrides and Pandya 2006; Stanton et al. 1995). These frontoparietal connections have a dorsomedial to ventrolateral axis: dorsal portions of caudal frontal cortex are preferentially connected to medial and dorsal parts of parietal cortex including the superior parietal lobule and medial parietal cortex, whereas caudal ventral frontal cortex preferentially communicates with lateral and ventral aspects of parietal cortex and largely lacks connections with dorsal and medial parietal areas. Our demonstration that PrCv was strongly correlated with more ventral portions of rostral SPL and IPS, whereas FEF was strongly correlated with caudal SPL and IPS (Figs. 26 and 27), is consistent with descriptions of frontoparietal sensory-motor circuits in the macaque. Thus evidence for specialization of subpathways is present in this canonical sensory-motor pathway. Taking the speculation that this canonical pathway represents the prototype distributed association network, it is tempting to wonder whether the interdigitated association networks that comprise the remaining human association cortex are evolutionary expansions of this basic prototype with multiple, interdigitated pathways that have become nearly completely differentiated.
Association Cortices Are Nexuses of Regions With Distinct Connectivity Fingerprints
Association cortex, in particular parietal cortex near the inferior parietal lobule, has been challenging to characterize. Human association cortex shows disproportionate expansion in relation both to macaque and great apes (Preuss 2004; Van Essen and Dierker 2007; Hill et al. 2010). In a few instances, it is an open question as to whether homologies should be expected (Orban et al. 2006). For example, in his seminal work in 1909, Korbinian Brodmann noted that the human inferior parietal lobule included two cytoarchitectonic areas that are absent in the monkey (areas 39 and 40). The possibility that these association areas are vastly expanded in hominid evolution, or are even novel areas altogether, figured prominently in the classic description of disconnection syndromes by Geschwind (1965). For these reasons anatomical connectivity in the monkey cannot uniformly be presumed to apply to the human. Adding further complication, nearby regions of association cortex are often active across quite distinct forms of tasks suggesting functional diversity (e.g., Culham and Kanwisher 2001). As extreme examples of functional diversity, parietal regions near the superior parietal lobule, including those discussed in the preceding section, respond during sensory-motor decision tasks (Corbetta and Shulman 2002). Regions near the temporoparietal junction respond during social tasks that require participants to infer what others are thinking (Saxe 2006; Van Overwalle and Baetens 2009), and regions within the caudal portion of the inferior parietal lobule respond during episodic remembering (Cabeza et al. 2008; Vilberg and Rugg 2008; Wagner et al. 2005).
Our results demonstrate that parietal association cortex includes multiple nearby regions that possess markedly different connectivity profiles that parallel similar distinctions in prefrontal cortex. The results in parietal cortex are anticipated by both anatomical studies in the monkey and prior studies using human functional connectivity. Specifically, the caudal portion of macaque 7a, labeled Opt by Pandya and Seltzer (1982), has connections to the parahippocampal cortex, retrosplenial cortex, and posterior cingulate (Andersen et al. 1990; Lavenex et al. 2002; Seltzer and Pandya 1994; Suzuki et al. 1994). Nearby areas, such as LIP, are preferentially connected to visual association cortex and premotor areas, leading Andersen et al. (1990) to note that “area 7a appears to be very different from other visual areas in the inferior parietal lobule in that it is the only area that connects to some of the highest centers of the brain.” Examination of functional connectivity of parietal association cortex in the human has also revealed notable diversity. Vincent et al. (2006) illustrated that neighboring parietal regions are functionally coupled to distinct sensory-motor and limbic circuits. In later studies, parietal association cortex was found to possess between three (Vincent et al. 2008) and four (Nelson et al. 2010) distinct zones distinguished by their functional connectivity profiles (see also Sestieri et al. 2011).
Differential functional coupling across parietal and prefrontal regions are displayed in Figs. 30 and 31. Drawing from Passingham et al. (2002), we refer to these regional connectivity profiles as fingerprints because they illustrate the connectivity patterns across regions that make them distinct. In examining the many fingerprints, several principles emerge that provide insight into cortical organization. First, nearby regions can show abrupt transitions in their connectivity fingerprints. The transitions from SPL7A to IPS3l and from IPS3l to PGpd are such examples. SPL7A, which may be at or near the human homolog to macaque LIP, is functionally coupled to extrastriate (MT+ and aMT+) and premotor (FEF and PrCv) regions. IPS3l shows a fundamentally distinct connectivity fingerprint with coupling to prefrontal regions that are within dorsolateral prefrontal cortex (PFCl and PFClp) and amodal posterior temporal association regions (ITG). IPS3l is absent coupling to sensory or motor regions. PGpd is distinguished by prominent functional coupling to limbic regions including PCC, RSP, and PHC. This tripartite division separates the major parietal zones that form the dorsal attention, frontoparietal control, and default networks discussed extensively in the human neuroimaging literature (green, orange, and red networks in Fig. 11).
Second, within these broad divisions there are further distinctions that demarcate more subtle regional differences. Across these regions, most connectivity properties are shared, but there are also key differences, forming “connectional families” of regions (see Passingham et al. 2002 for discussion). These differences within connectional families lead to the finer parcellation observed in Fig. 13 and are likely of functional importance. For example, the TPJ and PGpv possess similar connectivity fingerprints, and both fall within the broader network that is globally called the default network. However, the TPJ is preferentially coupled to medial prefrontal regions (PFCdm), the PCC and pCun, and the superior temporal sulcus (STS and STSp). Although PGpv possesses a broadly similar fingerprint, it is also prominently coupled to regions associated with the medial temporal lobe memory system (RSP and PHC). This is of particular interest because both of these parietal association regions have been proposed to be involved with higher mental functions linked to internal mentation and social cognition (see Buckner et al. 2008 for review), but functional distinctions have also been noted (e.g., Rosenbaum et al. 2007).
The final organizational principle that emerges is that association regions belonging to the same connectional families can always be found widely distributed across the cortical mantle. Contrasting the fingerprints of regions within prefrontal cortex (Fig. 31) with those falling within parietal cortex (Fig. 30) illustrates this last principle. PFCdm and TPJ are prime examples. These regions possess nearly the same functional connectivity fingerprints that differ from nearby regions within their own lobes. This accounts for why these distributed regions form such tightly coupled functional connectivity networks and suggests that association cortex might be best conceptualized as a series of interdigitated, distributed networks.
Association Cortex Comprises Multiple, Interdigitated Large-Scale Circuits
The majority of the human cerebral cortex is made up of multiple large-scale networks that include functionally coupled regions distributed across the brain. Such organization is apparent in prior studies (e.g., Beckmann et al. 2005; Damoiseaux et al. 2006; De Luca et al. 2006; Fox et al. 2006; Greicius et al. 2003, 2004; Vincent et al. 2008) and is evident in all of the analyses presented in this article. By analyzing the complete topography of the cortical surface, we were further able to illustrate that the multiple, distributed networks are interdigitated with one another, forming complex convergence zones in parietal and prefrontal association cortices (Figs. 32–35). What do these patterns suggest about the organization of the cerebral cortex?
At the broadest level, these observations emphasize the need to adopt network approaches when exploring cerebral function. By network approach, we refer to the idea that the relevant functional unit may be the interconnected network itself, as suggested by Mesulam (1981, 1986) and Goldman-Rakic (1988). Mesulam (1981) proposed a network approach as an alternative to centrist approaches to localization, in which complex functions relied on specific cortical areas exclusively devoted to that function. While recognizing that functional specializations exist among areas of the same network, the network framework emphasizes that functions arise as emergent properties of these reciprocally connected systems of brain areas (see Fig. 4 of Mesulam 1981, 1990). In other words, distributed systems of areas, spanning different cortical lobes and subcortical structures, form functional units via their dense interconnections. This is a quite different organization than is evident in sensory cortex, which is characterized by dense connectivity among local areas. The two frameworks are not entirely different because all areas are presumably embedded within systems of interacting brain areas; however, the focus in many theories is on processing specialization within areas and processing hierarchies among neighboring areas. The present analyses suggest that functional unit of interest may be the distributed network itself.
Goldman-Rakic (1988) offered three specific anatomical observations that provide evidence for distributed cerebral networks. First, prefrontal and parietal areas that are directly connected to one another also tend to have convergent projections to additional temporal and limbic areas (see Fig. 3 of Goldman-Rakic 1988). Second, interconnected association areas are tied together by common thalamic connections. Third, arguing against a typical hierarchical model of cortical organization, interconnected association areas tend not to have laminar projection patterns with clear feedforward and feedback relations (also see Felleman and Van Essen 1991). We suspect that the distributed networks that comprise the majority of human association cortex are networks of this type: highly interconnected, without strong hierarchical relations among areas, and integrated into a common functional unit of some form. This does not mean that areas within prefrontal and parietal cortices are making the same contributions to the network, but the emphasis does shift to asking how the separate networks make distinct functional contributions, rather than asking how different areas within prefrontal or parietal cortices may be locally differentiated. That is, association cortex is characterized by multiple modules (Bullmore and Sporns 2009) that are each made up of nodes distributed widely across the cortex.
Of further interest, the distributed cerebral networks converge on regions of association cortex that are late to develop in terms of myelination (see Fig. 3 of Catani and ffytche 2005) and cortical surface area (Hill et al. 2010) and are expanded in the human brain relative to the modern macaque brain (Van Essen and Dierker 2007). For these reasons, it is likely that distributed association networks have been under strong selective pressure to expand in recent hominid evolution. The network parcellations presented in Figs. 11 and 13 provide a current best estimate of the organization of the interdigitated networks that comprise human association cortex.
Caveats and Limitations
Measuring functional connectivity is not the same as directly measuring anatomical connectivity. Functional connectivity is constrained by anatomical connectivity (e.g., Honey et al. 2009; Johnston et al. 2008), but those constraints are not restricted to monosynaptic connectivity. For example, functional coupling is present between the two hemispheres for striate cortex in the macaque (Vincent et al. 2007), whereas interhemispheric connections are absent except at the border of V1 (Van Essen and Zeki 1978). The pervasiveness of functional coupling is both a weakness and strength of the technique, because it allows one to map large-scale polysynaptic circuits but leaves ambiguities and uncertainties, which require follow-up by other methods such as diffusion imaging techniques and detailed examination of homologies to nonhuman primates. Cerebrocerebellar circuits are a place that perhaps best illustrates that functional connectivity is constrained by anatomy but is more pervasive than monosynaptic connectivity. Cerebrocerebellar circuits, which are exclusively polysynaptic (Evarts and Thach 1969; Kemp and Powell 1971; Strick 1985), demonstrate functional coupling that tracks the contralateral organization of anatomical projections and is topographically specific as described in our companion paper (Buckner et al., in press). Thus functional connectivity is informative but should not be considered a direct measure of anatomical connectivity. Functional connectivity also appears sensitive to other factors, including recent experience and the state of the subject during scanning (Buckner 2010; Fox and Raichle 2007; Moeller et al. 2009). An assumption made in the present article is that the dominant contribution to the measured correlations reflect stable properties of cortical architecture, an assumption that we believe is warranted but nonetheless needs to be made explicit as boundary conditions and violations of this assumption may emerge.
A further limitation of the present work is resolution. Even at the relatively finer resolution of the 17-network estimate, discrete components of a given network likely span multiple cytoarchitecturally distinct cortical areas. The association networks described in this article are at a coarser resolution than the networks inferred by Goldman-Rakic (1988) and others in the macaque. Our limited data resolution, as a result of voxel size, smoothing, and intersubject averaging, including potential errors in surface-based alignment, may miss important features of the cortical topography, and the results should be interpreted accordingly. Future high-resolution studies of individuals may provide better estimates of cortical topography.
A final limitation is our use of clustering to parcellate the cerebral cortex. The assumption made by the clustering approach is that each vertex belongs to a single network. Our seed-based analyses (Figs. 32–35) suggest that this is a reasonable beginning point for analysis, even though cross talk exists between networks. However, there are specific places where the parcellation results might be particularly sensitive to inaccuracies, including the characterization of cortical regions that serve as putative hubs of communication between networks (Buckner et al. 2009; Hagmann et al. 2008; Mesulam 1998). We also note that the 17-network estimate does not cleanly fractionate individual networks within the 7-network estimate, implying that cortical networks are not spatially organized in a strictly hierarchical fashion (where “hierarchy” refers to the spatial organization of the networks, rather than the concept of “hierarchical processing pathways”) like that suggested in the toy example (Fig. 5). Our efforts to enforce strict subdivisions of coarser networks by using hierarchical clustering (not shown) failed to provide stable results across the discovery and replication data sets. Recent advances in graph theoretic clustering approaches are promising in providing the possibility for regions to belong to multiple networks or communities (e.g., Ahn et al. 2010).
Conclusions
Different regions of the cerebral cortex display distinct characteristics. Functional connectivity of retinotopic visual areas display dense local functional coupling that is organized across areas in a fashion that respects functional topography. Association cortex is made up of multiple, interdigitated large-scale networks that, while exhibiting cross talk, possess predominantly parallel organization. The map of these cerebral networks is provided as a reference for future functional characterization and confirmation by complementary approaches that can directly visualize anatomic connectivity.
GRANTS
This work was supported by National Institutes of Health Grants AG021910, P41RR14074, K08MH067966, P41RR14075, U24RR021382, AG022381, RC1AT005728, R01NS052585, 1R21NS072652, 1S10RR023401, 1S10RR019, 1S10RR023043, and 1R01NS070963, the Massachusetts General Hospital-University of California, Los Angeles Human Connectome Project (U54MH091665), the Ellison Medical Foundation, the Howard Hughes Medical Institute, and the Simons Foundation.
DISCLAIMER
The content is solely the responsibility of the authors and does not necessarily represent the official views of the National Institutes of Health (NIH).
DISCLOSURES
No conflicts of interest, financial or otherwise, are declared by the author(s).
ACKNOWLEDGMENTS
We thank Elizabeth Hemphill, Leah Bakst, and Sara Rubenstein for assistance with data collection; Karl Zilles and Katrin Amunts for the human histological data; Donna Dierker and David Van Essen for help with the Caret software, SumsDB; Doug Greve for help with the FreeSurfer/FsFast software; Simon Eickhoff for help with the SPM Anatomy toolbox; and Avram Holmes, Steve Petersen, Todd Preuss, Roger Tootell, Justin Vincent, and Justin Baker for useful discussion. We thank the Harvard Center for Brain Science Neuroimaging Core and the Athinoula A. Martinos Center for imaging support, and the Harvard Neuroinformatics Research Group (Gabriele Fariello, Timothy O'Keefe, and Victor Petrov). F. M. Krienen was supported by fellowships from the Department of Defense, an Ashford Graduate Fellowship in the Sciences, and the Sackler Scholars Program in Psychobiology.
Footnotes
It is not possible to generate a high-resolution uniform mesh on the sphere. However, one can work with approximately uniform spherical meshes at different spatial resolutions by starting with a regular icosahedron mesh consisting of 20 equal faces and 12 vertices and iteratively subdividing each mesh triangle into 4 smaller triangles. Here each cortical hemisphere is represented by a subdivided icosahedron mesh with 20,480 faces and 10,242 vertices, where neighboring pairs of vertices are on average 3.8 mm apart (maximum = 4.1 mm, minimum = 3.4 mm).
In humans, the MT+ complex is used to denote the putative human homolog of macaque area MT and neighboring visual areas that are sensitive to motion stimuli (DeYoe et al. 1996). Here we are able to constrain the location of MT+ using surface-based histological maps of hOc5, which is thought to be the cytoarchitectonic correlate of the human MT+ complex (Malikovic et al. 2007; Yeo et al. 2010b).
Multiple seed regions are used throughout this article. The abbreviation of the names of these seed regions obeyed the following convention: the suffix following a region indicates relative spatial location within the region, whereas the prefix preceding a region indicates relative spatial location outside the region. Therefore, MT+d is a seed region within the dorsal aspect of the MT+ complex, whereas aMT+ is a seed region anterior to and outside the MT+ complex.
Auditory cortex was also functionally coupled to the ventral somatomotor network. However, as illustrated in Fig. 14, this may be an artifact of signal bleeding across the insula in volumetric space. For this reason, although the finding may reflect a meaningful functional interaction, we do not discuss it further in the present article.
REFERENCES
- Ahn YY, Bagrow JP, Lehmann S. Link communities reveal multiscale complexity in networks. Nature 466: 761–764, 2010 [DOI] [PubMed] [Google Scholar]
- Amano K, Wandell BA, Dumoulin SO. Visual field maps, population receptive field sizes, and visual field coverage in the human MT+ complex. J Neurophysiol 102: 2704–2718, 2009 [DOI] [PMC free article] [PubMed] [Google Scholar]
- Amunts K, Lenzen M, Friederici AD, Schleicher A, Morosan P, Palomero-Gallagher N, Zilles K. Broca's region: novel organizational principles and multiple receptor mapping. PLoS Biol 8: e1000489, 2010 [DOI] [PMC free article] [PubMed] [Google Scholar]
- Amunts K, Malikovic A, Mohlberg H, Schormann T, Zilles K. Brodmann's areas 17 and 18 brought into stereotaxic space—where and how variable? Neuroimage 11: 66–84, 2000 [DOI] [PubMed] [Google Scholar]
- Amunts K, Schleicher A, Bürgel U, Mohlberg H, Uylings HBM, Zilles K. Broca's region revisited: cytoarchitecture and intersubject variability. J Comp Neurol 412: 319–341, 1999 [DOI] [PubMed] [Google Scholar]
- Andersen RA, Asanuma C, Essick G, Siegel RM. Corticocortical connections of anatomically and physiologically defined subdivisions within the inferior parietal lobule. J Comp Neurol 296: 65–113, 1990 [DOI] [PubMed] [Google Scholar]
- Andersen RA, Buneo CA. Intentional maps in posterior parietal cortex. Annu Rev Neurosci 25: 189–220, 2002 [DOI] [PubMed] [Google Scholar]
- Andrews-Hanna JR, Reidler JS, Sepulcre J, Poulin R, Buckner RL. Functional-anatomic fractionation of the brain's default network. Neuron 65: 550–562, 2010 [DOI] [PMC free article] [PubMed] [Google Scholar]
- Baizer JS, Ungerleider LG, Desimone R. Organization of visual inputs to the inferior temporal and posterior parietal cortex in macaques. J Neurosci 11: 168–190, 1991 [DOI] [PMC free article] [PubMed] [Google Scholar]
- Balasubramanian M, Polimeni J, Schwartz EL. The V1-V2-V3 complex: quasiconformal dipole maps in primate striate and extra-striate cortex. Neural Netw 15: 1157–1163, 2002 [DOI] [PubMed] [Google Scholar]
- Barbas H, Pandya D. Architecture and frontal cortical connections of the premotor cortex (area 6) in the rhesus monkey. J Comp Neurol 256: 211–228, 1987 [DOI] [PubMed] [Google Scholar]
- Basser PJ, Mattiello J, LeBihan D. Estimation of the effective self-diffusion tensor from the NMR spin echo. J Magn Reson B 103: 247–254, 1994 [DOI] [PubMed] [Google Scholar]
- Beckmann CF, DeLuca M, Devlin JT, Smith SM. Investigations into resting-state connectivity using independent component analysis. Philos Trans R Soc Lond B Biol Sci 360: 1001–1013, 2005 [DOI] [PMC free article] [PubMed] [Google Scholar]
- Beckmann CF, Smith SM. Probabilistic independent component analysis for functional magnetic resonance imaging. IEEE Trans Med Imaging 23: 137–152, 2004 [DOI] [PubMed] [Google Scholar]
- Bellec P, Rosa-Neto P, Lyttelton OC, Benali H, Evans AC. Multi-level bootstrap analysis of stable clusters in resting-state fMRI. Neuroimage 51: 1126–1139, 2010 [DOI] [PubMed] [Google Scholar]
- Ben-Hur A, Elisseeff A, Guyon I. A stability based method for discovering structure in clustered data. Pac Symp Biocomput: 6–17, 2002 [PubMed] [Google Scholar]
- Binkofski F, Buccino G, Posse S, Seitz RJ, Rizzolatti G, Freund HJ. A fronto-parietal circuit for object manipulation in man: evidence from an fMRI-study. Eur J Neurosci 11: 3276–3286, 1999 [DOI] [PubMed] [Google Scholar]
- Binkofski F, Dohle C, Posse S, Stephan KM, Hefter H, Seitz RJ, Freund HJ. Human anterior intraparietal area subserves prehension: a combined lesion and functional MRI activation study. Neurology 50: 1253–1259, 1998 [DOI] [PubMed] [Google Scholar]
- Biswal B, Yetkin FZ, Haughton VM, Hyde JS. Functional connectivity in the motor cortex of resting human brain using echo-planar MRI. Magn Reson Med 34: 537–541, 1995 [DOI] [PubMed] [Google Scholar]
- Biswal BB, Mennes M, Zuo XN, Gohel S, Kelly C, Smith SM, Beckmann CF, Adelstein JS, Buckner RL, Colcombe S, Dogonowski AM, Ernst M, Fair D, Hampson M, Hoptman MJ, Hyde JS, Kiviniemi VJ, Kötter R, Li SJ, Lin CP, Lowe MJ, Mackay C, Madden DJ, Madsen KH, Margulies DS, Mayberg HS, McMahon K, Monk CS, Mostofsky SH, Nagel BJ, Pekar JJ, Peltier SJ, Petersen SE, Riedl V, Rombouts SARB, Rypma B, Schlaggar BL, Schmidt S, Seidler RD, Siegle GJ, Sorg C, Teng GJ, Veijola J, Villringer A, Walter M, Wang L, Weng XC, Whitfield-Gabrieli S, Williamson P, Windischberger C, Zang YF, Zhang HY, Castellanos FX, Milham MP. Toward discovery science of human brain function. Proc Natl Acad Sci USA 107: 4734–4739, 2010 [DOI] [PMC free article] [PubMed] [Google Scholar]
- Blinkov SM, Glezer II. The Human Brain in Figures and Tables. New York: Basic Books, 1968 [Google Scholar]
- Brewer AA, Liu J, Wade AR, Wandell BA. Visual field maps and stimulus selectivity in human ventral occipital cortex. Nat Neurosci 8: 1102–1109, 2005 [DOI] [PubMed] [Google Scholar]
- Brodmann K. Localization in the Cerebral Cortex, translated by Garey LJ. New York: Springer; 1909/2006 [Google Scholar]
- Buckner RL, Andrews-Hanna JR, Schacter DL. The brain's default network: Anatomy, function, and relevance to disease. Ann NY Acad Sci 1124: 1–38, 2008 [DOI] [PubMed] [Google Scholar]
- Buckner RL, Krienen FM, Castellanos A, Diaz JC, Yeo BTT. The organization of the human cerebellum estimated by intrinsic functional connectivity. J Neurophysiol. In press [DOI] [PMC free article] [PubMed] [Google Scholar]
- Buckner RL, Sepulcre J, Talukdar T, Krienen FM, Liu H, Hedden T, Andrews-Hanna JR, Sperling RA, Johnson KA. Cortical hubs revealed by intrinsic functional connectivity: mapping, assessment of stability, and relation to Alzheimer's disease. J Neurosci 29: 1860–1873, 2009 [DOI] [PMC free article] [PubMed] [Google Scholar]
- Buckner RL. Human functional connectivity: New tools, unresolved questions. Proc Natl Acad Sci USA 107: 10769–10770, 2010 [DOI] [PMC free article] [PubMed] [Google Scholar]
- Bullmore E, Sporns O. Complex brain networks: graph theoretical analysis of structural and functional systems. Nat Rev Neurosci 10: 186–198, 2009 [DOI] [PubMed] [Google Scholar]
- Cabeza R, Ciaramelli E, Olson IR, Moscovitch M. The parietal cortex and episodic memory: an attentional account. Nat Rev Neurosci 9: 613–625, 2008 [DOI] [PMC free article] [PubMed] [Google Scholar]
- Carmichael ST, Price JL. Limbic connections of the orbital and medial prefrontal cortex in macaque monkeys. J Comp Neurol 363: 615–641, 1995 [DOI] [PubMed] [Google Scholar]
- Caspers S, Eickhoff SB, Geyer S, Scheperjans F, Mohlberg H, Zilles K, Amunts K. The human inferior parietal lobule in stereotaxic space. Brain Struct Funct 212: 481–495, 2008 [DOI] [PubMed] [Google Scholar]
- Caspers S, Geyer S, Schleicher A, Mohlberg H, Amunts K, Zilles K. The human inferior parietal cortex: cytoarchitectonic parcellation and interindividual variability. Neuroimage 33: 430–448, 2006 [DOI] [PubMed] [Google Scholar]
- Catani M, ffytche DH. The rises and falls of disconnection syndromes. Brain 128: 2224–2239, 2005 [DOI] [PubMed] [Google Scholar]
- Cavada C, Goldman-Rakic PS. Posterior parietal cortex in rhesus monkey: II. Evidence for segregated corticocortical networks linking sensory and limbic areas with the frontal lobe. J Comp Neurol 287: 422–445, 1989a [DOI] [PubMed] [Google Scholar]
- Cavada C, Goldman-Rakic PS. Posterior parietal cortex in rhesus monkey: I. Parcellation of areas based on distinctive limbic and sensory corticocortical connections. J Comp Neurol 287: 393–421, 1989b [DOI] [PubMed] [Google Scholar]
- Choi HJ, Zilles K, Mohlberg H, Schleicher A, Fink GR, Armstrong E, Amunts K. Cytoarchitectonic identification and probabilistic mapping of two distinct areas within the anterior ventral bank of the human intraparietal sulcus. J Comp Neurol 495: 53–69, 2006 [DOI] [PMC free article] [PubMed] [Google Scholar]
- Cohen AL, Fair DA, Dosenbach NUF, Miezin FM, Dierker D, Van Essen DC, Schlaggar BL, Petersen SE. Defining functional areas in individual human brains using resting functional connectivity MRI. Neuroimage 41: 45–57, 2008 [DOI] [PMC free article] [PubMed] [Google Scholar]
- Colby CL, Goldberg ME. Space and attention in parietal cortex. Annu Rev Neurosci 22: 319–349, 1999 [DOI] [PubMed] [Google Scholar]
- Connolly JD, Goodale MA, Desouza JF, Menon RS, Vilis T. A comparison of frontoparietal fMRI activation during anti-saccades and anti-pointing. J Neurophysiol 84: 1645–1655, 2000 [DOI] [PubMed] [Google Scholar]
- Connolly JD, Goodale MA, Menon RS, Munoz DP. Human fMRI evidence for the neural correlates of preparatory set. Nat Neurosci 5: 1345–1352, 2002 [DOI] [PubMed] [Google Scholar]
- Corbetta M, Akbudak E, Conturo TE, Snyder AZ, Ollinger JM, Drury HA, Linenweber MR, Petersen SE, Raichle ME, Van Essen DC, Shulman GL. A common network of functional areas for attention and eye movements. Neuron 21: 761–773, 1998 [DOI] [PubMed] [Google Scholar]
- Corbetta M, Shulman GL. Control of goal-directed and stimulus-driven attention in the brain. Nat Rev Neurosci 3: 201–215, 2002 [DOI] [PubMed] [Google Scholar]
- Cragg BG. The topography of the afferent projections in the circumstriate visual cortex of the monkey studied by the Nauta method. Vision Res 9: 733–747, 1969 [DOI] [PubMed] [Google Scholar]
- Culham JC, Danckert SL, DeSouza JFX, Gati JS, Menon RS, Goodale MA. Visually guided grasping produces fMRI activation in dorsal but not ventral stream brain areas. Exp Brain Res 153: 180–189, 2003 [DOI] [PubMed] [Google Scholar]
- Culham JC, Kanwisher NG. Neuroimaging of cognitive functions in human parietal cortex. Curr Opin Neurobiol 11: 157–163, 2001 [DOI] [PubMed] [Google Scholar]
- Dale AM, Fischl B, Sereno MI. Cortical surface-based analysis. I. Segmentation and surface reconstruction. Neuroimage 9: 179–194, 1999 [DOI] [PubMed] [Google Scholar]
- Damoiseaux JS, Rombouts SARB, Barkhof F, Scheltens P, Stam CJ, Smith SM, Beckmann CF. Consistent resting-state networks across healthy subjects. Proc Natl Acad Sci USA 103: 13848–13853, 2006 [DOI] [PMC free article] [PubMed] [Google Scholar]
- De Luca M, Beckmann CF, De Stefano N, Matthews PM, Smith SM. fMRI resting state networks define distinct modes of long-distance interactions in the human brain. Neuroimage 29: 1359–1367, 2006 [DOI] [PubMed] [Google Scholar]
- DeYoe EA, Carman GJ, Bandettini P, Glickman S, Wieser J, Cox R, Miller D, Neitz J. Mapping striate and extrastriate visual areas in human cerebral cortex. Proc Natl Acad Sci USA 93: 2382–2386, 1996 [DOI] [PMC free article] [PubMed] [Google Scholar]
- Dickson J, Drury H, Van Essen DC. ‘The surface management system’ (SuMS) database: a surface-based database to aid cortical surface reconstruction, visualization and analysis. Philos Trans R Soc Lond B Biol Sci 356: 1277–1292, 2001 [DOI] [PMC free article] [PubMed] [Google Scholar]
- Disbrow E, Litinas E, Recanzone GH, Padberg J, Krubitzer L. Cortical connections of the second somatosensory area and the parietal ventral area in macaque monkeys. J Comp Neurol 462: 382–399, 2003 [DOI] [PubMed] [Google Scholar]
- Distler C, Boussaoud D, Desimone R, Ungerleider LG. Cortical connections of inferior temporal area TEO in macaque monkeys. J Comp Neurol 334: 125–150, 1993 [DOI] [PubMed] [Google Scholar]
- Dosenbach NUF, Fair DA, Miezin FM, Cohen AL, Wenger KK, Dosenbach RAT, Fox MD, Snyder AZ, Vincent JL, Raichle ME, Schlaggar BL, Petersen SE. Distinct brain networks for adaptive and stable task control in humans. Proc Natl Acad Sci USA 104: 11073–11078, 2007 [DOI] [PMC free article] [PubMed] [Google Scholar]
- Dow BM, Snyder AZ, Vautin RG, Bauer R. Magnification factor and receptive field size in foveal striate cortex of the monkey. Exp Brain Res 44: 213–228, 1981 [DOI] [PubMed] [Google Scholar]
- Eickhoff SB, Stephan KE, Mohlberg H, Grefkes C, Fink GR, Amunts K, Zilles K. A new SPM toolbox for combining probabilistic cytoarchitectonic maps and functional imaging data. Neuroimage 25: 1325–1335, 2005 [DOI] [PubMed] [Google Scholar]
- Engel SA, Glover GH, Wandell BA. Retinotopic organization in human visual cortex and the spatial precision of functional MRI. Cereb Cortex 7: 181–192, 1997 [DOI] [PubMed] [Google Scholar]
- Engel SA, Rumelhart DE, Wandell BA, Lee AT, Glover GH, Chichilnisky EJ, Shadlen MN. fMRI of human visual cortex. Nature 369: 525, 1994 [DOI] [PubMed] [Google Scholar]
- Evarts EV, Thach WT. Motor mechanisms of the CNS: cerebrocerebellar interrelations. Annu Rev Physiol 31: 451–498, 1969 [DOI] [PubMed] [Google Scholar]
- Faillenot I, Sunaert S, Van Hecke P, Orban GA. Orientation discrimination of objects and gratings compared: an fMRI study. Eur J Neurosci 13: 585–596, 2001 [DOI] [PubMed] [Google Scholar]
- Felleman DJ, Van Essen DC. Distributed hierarchical processing in the primate cerebral cortex. Cereb Cortex 1: 1–47, 1991 [DOI] [PubMed] [Google Scholar]
- Fischl B, Liu A, Dale AM. Automated manifold surgery: constructing geometrically accurate and topologically correct models of the human cerebral cortex. IEEE Trans Med Imaging 20: 70–80, 2001 [DOI] [PubMed] [Google Scholar]
- Fischl B, Rajendran N, Busa E, Augustinack J, Hinds O, Yeo BTT, Mohlberg H, Amunts K, Zilles K. Cortical folding patterns and predicting cytoarchitecture. Cereb Cortex 18: 1973–1980, 2008 [DOI] [PMC free article] [PubMed] [Google Scholar]
- Fischl B, Sereno MI, Dale AM. Cortical surface-based analysis. II: Inflation, flattening, and a surface-based coordinate system. Neuroimage 9: 195–207, 1999a [DOI] [PubMed] [Google Scholar]
- Fischl B, Sereno MI, Tootell RBH, Dale AM. High-resolution intersubject averaging and a coordinate system for the cortical surface. Hum Brain Mapp 8: 272–284, 1999b [DOI] [PMC free article] [PubMed] [Google Scholar]
- Fox MD, Corbetta M, Snyder A, Vincent J, Raichle ME. Spontaneous neuronal activity distinguishes human dorsal and ventral attention systems. Proc Natl Acad Sci USA 103: 10046, 2006 [DOI] [PMC free article] [PubMed] [Google Scholar]
- Fox MD, Raichle ME. Spontaneous fluctuations in brain activity observed with functional magnetic resonance imaging. Nat Rev Neurosci 8: 700–711, 2007 [DOI] [PubMed] [Google Scholar]
- Fox MD, Snyder AZ, Vincent JL, Corbetta M, Van Essen DC, Raichle ME. The human brain is intrinsically organized into dynamic, anticorrelated functional networks. Proc Natl Acad Sci USA 102: 9673–9678, 2005 [DOI] [PMC free article] [PubMed] [Google Scholar]
- Frahm HD, Stephan H, Baron G. Comparison of brain structure volumes in Insectivora and Primates. V. Area striata (AS). J Hirnforsch 25: 537–577, 1984 [PubMed] [Google Scholar]
- Friedman DP. Laminar patterns of termination of cortico-cortical afferents in the somatosensory system. Brain Res 273: 147–151, 1983 [DOI] [PubMed] [Google Scholar]
- Friston KJ. Functional and effective connectivity in neuroimaging: a synthesis. Hum Brain Mapp 2: 56–78, 1994 [Google Scholar]
- Geschwind N. Disconnexion syndromes in animals and man. I. Brain 88: 237–294, 1965 [DOI] [PubMed] [Google Scholar]
- Geyer S, Ledberg A, Schleicher A, Kinomura S, Schormann T, Bürgel U, Klingberg T, Larsson J, Zilles K, Roland PE. Two different areas within the primary motor cortex of man. Nature 382: 805–807, 1996 [DOI] [PubMed] [Google Scholar]
- Geyer S, Schleicher A, Zilles K. Areas 3a, 3b, and 1 of human primary somatosensory cortex 1. Microstructural organization and interindividual variability. Neuroimage 10: 63–83, 1999 [DOI] [PubMed] [Google Scholar]
- Geyer S. The microstructural border between the motor and the cognitive domain in the human cerebral cortex. Adv Anat Embryol Cell Biol 174: 1–89, 2004 [DOI] [PubMed] [Google Scholar]
- Gold JI, Shadlen MN. The neural basis of decision making. Annu Rev Neurosci 30: 535–574, 2007 [DOI] [PubMed] [Google Scholar]
- Goldman-Rakic PS. Topography of cognition: parallel distributed networks in primate association cortex. Annu Rev Neurosci 11: 137–156, 1988 [DOI] [PubMed] [Google Scholar]
- Golland P, Golland Y, Malach R. Detection of spatial activation patterns as unsupervised segmentation of fMRI data. In: Medical Image Computing and Computer-Assisted Intervention–MICCAI 2007, edited by Ayache N, Ourselin S, Maeder A. Berlin: Springer, 2007, part 1, LNCS 4791, p. 110–118 [DOI] [PMC free article] [PubMed] [Google Scholar]
- Gould HJ, Cusick CG, Pons TP, Kaas JH. The relationship of corpus callosum connections to electrical stimulation maps of motor, supplementary motor, and the frontal eye fields in owl monkeys. J Comp Neurol 247: 297–325, 1986 [DOI] [PubMed] [Google Scholar]
- Grefkes C, Geyer S, Schormann T, Roland P, Zilles K. Human somatosensory area 2: observer-independent cytoarchitectonic mapping, interindividual variability, and population map. Neuroimage 14: 617–631, 2001 [DOI] [PubMed] [Google Scholar]
- Grefkes C, Weiss PH, Zilles K, Fink GR. Crossmodal processing of object features in human anterior intraparietal cortex: an fMRI study implies equivalencies between humans and monkeys. Neuron 35: 173–184, 2002 [DOI] [PubMed] [Google Scholar]
- Greicius MD, Krasnow B, Reiss AL, Menon V. Functional connectivity in the resting brain: a network analysis of the default mode hypothesis. Proc Natl Acad Sci USA 100: 253–258, 2003 [DOI] [PMC free article] [PubMed] [Google Scholar]
- Greicius MD, Srivastava G, Reiss AL, Menon V. Default-mode network activity distinguishes Alzheimer's disease from healthy aging: evidence from functional MRI. Proc Natl Acad Sci USA 101: 4637–4642, 2004 [DOI] [PMC free article] [PubMed] [Google Scholar]
- Greve DN, Fischl B. Accurate and robust brain image alignment using boundary-based registration. Neuroimage 48: 63–72, 2009 [DOI] [PMC free article] [PubMed] [Google Scholar]
- Grill-Spector K, Malach R. The human visual cortex. Annu Rev Neurosci 27: 649–677, 2004 [DOI] [PubMed] [Google Scholar]
- Hadjikhani N, Liu A, Dale A, Cavanagh P, Tootell RBH. Retinotopy and color sensitivity in human visual cortical area V8. Nat Neurosci 1: 235–241, 1998 [DOI] [PubMed] [Google Scholar]
- Hagler DJ, Riecke L, Sereno MI. Parietal and superior frontal visuospatial maps activated by pointing and saccades. Neuroimage 35: 1562–1577, 2007 [DOI] [PMC free article] [PubMed] [Google Scholar]
- Hagmann P, Cammoun L, Gigandet X, Meuli R, Honey CJ, Wedeen VJ, Sporns O. Mapping the structural core of human cerebral cortex. PLoS Biol 6: e159, 2008 [DOI] [PMC free article] [PubMed] [Google Scholar]
- Heide W, Binkofski F, Seitz RJ, Posse S, Nitschke MF, Freund HJ, Kömpf D. Activation of frontoparietal cortices during memorized triple-step sequences of saccadic eye movements: an fMRI study. Eur J Neurosci 13: 1177–1189, 2001 [DOI] [PubMed] [Google Scholar]
- Hilgetag C, O'Neill M, Young M. Indeterminate organization of the visual system. Science 271: 776–777, 1996 [DOI] [PubMed] [Google Scholar]
- Hill J, Inder T, Neil J, Dierker D, Harwell J, Van Essen D. Similar patterns of cortical expansion during human development and evolution. Proc Natl Acad Sci USA 107: 13135–13140, 2010 [DOI] [PMC free article] [PubMed] [Google Scholar]
- Hinds O, Polimeni JR, Rajendran N, Balasubramanian M, Amunts K, Zilles K, Schwartz EL, Fischl B, Triantafyllou C. Locating the functional and anatomical boundaries of human primary visual cortex. Neuroimage 46: 915–922, 2009 [DOI] [PMC free article] [PubMed] [Google Scholar]
- Hinds OP, Rajendran N, Polimeni JP, Augustinack JC, Wiggins G, Wald LL, Diana Rosas HD, Potthast A, Schwartz EL, Fischl B. Accurate prediction of V1 location from cortical folds in a surface coordinate system. Neuroimage 39: 1585–1599, 2008 [DOI] [PMC free article] [PubMed] [Google Scholar]
- Honey CJ, Sporns O, Cammoun L, Gigandet X, Thiran JP, Meuli R, Hagmann P. Predicting human resting-state functional connectivity from structural connectivity. Proc Natl Acad Sci USA 106: 2035–2040, 2009 [DOI] [PMC free article] [PubMed] [Google Scholar]
- Hubel DH, Wiesel TN. Receptive fields, binocular interaction and functional architecture in the cat's visual cortex. J Physiol 160: 106–154, 1962 [DOI] [PMC free article] [PubMed] [Google Scholar]
- Huk AC, Dougherty RF, Heeger DJ. Retinotopy and functional subdivision of human areas MT and MST. J Neurosci 22: 7195–7205, 2002 [DOI] [PMC free article] [PubMed] [Google Scholar]
- Iwamura Y. Hierarchical somatosensory processing. Curr Opin Neurobiol 8: 522–528, 1998 [DOI] [PubMed] [Google Scholar]
- James W. Principles of Psychology, Vol 1 New York: Holt; 1890 [Google Scholar]
- Jäncke L, Kleinschmidt A, Mirzazade S, Shah NJ, Freund HJ. The role of the inferior parietal cortex in linking the tactile perception and manual construction of object shapes. Cereb Cortex 11: 114–121, 2001 [DOI] [PubMed] [Google Scholar]
- Jenkinson M, Bannister P, Brady M, Smith S. Improved optimization for the robust and accurate linear registration and motion correction of brain images. Neuroimage 17: 825–841, 2002 [DOI] [PubMed] [Google Scholar]
- Johansen-Berg H, Behrens TEJ, Robson MD, Drobnjak I, Rushworth MFS, Brady JM, Smith SM, Higham DJ, Matthews PM. Changes in connectivity profiles define functionally distinct regions in human medial frontal cortex. Proc Natl Acad Sci USA 101: 13335–13340, 2004 [DOI] [PMC free article] [PubMed] [Google Scholar]
- Johnston JM, Vaishnavi SN, Smyth MD, Zhang D, He BJ, Zempel JM, Shimony JS, Snyder AZ, Raichle ME. Loss of resting interhemispheric functional connectivity after complete section of the corpus callosum. J Neurosci 28: 6453–6458, 2008 [DOI] [PMC free article] [PubMed] [Google Scholar]
- Jones EG, Coulter JD, Hendry SHC. Intracortical connectivity of architectonic fields in the somatic sensory, motor and parietal cortex of monkeys. J Comp Neurol 181: 291–347, 1978 [DOI] [PubMed] [Google Scholar]
- Jones EG, Powell TPS. An anatomical study of converging sensory pathways within the cerebral cortex of the monkey. Brain 93: 793–820, 1970 [DOI] [PubMed] [Google Scholar]
- Jones EG, Wise SP. Size, laminar and columnar distribution of efferent cells in the sensory-motor cortex of monkeys. J Comp Neurol 175: 391–438, 1977 [DOI] [PubMed] [Google Scholar]
- Kaas JH. The organization of neocortex in mammals: Implications for theories of brain function. Annu Rev Psychol 38: 129–151, 1987 [DOI] [PubMed] [Google Scholar]
- Kemp JM, Powell TPS. The connexions of the striatum and globus pallidus: synthesis and speculation. Philos Trans R Soc Lond B Biol Sci 262: 441–457, 1971 [DOI] [PubMed] [Google Scholar]
- Killackey HP, Gould HJ, Cusick CG, Pons TP, Kaas JH. The relation of corpus callosum connections to architectonic fields and body surface maps in sensorimotor cortex of new and old world monkeys. J Comp Neurol 219: 384–419, 1983 [DOI] [PubMed] [Google Scholar]
- Kolster H, Peeters R, Orban GA. The retinotopic organization of the human middle temporal area MT/V5 and its cortical neighbors. J Neurosci 30: 9801–9820, 2010 [DOI] [PMC free article] [PubMed] [Google Scholar]
- Kondo H, Saleem KS, Price JL. Differential connections of the temporal pole with the orbital and medial prefrontal networks in macaque monkeys. J Comp Neurol 465: 499–523, 2003 [DOI] [PubMed] [Google Scholar]
- Koyama M, Hasegawa I, Osada T, Adachi Y, Nakahara K, Miyashita Y. Functional magnetic resonance imaging of macaque monkeys performing visually guided saccade tasks: comparison of cortical eye fields with humans. Neuron 41: 795–807, 2004 [DOI] [PubMed] [Google Scholar]
- Kurata K. Corticocortical inputs to the dorsal and ventral aspects of the premotor cortex of macaque monkeys. Neurosci Res 12: 263–280, 1991 [DOI] [PubMed] [Google Scholar]
- Kwong KK, Belliveau JW, Chesler DA, Goldberg IE, Weisskoff RM, Poncelet BP, Kennedy DN, Hoppel BE, Cohen MS, Turner R, Cheng HM, Brady T, Rosen BR. Dynamic magnetic resonance imaging of human brain activity during primary sensory stimulation. Proc Natl Acad Sci USA 89: 5675–5679, 1992 [DOI] [PMC free article] [PubMed] [Google Scholar]
- Lancaster JL, Tordesillas-Gutierrez D, Martinez M, Salinas F, Evans A, Zilles K, Mazziotta JC, Fox PT. Bias between MNI and Talairach coordinates analyzed using the ICBM-152 brain template. Hum Brain Mapp 28: 1194–1205, 2007 [DOI] [PMC free article] [PubMed] [Google Scholar]
- Lange T, Roth V, Braun M, Buhmann JM. Stability-based validation of clustering solutions. Neural Comput 16: 1299–1323, 2004 [DOI] [PubMed] [Google Scholar]
- Larsson J, Heeger DJ. Two retinotopic visual areas in human lateral occipital cortex. J Neurosci 26: 13128–13142, 2006 [DOI] [PMC free article] [PubMed] [Google Scholar]
- Lashkari D, Vul E, Kanwisher N, Golland P. Discovering structure in the space of fMRI selectivity profiles. Neuroimage 50: 1085–1098, 2010 [DOI] [PMC free article] [PubMed] [Google Scholar]
- Lavenex P, Suzuki WA, Amaral DG. Perirhinal and parahippocampal cortices of the macaque monkey: projections to the neocortex. J Comp Neurol 447: 394–420, 2002 [DOI] [PubMed] [Google Scholar]
- Levy I, Hasson U, Avidan G, Hendler T, Malach R. Center-periphery organization of human object areas. Nat Neurosci 4: 533–539, 2001 [DOI] [PubMed] [Google Scholar]
- Logothetis NK. What we can do and what we cannot do with fMRI. Nature 453: 869–878, 2008 [DOI] [PubMed] [Google Scholar]
- Luna B, Thulborn KR, Strojwas MH, McCurtain BJ, Berman RA, Genovese CR, Sweeney JA. Dorsal cortical regions subserving visually guided saccades in humans: an fMRI study. Cereb Cortex 8: 40–47, 1998 [DOI] [PubMed] [Google Scholar]
- Luppino G, Matelli M, Camarda R, Rizzolatti G. Corticocortical connections of area F3 (SMA-proper) and area F6 (pre-SMA) in the macaque monkey. J Comp Neurol 338: 114–140, 1993 [DOI] [PubMed] [Google Scholar]
- Malach R, Reppas JB, Benson RR, Kwong KK, Jiang H, Kennedy WA, Ledden PJ, Brady TJ, Rosen BR, Tootell RBH. Object-related activity revealed by functional magnetic resonance imaging in human occipital cortex. Proc Natl Acad Sci USA 92: 8135–8139, 1995 [DOI] [PMC free article] [PubMed] [Google Scholar]
- Malikovic A, Amunts K, Schleicher A, Mohlberg H, Eickhoff SB, Wilms M, Palomero-Gallagher N, Armstrong E, Zilles K. Cytoarchitectonic analysis of the human extrastriate cortex in the region of V5/MT+: a probabilistic, stereotaxic map of area hOc5. Cereb Cortex 17: 562–574, 2007 [DOI] [PubMed] [Google Scholar]
- Marcus DS, Fotenos AF, Csernansky JG, Morris JC, Buckner RL. Open access series of imaging studies: longitudinal MRI data in nondemented and demented older adults. J Cogn Neurosci 22: 2677–2684, 2010 [DOI] [PMC free article] [PubMed] [Google Scholar]
- Marcus DS, Wang TH, Parker J, Csernansky JG, Morris JC, Buckner RL. Open access series of imaging studies (OASIS): cross-sectional MRI data in young, middle aged, nondemented, and demented older adults. J Cogn Neurosci 19: 1498–1507, 2007 [DOI] [PubMed] [Google Scholar]
- Markov NT, Misery P, Falchier A, Lamy C, Vezoli J, Quilodran R, Gariel MA, Giroud P, Ercsey-Ravasz M, Pilaz LJ, Huissoud C, Barone P, Dehay C, Toroczkai Z, Van Essen DC, Kennedy H, Knoblauch K. Weight consistency specifies regularities of macaque cortical networks. Cereb Cortex 21: 1254–1272, 2011 [DOI] [PMC free article] [PubMed] [Google Scholar]
- Matelli M, Camarda R, Glickstein M, Rizzolatti G. Afferent and efferent projections of the inferior area 6 in the macaque monkey. J Comp Neurol 251: 281–298, 1986 [DOI] [PubMed] [Google Scholar]
- Matelli M, Luppino G, Rizzolatti G. Architecture of superior and mesial area 6 and the adjacent cingulate cortex in the macaque monkey. J Comp Neurol 311: 445–462, 1991 [DOI] [PubMed] [Google Scholar]
- Matelli M, Luppino G, Rizzolatti G. Patterns of cytochrome oxidase activity in the frontal agranular cortex of the macaque monkey. Behav Brain Res 18: 125–136, 1985 [DOI] [PubMed] [Google Scholar]
- Maunsell JHR, Van Essen DC. The connections of the middle temporal visual area (MT) and their relationship to a cortical hierarchy in the macaque monkey. J Neurosci 3: 2563, 1983 [DOI] [PMC free article] [PubMed] [Google Scholar]
- Maunsell JHR, Van Essen DC. Topographic organization of the middle temporal visual area in the macaque monkey: representational biases and the relationship to callosal connections and myeloarchitectonic boundaries. J Comp Neurol 266: 535–555, 1987 [DOI] [PubMed] [Google Scholar]
- Medendorp WP, Goltz HC, Vilis T, Crawford JD. Gaze-centered updating of visual space in human parietal cortex. J Neurosci 23: 6209–6214, 2003 [DOI] [PMC free article] [PubMed] [Google Scholar]
- Mesulam MM, Mufson EJ. Insula of the old world monkey. III: Efferent cortical output and comments on function. J Comp Neurol 212: 38–52, 1982 [DOI] [PubMed] [Google Scholar]
- Mesulam MM. A cortical network for directed attention and unilateral neglect. Ann Neurol 10: 309–325, 1981 [DOI] [PubMed] [Google Scholar]
- Mesulam MM. From sensation to cognition. Brain 121: 1013–1052, 1998 [DOI] [PubMed] [Google Scholar]
- Mesulam MM. Frontal cortex and behavior. Ann Neurol 19: 320–325, 1986 [DOI] [PubMed] [Google Scholar]
- Mesulam MM. Large-scale neurocognitive networks and distributed processing for attention, language, and memory. Ann Neurol 28: 597–613, 1990 [DOI] [PubMed] [Google Scholar]
- Moeller S, Nallasamy N, Tsao DY, Freiwald WA. Functional connectivity of the macaque brain across stimulus and arousal states. J Neurosci 29: 5897–5909, 2009 [DOI] [PMC free article] [PubMed] [Google Scholar]
- Moran MA, Mufson EJ, Mesulam MM. Neural inputs into the temporopolar cortex of the rhesus monkey. J Comp Neurol 256: 88–103, 1987 [DOI] [PubMed] [Google Scholar]
- Nelson SM, Cohen AL, Power JD, Wig GS, Miezin FM, Wheeler ME, Velanova K, Donaldson DI, Phillips JS, Schlaggar BL, Petersen SE. A parcellation scheme for human left lateral parietal cortex. Neuron 67: 156–170, 2010 [DOI] [PMC free article] [PubMed] [Google Scholar]
- Ogawa S, Tank DW, Menon R, Ellermann JM, Kim SG, Merkle H, Ugurbil K. Intrinsic signal changes accompanying sensory stimulation: functional brain mapping with magnetic resonance imaging. Proc Natl Acad Sci USA 89: 5951–5955, 1992 [DOI] [PMC free article] [PubMed] [Google Scholar]
- Ojemann JG, Akbudak E, Snyder AZ, McKinstry RC, Raichle ME, Conturo TE. Anatomic localization and quantitative analysis of gradient refocused echo-planar fMRI susceptibility artifacts. Neuroimage 6: 156–167, 1997 [DOI] [PubMed] [Google Scholar]
- Orban GA, Claeys K, Nelissen K, Smans R, Sunaert S, Todd JT, Wardak C, Durand JB, Vanduffel W. Mapping the parietal cortex of human and non-human primates. Neuropsychologia 44: 2647–2667, 2006 [DOI] [PubMed] [Google Scholar]
- Orban GA, Van Essen D, Vanduffel W. Comparative mapping of higher visual areas in monkeys and humans. Trends Cogn Sci 8: 315–324, 2004 [DOI] [PubMed] [Google Scholar]
- Pandya DN, Kuypers HG. Cortico-cortical connections in the rhesus monkey. Brain Res 13: 13–36, 1969 [DOI] [PubMed] [Google Scholar]
- Pandya DN, Seltzer B. Intrinsic connections and architectonics of posterior parietal cortex in the rhesus monkey. J Comp Neurol 204: 196–210, 1982 [DOI] [PubMed] [Google Scholar]
- Pandya DN, Vignolo LA. Intra- and interhemispheric projections of the precentral premotor and arcuate areas in the rhesus monkey. Brain Res 26: 217–233, 1971 [PubMed] [Google Scholar]
- Passingham RE, Stephan KE, Kötter R. The anatomical basis of functional localization in the cortex. Nat Rev Neurosci 3: 606–616, 2002 [DOI] [PubMed] [Google Scholar]
- Perry RJ, Zeki S. The neurology of saccades and covert shifts in spatial attention: an event-related fMRI study. Brain 123: 2273–2288, 2000 [DOI] [PubMed] [Google Scholar]
- Petrides M, Pandya DN. Efferent association pathways originating in the caudal prefrontal cortex in the macaque monkey. J Comp Neurol 498: 227–251, 2006 [DOI] [PubMed] [Google Scholar]
- Petrides M. Lateral prefrontal cortex: architectonic and functional organization. Philos Trans R Soc Lond B Biol Sci 360: 781–795, 2005 [DOI] [PMC free article] [PubMed] [Google Scholar]
- Pilbeam D, Young N. Hominoid evolution: synthesizing disparate data. C R Palevol 3: 305–321, 2004 [Google Scholar]
- Polimeni JR, Fischl B, Greve DN, Wald LL. Laminar analysis of 7T BOLD using an imposed spatial activation pattern in human V1. Neuroimage 52: 1334–1346, 2010 [DOI] [PMC free article] [PubMed] [Google Scholar]
- Polimeni JR, Hinds OP, Balasubramanian M, van der Kouwe AJW, Wald L, Dale AM, L, Fischl B, Schwartz EL. The human V1-V2-V3 visuotopic map complex measured via fMRI at 3 and 7 Tesla. Soc Neurosci Abstr, 2005 [Google Scholar]
- Pons TP, Kaas JH. Corticocortical connections of area 2 of somatosensory cortex in macaque monkeys: a correlative anatomical and electrophysiological study. J Comp Neurol 248: 313–335, 1986 [DOI] [PubMed] [Google Scholar]
- Posner MI, Petersen SE, Fox PT, Raichle ME. Localization of cognitive operations in the human brain. Science 240: 1627–1631, 1988 [DOI] [PubMed] [Google Scholar]
- Power JD, Fair DA, Schlaggar BL, Petersen SE. The development of human functional brain networks. Neuron 67: 735–748, 2010 [DOI] [PMC free article] [PubMed] [Google Scholar]
- Preuss T. What is it like to be a human? In: The Cognitive Neurosciences (3rd ed.), edited by Gazzaniga MS. Cambridge, MA: MIT Press, 2004, p. 5–22 [Google Scholar]
- Raichle ME. Circulatory and metabolic correlates of brain function in normal humans. In: Handbook of Physiology. The Nervous System. Higher Functions of the Brain. Bethesda, MD: Am Physiol Soc, 1997, sect. 1, vol. V, part 1, p. 643–674 [Google Scholar]
- Rajkowska G, Goldman-Rakic PS. Cytoarchitectonic definition of prefrontal areas in the normal human cortex. II. variability in locations of areas 9 and 46 and relationship to the Talairach Coordinate System. Cereb Cortex 5: 323–337, 1995 [DOI] [PubMed] [Google Scholar]
- Rizzolatti G, Luppino G, Matelli M. The organization of the cortical motor system: new concepts. Electroencephalogr Clin Neurophysiol 106: 283–296, 1998 [DOI] [PubMed] [Google Scholar]
- Rockland KS, Pandya DN. Laminar origins and terminations of cortical connections of the occipital lobe in the rhesus monkey. Brain Res 179: 3–20, 1979 [DOI] [PubMed] [Google Scholar]
- Rosenbaum RS, Stuss DT, Levine B, Tulving E. Theory of mind is independent of episodic memory. Science 318: 1257, 2007 [DOI] [PubMed] [Google Scholar]
- Rottschy C, Eickhoff SB, Schleicher A, Mohlberg H, Kujovic M, Zilles K, Amunts K. Ventral visual cortex in humans: cytoarchitectonic mapping of two extrastriate areas. Hum Brain Mapp 28: 1045–1059, 2007 [DOI] [PMC free article] [PubMed] [Google Scholar]
- Rousseeuw PJ. Silhouettes: a graphical aid to the interpretation and validation of cluster analysis. J Comput Appl Math. 20: 1987 [Google Scholar]
- Rovamo J, Virsu V. An estimation and application of the human cortical magnification factor. Exp Brain Res 37: 495–510, 1979 [DOI] [PubMed] [Google Scholar]
- Saleem KS, Kondo H, Price JL. Complementary circuits connecting the orbital and medial prefrontal networks with the temporal, insular, and opercular cortex in the macaque monkey. J Comp Neurol 506: 659–693, 2008 [DOI] [PubMed] [Google Scholar]
- Saxe R, Powell LJ. It's the thought that counts: specific brain regions for one component of theory of mind. Psychol Sci 17: 692–699, 2006 [DOI] [PubMed] [Google Scholar]
- Saxe R. Uniquely human social cognition. Curr Opin Neurobiol 16: 235–239, 2006 [DOI] [PubMed] [Google Scholar]
- Scheperjans F, Eickhoff SB, Hömke L, Mohlberg H, Hermann K, Amunts K, Zilles K. Probabilistic maps, morphometry, and variability of cytoarchitectonic areas in the human superior parietal cortex. Cereb Cortex 18: 2141–2157, 2008a [DOI] [PMC free article] [PubMed] [Google Scholar]
- Scheperjans F, Hermann K, Eickhoff SB, Amunts K, Schleicher A, Zilles K. Observer-independent cytoarchitectonic mapping of the human superior parietal cortex. Cereb Cortex 18: 846–867, 2008b [DOI] [PubMed] [Google Scholar]
- Schleicher A, Amunts K, Geyer S, Morosan P, Zilles K. Observer-independent method for microstructural parcellation of cerebral cortex: a quantitative approach to cytoarchitectonics. Neuroimage 9: 165–177, 1999 [DOI] [PubMed] [Google Scholar]
- Schormann T, Zilles K. Three-dimensional linear and nonlinear transformations: an integration of light microscopical and MRI data. Hum Brain Mapp 6: 339–347, 1998 [DOI] [PMC free article] [PubMed] [Google Scholar]
- Seeley WW, Menon V, Schatzberg AF, Keller J, Glover GH, Kenna H, Reiss AL, Greicius MD. Dissociable intrinsic connectivity networks for salience processing and executive control. J Neurosci 27: 2349–2356, 2007 [DOI] [PMC free article] [PubMed] [Google Scholar]
- Ségonne F, Dale AM, Busa E, Glessner M, Salat D, Hahn HK, Fischl B. A hybrid approach to the skull stripping problem in MRI. Neuroimage 22: 1060–1075, 2004 [DOI] [PubMed] [Google Scholar]
- Ségonne F, Pacheco J, Fischl B. Geometrically accurate topology-correction of cortical surfaces using nonseparating loops. IEEE Trans Med Imaging 26: 518–529, 2007 [DOI] [PubMed] [Google Scholar]
- Selemon LD, Goldman-Rakic PS. Common cortical and subcortical targets of the dorsolateral prefrontal and posterior parietal cortices in the rhesus monkey: evidence for a distributed neural network subserving spatially guided behavior. J Neurosci 8: 4049–4068, 1988 [DOI] [PMC free article] [PubMed] [Google Scholar]
- Seltzer B, Pandya DN. Further observations on parieto-temporal connections in the rhesus monkey. Exp Brain Res 55: 301–312, 1984 [DOI] [PubMed] [Google Scholar]
- Seltzer B, Pandya DN. Parietal, temporal, and occipital projections to cortex of the superior temporal sulcus in the rhesus monkey: a retrograde tracer study. J Comp Neurol 343: 445–463, 1994 [DOI] [PubMed] [Google Scholar]
- Sepulcre J, Liu H, Talukdar T, Martincorena I, Yeo BTT, Buckner RL. The organization of local and distant functional connectivity in the human brain. PLoS Comput Biol 6: e1000808, 2010 [DOI] [PMC free article] [PubMed] [Google Scholar]
- Sereno MI, Dale AM, Reppas JB, Kwong KK, Belliveau JW, Brady TJ, Rosen BR, Tootell RBH. Borders of multiple visual areas in humans revealed by functional magnetic resonance imaging. Science 268: 889–893, 1995 [DOI] [PubMed] [Google Scholar]
- Sereno MI, Pitzalis S, Martinez A. Mapping of contralateral space in retinotopic coordinates by a parietal cortical area in humans. Science 294: 1350–1354, 2001 [DOI] [PubMed] [Google Scholar]
- Sestieri C, Corbetta M, Romani GL, Shulman GL. Episodic memory retrieval, parietal cortex, and the default mode network: functional and topographic analyses. J Neurosci 31: 4407–4420, 2011 [DOI] [PMC free article] [PubMed] [Google Scholar]
- Shadlen MN, Newsome WT. Neural basis of a perceptual decision in the parietal cortex (area LIP) of the rhesus monkey. J Neurophysiol 86: 1916–1936, 2001 [DOI] [PubMed] [Google Scholar]
- Shikata E, Hamzei F, Glauche V, Knab R, Dettmers C, Weiller C, Büchel C. Surface orientation discrimination activates caudal and anterior intraparietal sulcus in humans: an event-related fMRI study. J Neurophysiol 85: 1309–1314, 2001 [DOI] [PubMed] [Google Scholar]
- Shikata E, Hamzei F, Glauche V, Koch M, Weiller C, Binkofski F, Büchel C. Functional properties and interaction of the anterior and posterior intraparietal areas in humans. Eur J Neurosci 17: 1105–1110, 2003 [DOI] [PubMed] [Google Scholar]
- Shulman GL, McAvoy MP, Cowan MC, Astafiev SV, Tansy AP, d'Avossa G, Corbetta M. Quantitative analysis of attention and detection signals during visual search. J Neurophysiol 90: 3384–3397, 2003 [DOI] [PubMed] [Google Scholar]
- Shulman GL, Ollinger JM, Akbudak E, Conturo TE, Snyder AZ, Petersen SE, Corbetta M. Areas involved in encoding and applying directional expectations to moving objects. J Neurosci 19: 9480–9496, 1999 [DOI] [PMC free article] [PubMed] [Google Scholar]
- Smith SM, Fox PT, Miller KL, Glahn DC, Fox PM, Mackay CE, Filippini N, Watkins KE, Toro R, Laird AR, Beckmann CF. Correspondence of the brain's functional architecture during activation and rest. Proc Natl Acad Sci USA 106: 13040–13045, 2009 [DOI] [PMC free article] [PubMed] [Google Scholar]
- Smith SM, Jenkinson M, Woolrich MW, Beckmann CF, Behrens TEJ, Johansen-Berg H, Bannister PR, De Luca M, Drobnjak I, Flitney D, Niazy RK, Saunders J, Vickers J, Zhang Y, De Stefano N, Brady JM, Matthews PM. Advances in functional and structural MR image analysis and implementation as FSL. Neuroimage 23: S208–S219, 2004 [DOI] [PubMed] [Google Scholar]
- Stanton GB, Bruce CJ, Goldberg ME. Topography of projections to posterior cortical areas from the macaque frontal eye fields. J Comp Neurol 353: 291–305, 1995 [DOI] [PubMed] [Google Scholar]
- Strick PL. How do the basal ganglia and cerebellum gain access to the cortical motor areas? Behav Brain Res 18: 107–123, 1985 [DOI] [PubMed] [Google Scholar]
- Suzuki WA, Amaral DG. Perirhinal and parahippocampal cortices of the macaque monkey: cortical afferents. J Comp Neurol 350: 497–533, 1994 [DOI] [PubMed] [Google Scholar]
- Swisher JD, Halko MA, Merabet LB, McMains SA, Somers DC. Visual topography of human intraparietal sulcus. J Neurosci 27: 5326–5337, 2007 [DOI] [PMC free article] [PubMed] [Google Scholar]
- Taira M, Nose I, Inoue K, Tsutsui K. Cortical areas related to attention to 3D surface structures based on shading: an fMRI study. Neuroimage 14: 959–966, 2001 [DOI] [PubMed] [Google Scholar]
- Talairach J, Tournoux P. Co-planar Stereotaxic Atlas of the Human Brain: 3-Dimensional Proportional System: An Approach to Cerebral Imaging. New York: Thieme Medical, 1988 [Google Scholar]
- Tanné-Gariépy J, Rouiller EM, Boussaoud D. Parietal inputs to dorsal versus ventral premotor areas in the macaque monkey: evidence for largely segregated visuomotor pathways. Exp Brain Res 145: 91–103, 2002 [DOI] [PubMed] [Google Scholar]
- Thirion B, Pinel P, Meriaux S, Roche A, Dehaene S, Poline JB. Analysis of a large fMRI cohort: Statistical and methodological issues for group analyses. Neuroimage 35: 105–120, 2007 [DOI] [PubMed] [Google Scholar]
- Tootell RBH, Hadjikhani N, Hall EK, Marrett S, Vanduffel W, Vaughan JT, Dale AM. The retinotopy of visual spatial attention. Neuron 21: 1409–1422, 1998 [DOI] [PubMed] [Google Scholar]
- Tootell RBH, Hadjikhani N. Where is ‘dorsal V4’ in human visual cortex? Retinotopic, topographic and functional evidence. Cereb Cortex 11: 298–311, 2001 [DOI] [PubMed] [Google Scholar]
- Tootell RBH, Reppas JB, Kwong KK, Malach R, Born RT, Brady TJ, Rosen BR, Belliveau JW. Functional analysis of human MT and related visual cortical areas using magnetic resonance imaging. J Neurosci 15: 3215–3230, 1995 [DOI] [PMC free article] [PubMed] [Google Scholar]
- Tootell RBH, Taylor JB. Anatomical evidence for MT and additional cortical visual areas in humans. Cereb Cortex 5: 39–55, 1995 [DOI] [PubMed] [Google Scholar]
- Ungerleider LG, Desimone R. Cortical connections of visual area MT in the macaque. J Comp Neurol 248: 190–222, 1986 [DOI] [PubMed] [Google Scholar]
- van der Kouwe AJW, Benner T, Fischl B, Schmitt F, Salat DH, Harder M, Sorensen AG, Dale AM. On-line automatic slice positioning for brain MR imaging. Neuroimage 27: 222–230, 2005 [DOI] [PubMed] [Google Scholar]
- van der Kouwe AJW, Benner T, Salat DH, Fischl B. Brain morphometry with multiecho MPRAGE. Neuroimage 40: 559–569, 2008 [DOI] [PMC free article] [PubMed] [Google Scholar]
- Van Dijk KRA, Hedden T, Venkataraman A, Evans KC, Lazar SW, Buckner RL. Intrinsic functional connectivity as a tool for human connectomics: theory, properties, and optimization. J Neurophysiol 103: 297–321, 2010 [DOI] [PMC free article] [PubMed] [Google Scholar]
- Van Essen DC. A Population-Average, Landmark-and Surface-based (PALS) atlas of human cerebral cortex. Neuroimage 28: 635–662, 2005 [DOI] [PubMed] [Google Scholar]
- Van Essen DC. Organization of visual areas in macaque and human cerebral cortex. In: The Visual Neurosciences, edited by Chalupa L, Werner JS. Cambridge, MA: MIT Press, 2004, p. 507–521 [Google Scholar]
- Van Overwalle F, Baetens K. Understanding others' actions and goals by mirror and mentalizing systems: a meta-analysis. Neuroimage 48: 564–584, 2009 [DOI] [PubMed] [Google Scholar]
- Van Essen DC, Anderson CH, Felleman DJ. Information processing in the primate visual system: an integrated systems perspective. Science 255: 419–423, 1992 [DOI] [PubMed] [Google Scholar]
- Van Essen DC, Dierker DL. Surface-based and probabilistic atlases of primate cerebral cortex. Neuron 56: 209–225, 2007 [DOI] [PubMed] [Google Scholar]
- Van Essen DC, Zeki SM. The topographic organization of rhesus monkey prestriate cortex. J Physiol 277: 193–226, 1978 [DOI] [PMC free article] [PubMed] [Google Scholar]
- Vilberg KL, Rugg MD. Memory retrieval and the parietal cortex: a review of evidence from a dual-process perspective. Neuropsychologia 46: 1787–1799, 2008 [DOI] [PMC free article] [PubMed] [Google Scholar]
- Vincent JL, Kahn I, Snyder AZ, Raichle ME, Buckner RL. Evidence for a frontoparietal control system revealed by intrinsic functional connectivity. J Neurophysiol 100: 3328–3342, 2008 [DOI] [PMC free article] [PubMed] [Google Scholar]
- Vincent JL, Patel GH, Fox MD, Snyder AZ, Baker JT, Van Essen DC, Zempel JM, Snyder LH, Corbetta M, Raichle ME. Intrinsic functional architecture in the anaesthetized monkey brain. Nature 447: 83–86, 2007 [DOI] [PubMed] [Google Scholar]
- Vincent JL, Snyder AZ, Fox MD, Shannon BJ, Andrews JR, Raichle ME, Buckner RL. Coherent spontaneous activity identifies a hippocampal-parietal memory network. J Neurophysiol 96: 3517–3531, 2006 [DOI] [PubMed] [Google Scholar]
- von Bonin G, Bailey P. The Neocortex of Macaca Mulatta. Urbana, IL: University of Illinois Press, 1947 [Google Scholar]
- Wagner AD, Shannon BJ, Kahn I, Buckner RL. Parietal lobe contributions to episodic memory retrieval. Trends Cogn Sci 9: 445–453, 2005 [DOI] [PubMed] [Google Scholar]
- Wandell BA, Brewer AA, Dougherty RF. Visual field map clusters in human cortex. Philos Trans R Soc Lond B Biol Sci 360: 693–707, 2005 [DOI] [PMC free article] [PubMed] [Google Scholar]
- Wandell BA, Dumoulin SO, Brewer AA. Visual field maps in human cortex. Neuron 56: 366–383, 2007 [DOI] [PubMed] [Google Scholar]
- Wessinger CM, VanMeter J, Tian B, Van Lare J, Pekar J, Rauschecker JP. Hierarchical organization of the human auditory cortex revealed by functional magnetic resonance imaging. J Cogn Neurosci 13: 1–7, 2001 [DOI] [PubMed] [Google Scholar]
- Wilms M, Eickhoff SB, Hömke L, Rottschy C, Kujovic M, Amunts K, Fink GR. Comparison of functional and cytoarchitectonic maps of human visual areas V1, V2, V3d, V3v, and V4(v). Neuroimage 49: 1171–1179, 2010 [DOI] [PubMed] [Google Scholar]
- Yeo BTT, Sabuncu MR, Vercauteren T, Ayache N, Fischl B, Golland P. Spherical demons: fast diffeomorphic landmark-free surface registration. IEEE Trans Med Imaging 29: 650–668, 2010a [DOI] [PMC free article] [PubMed] [Google Scholar]
- Yeo BTT, Sabuncu MR, Vercauteren T, Holt DJ, Amunts K, Zilles K, Golland P, Fischl B. Learning task-optimal registration cost functions for localizing cytoarchitecture and function in the cerebral cortex. IEEE Trans Med Imaging 29: 1424–1441, 2010b [DOI] [PMC free article] [PubMed] [Google Scholar]
- Zeki SM. Representation of central visual fields in prestriate cortex of monkey. Brain Res 14: 271–291, 1969 [DOI] [PubMed] [Google Scholar]
- Zilles K, Schlaug G, Matelli M, Luppino G, Schleicher A, Qü M, Dabringhaus A, Seitz R, Roland PE. Mapping of human and macaque sensorimotor areas by integrating architectonic, transmitter receptor, MRI and PET data. J Anat 187: 515–537, 1995 [PMC free article] [PubMed] [Google Scholar]


