Abstract
Levetiracetam (LEV) is one of the most commonly prescribed antiepileptic drugs, but its mechanism of action is uncertain. Based on prior information that LEV binds to the vesicular protein synaptic vesicle protein 2A and reduces presynaptic neurotransmitter release, we wanted to more rigorously characterize its effect on transmitter release and explain the requirement for a prolonged incubation period for its full effect to manifest. During whole cell patch recordings from rat hippocampal pyramidal neurons in vitro, we found that LEV decreased synaptic currents in a frequency-dependent manner and reduced the readily releasable pool of vesicles. When we manipulated spontaneous activity and stimulation paradigms, we found that synaptic activity during LEV incubation alters the time at which LEV's effect appears, as well as its magnitude. We believe that synaptic activity and concomitant vesicular release allow LEV to enter recycling vesicles to reach its binding site, synaptic vesicle protein 2A. In support of this hypothesis, a vesicular “load-unload” protocol using hypertonic sucrose in the presence of LEV quickly induced LEV's effect. The effect rapidly disappeared after unloading in the absence of LEV. These findings are compatible with LEV acting at an intravesicular binding site to modulate the release of transmitter and with its most marked effect on rapidly discharging neurons. Our results identify a unique neurobiological explanation for LEV's highly selective antiepileptic effect and suggest that synaptic vesicle proteins might be appropriate targets for the development of other neuroactive drugs.
Keywords: epilepsy, synaptic vesicle protein 2A, synaptic vesicle release, hippocampal slice
levetiracetam (lev) is an antiepileptic drug (AED) with a unique mode of action and efficacy against focal and generalized seizures. The exact mechanism by which this drug reduces seizures is still under investigation. LEV does not inhibit voltage-gated Na+ channels (Zona et al. 2001), nor does it modulate GABA receptors (Margineanu and Klitgaard 2003), two common AED mechanisms. It is established that LEV binds to a presynaptic protein, synaptic vesicle protein 2A (SV2A), located in the membrane of synaptic vesicles (Lynch et al. 2004). The precise function of SV2A is also unknown, but studies of cultured neurons from SV2A knockout mice show a reduced postsynaptic response, due to a lower initial vesicle release probability (Custer et al. 2006) and a decrease in the total amount of neurotransmitter release during a stimulus train compared with controls (Chang and Sudhof 2009). Because SV2A plays a modulatory, but not essential, role in neurotransmission, it is unclear how a ligand binding to SV2A might alter neurotransmitter release.
The cellular mechanism of action of LEV remains paradoxical. While it seems to do nothing to normal synaptic transmission, it decreases the amplitude of the late excitatory postsynaptic field potentials in the CA1 region of the hippocampus during repetitive stimulation (Birnsteil et al. 1997; Yang et al. 2007). Imaging of the synaptic vesicle marker FM 1–43 also showed that LEV slowed transmitter release. Interestingly, these effects are only present after slices have been exposed to LEV for 1 h or longer (Yang and Rothman 2009). The explanation for the long incubation period is unclear, but may provide a clue about how LEV gains access to SV2A, an intracellular protein.
The FM 1–43 imaging experiments and whole cell patch-clamp recordings shown below more carefully dissect out the mechanism of action of LEV and suggest a unique route by which LEV reaches SV2A. The evidence is most consistent with the hypothesis that LEV enters neurons via vesicular recycling and then acts to reduce the readily releasable pool (RRP) of vesicles. This accounts for LEV's ability to decrease excitatory postsynaptic current (EPSC) amplitudes in an activity- and frequency-dependent manner, as well as provides a reason for the long latency before the alterations in EPSCs appear. This new information about the mechanism of LEV suggests a truly unique small-molecule neuropharmacological mechanism. Moreover, it may inform our ideas about the function of SV2A and assist in the development of future AEDs.
METHODS
Animals and preparation of hippocampal slices.
Two- to four-week-old Sprague-Dawley rats were used for all experiments. Procedures involving these animals were approved by the University of Minnesota's Institutional Animal Care and Use Committee. After either halothane or isoflurane anesthesia, rats were decapitated, and their brains were quickly removed and submerged in either 0°C artificial cerebrospinal fluid (ACSF) for slices to be used for two-photon microscopy or in 0°C high-sucrose solution for slices to be used for patch-clamp electrophysiology. ACSF contained the following (in mM): 124 NaCl, 5 KCl, 2 CaCl2, 2 MgSO4, 1.25 NaH2PO4, 22 NaHCO3, and 10 glucose. High sucrose solution contained the following (in mM): 240 sucrose, 2.5 KCl, 0.5 CaCl2, 7 MgCl2, 1.25 NaH2PO4, 25 NaHCO3, and 7 glucose. Both solutions were continuously bubbled with a 95%O2/5% CO2 gas mixture. After coronal cuts removed the cerebellum and the most anterior one-third of the cerebrum, the freshly cut anterior surface of the brain was glued flat to the vibratome stage (Pelco, St. Louis, MO). The ventral surface of the brain was placed against an agarose block, and the brains were submerged in their respective 0°C solutions. The vibratome then cut either 150-μm thick slices for immunostaining, 500-μm thick slices for two-photon microscopy, or 300-μm thick slices for patch-clamp electrophysiology. The hemispheres of each slice were separated with a razor blade. For slices in which the CA3 region of the slice was removed, a final razor blade cut was made to each hemisphere in the CA2 region of the slice. The slices were transferred from the vibratome stage to holding chambers filled with warmed (35°C) ACSF and were allowed to reach room temperature while incubating. For some experiments, the incubation concentrations of magnesium and/or LEV were altered, or other drugs were added.
Immunostaining and imaging.
Hippocampal slices (150 μm) were obtained from 2-wk-old rats, as described above. Immunostaining was carried out in a manner similar to that previously described for thick sections of cutaneous tissue (Kennedy et al. 2005). Slices were submerged in Zamboni's fixative [2% paraformaldehyde/0.2% picric acid in phosphate-buffered saline (PBS)] for 24 h at 4°C. Slices were rinsed in 20% sucrose-PBS, then PBS, and transferred to blocking solution with 10% normal donkey serum and 0.1% Triton X-100 for 2 h or overnight at 4°C. Sections were stained with primary antibodies for 4 h at room temperature and overnight at 4°C. The primary antibodies were goat anti-SV2A (sc-11936 from Santa Cruz Biotechnology, Santa Cruz, CA) and mouse anti-β-III tubulin (MMS-435P from Covance, Princeton, NJ). The specificity of the antibody for the SV2A isoform has been confirmed by both the manufacturer and other investigators (Kaminski et al. 2009). Staining with primary antibodies was followed by three washes (1 h each) with antibody buffer, followed by incubation with secondary antibodies for 4 h at room temperature and overnight at 4°C. The secondary antibodies were donkey anti-goat Cy3- and donkey anti-mouse Cy2-conjugated F(ab′)2 antibodies (Jackson ImmunoResearch, Westgrove, PA). Staining with secondary antibodies was followed by three washes (1 h each) with antibody buffer and then PBS.
Sections were then mounted on coverslips in molten 1.35% wt/vol noble agar (Sigma-Aldrich, St. Louis, MO) in double distilled H2O at 65°C, dehydrated in ethanol, and cleared in methyl salicylate (Sigma-Aldrich). Agar-embedded sections on coverslips were then mounted in DPX Mountant (Sigma-Aldrich) on slides. Mounted sections were imaged, and confocal stacks were obtained with a Zeiss Axio-scop2 microscope [Plan-Apochromat 20X objective lens, numerical aperture (NA) = 0.75; Germany] on a CARV II spinning disk confocal (BD Biosciences, San Jose, CA). Black and white images were captured with a Hamamatsu Digital Camera (Japan). Levels were adjusted and combined to generate color images using IPLab software (BioVision Technologies, Exton, PA).
Loading and unloading of FM 1–43 and two-photon microscopy.
Hippocampal slices (500 μm) that had incubated in either control ACSF or ACSF containing 30–300 μM LEV (UCB Pharma) and/or 10 μM 6-cyano-7-nitroquinoxaline-2,3-dione (CNQX) (Tocris, Ellisville, MO) were transferred to the recording chamber, which was kept at 32 ± 1°C and perfused at 2 ml/min with the oxygenated ACSF identical to the incubation solution. A bipolar tungsten microelectrode (SNEX-200X; Rhodes Medical Instruments, Summerland, CA) was placed along the Schaffer collateral pathway, and a glass pipette (thick 1.2 mm, World Precision Instruments, Sarasota, FL), pulled to 1 MΩ (P87, Sutter Instrument, Novato, CA), filled with ACSF plus 10 μM of the membrane-selective fluorescent styryl dye FM 1–43 (Invitrogen, Eugene, OR), was placed in CA1 to measure field potentials and inject dye. We stimulated the slices at constant current settings that produced half-maximum extracellular excitatory postsynaptic field potentials. A PV830 pneumatic picopump (World Precision Instruments) connected to the micropipette was used to inject FM 1–43 into CA1. Dye injection began 60 s before and lasted 30 s past the 10-Hz, 2-min exhaustive loading stimulus delivered by the bipolar electrode. The slice was then washed for 25 min with ACSF that additionally contained 100 μM ADVASEP 7 (CyDex Pharmaceuticals, Lenexa, KS) to facilitate removal of nonspecific dye staining (Kay et al. 1999). From this point, ADVASEP 7 remained in the perfusion, as well as CNQX (10 μM), to prevent spontaneous activity, which would result in vesicle fusion and unprompted dye release. The fluorescent axonal terminals were visualized using an Olympus ×40 water immersion objective (LUMPlan FL/IR, NA = 0.80; Tokyo, Japan) and a two-photon Chameleon laser (Coherent, Santa Clara, CA). Stacks of five images separated by 1 μm in the z-plane were collected at each time point to allow for a range of imaging levels in the event that the slice shifted in the z-direction during the imaging period. Images were collected every 1 min for 15 min during the unloading stimulus. The unloading stimulus consisted of a burst of 10 1-ms wide pulses at 40 Hz every 10 s and lasted throughout the entire 15-min imaging period. To completely unload all remaining dye inside vesicles, an additional stimulus of 10 Hz for 4 min was applied, followed by another wash lasting 10 min before a final “background” stack of images was collected.
Electrophysiology.
Hippocampal slices (300 μm) that had incubated for specific durations in either control ACSF or ACSF containing 100–300 μM LEV, 300 μM L060, and/or differing concentrations of magnesium were used. Slices were transferred to the recording chamber (32 ± 1°C) while perfused at 2 ml/min with oxygenated ACSF identical to the incubation solution, but always containing 2 mM magnesium. Again, a bipolar tungsten microelectrode was placed along the Schaffer collateral pathway. Whole cell voltage-clamp recordings were obtained by patching pyramidal cell bodies in the CA1 region of the slice viewed with an infrared differential interference contrast microscope with a Nikon ×40 water immersion lens (Plan, NA = 0.25; Tokyo, Japan). Recording electrodes were made from borosilicate glass capillary tubing (1.5 mm outer diameter, 0.86 mm inner diameter; Sutter Instruments, Novato, CA) using a horizontal micropipette puller (P87, Sutter) and had typical resistances between 4 and 8 MΩ when filled with the following (in mM): 120 potassium-gluconate, 20 KCl, 2 MgCl2, 10 HEPES, 0.2 EGTA, 4 Na2-ATP, 0.3 Tris-GTP, and 14 phosphocreatine. After achieving a gigaseal, the membrane was ruptured to achieve whole cell recording mode, and the neurons were allowed to stabilize for 5 min at −70 mV. Synaptic currents were collected using a PC-One amplifier (Dagan, Minneapolis, MN). All recordings were low-pass filtered at 1 kHz and digitized online at 5 kHz (PCI-6024E, National Instruments, Austin, TX; WinWCP V3.9.2 software, University of Strathclyde, Glasgow, UK). Single pulses or trains of EPSCs were evoked by 1-ms-wide pulses using a constant-current stimulation isolator (World Precision Instruments) with the bipolar electrode. Again, the single-pulse half-maximum stimulation amplitude was determined and was used for the further stimulation of the slice. Stimulation trains at 5–80 Hz were applied. Additional drugs used during electrophysiological recordings included 4-aminopyridine (4-AP) (Sigma-Aldrich) and d-(-)-2-amino-5-phosphonovaleric acid (Tocris).
Data analysis and statistics.
For FM 1–43 experiments, 512 × 512 pixel images were sampled at 0.465 μm pixel size and analyzed using MetaMorph V7.5 (Molecular Devices, Sunnyvale, CA). The fluorescence intensity of FM 1–43 within 50 × 50 pixel squares was averaged, background subtracted, and normalized to the intensity at 0 min. For electrophysiology, the amplitudes of EPSCs were determined offline using custom-programmed software in Matlab (The MathWorks, Natick, MA). Amplitudes were measured by subtracting a baseline current (acquired by averaging the period 3 ms before the stimulus) from the peak current of the EPSC. For trains in which the time between stimuli was less than the time required for full decay of the synaptic current (>20 Hz), the decay phase of the preceding response was fitted with an exponential function, and an extrapolated baseline value was used. All amplitudes determined by the detection program were verified by visual inspection. To further verify the program's accuracy, the EPSC amplitudes for a subset of data were determined by hand in a cursor-to-cursor method and compared with the values given by the program. Agreement between the two was excellent; r2 = 0.94 on average (data not shown). All data are presented as means ± SE. Statistical analyses (*P < 0.05, and **P < 0.01) were performed using Student's two-tailed unpaired t-test, one-way ANOVA, or two-way repeated-measures ANOVA. Multiple comparisons were made using the Tukey test (SigmaStat version 3.11 and SigmaPlot version 9.01; Systat, Point Richmond, CA).
RESULTS
LEV decreases presynaptic release in a concentration- and time-dependent manner.
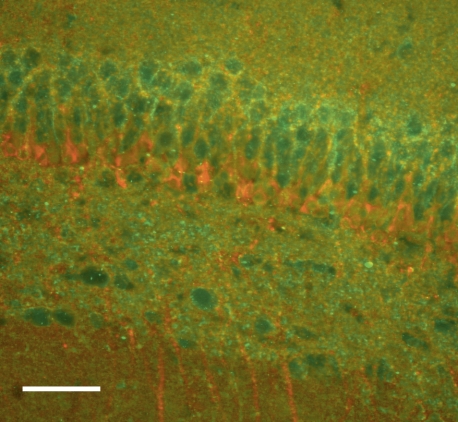
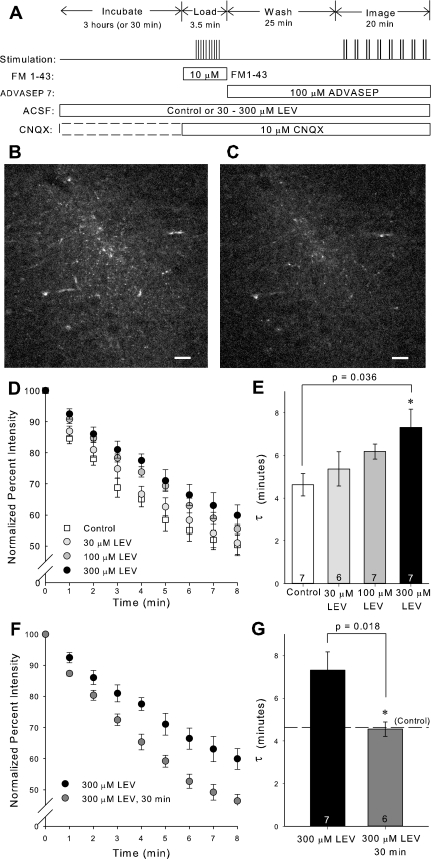
Immunostaining confirmed that SV2A was present in the CA1 region of the hippocampus, where the Schaffer collaterals terminate (Fig. 1). Having established that the target for LEV binding was present in rat hippocampal slices at this age, we investigated whether LEV slowed vesicular release in a dose-dependent manner. Slices were incubated for 3 h in ACSF containing 30–300 μM LEV. The 3-h period was chosen to ensure that full LEV efficacy would be reached for each concentration. After FM 1–43 loading, images were acquired while unloading the dye with 40-Hz stimulation (Fig. 2A). Due to the acquisition time delay involved in two-photon imaging, images could only be acquired once per minute. The differences in fluorescence intensities before and after dye unloading were visually discernible and consistent among slices (Fig. 2, B–C). After background subtraction and normalization of the fluorescence intensity at time 0 min to 100%, average dye-release curves illustrated that LEV slowed the release of the contents of vesicles in a concentration-dependent manner (Fig. 2D). The trend of 300 μM LEV data was statistically significant from control (P = 0.020, two-way repeated-measures ANOVA). Furthermore, single exponential curves were fit to the dye-release curves, and τ values were compared among groups. Statistically larger τ values showed that the drug increased the unloading stimulation required for release of vesicle contents (Fig. 2E). Additionally, we found that LEV's effect was time dependent in this preparation. Presynaptic release was not reduced after relatively short 30-min incubations in LEV, as determined by statistically different τ values between 3-h and 30-min incubations with 300 μM LEV (Fig. 2, F–G). This result was consistent with previous findings that LEV requires a prolonged incubation in slices before its effect is manifest.
Fig. 1.
Synaptic vesicle protein 2A (SV2A) is present in our 2-wk-old hippocampal slices. Immunostaining with a polyclonal antibody to SV2A (green) shows the protein's presence in CA1. Immunostaining with an antibody to β-III tubulin (red) is also shown. Images were collected at ×20, with scale bar = 50 μm.
Fig. 2.
3-Hour treatment with levetiracetam (LEV) slows the release of vesicle contents. A: experimental protocol for loading and unloading FM 1–43 dye. B and C: representative single-plane, two-photon images of FM 1–43 labeled CA1 region of hippocampal slice before (B) and after (C) unloading stimulus. Images are 512 × 512 pixels collected with ×40 lens. Scale bars, 20 μm. D and F: normalized, average dye-release curves over time during bursts of 40-Hz stimulation. E and G: average τ values of dye-release curves. All data shown are means ± SE (n = nos. shown in bar diagram are from at least 3 different animals per group; P values from one-way ANOVA with Tukey multiple comparisons and Student's t-test, respectively). *Significant difference. ACSF, artificial cerebrospinal fluid; CNQX, 6-cyano-7-nitroquinoxaline-2,3-dione.
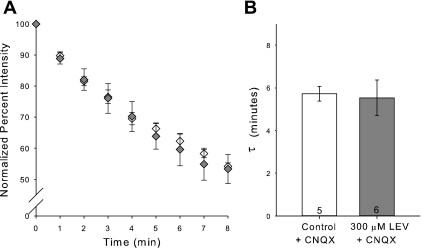
We hypothesized that LEV, while known to be both water and chloroform soluble, might still require a long incubation period to allow ample vesicular endocytosis to achieve SV2A binding. To test this hypothesis, we added CNQX (10 μM) in the incubation ACSF. CNQX is an AMPA and kainate receptor antagonist, which reduces postsynaptic excitability. We anticipated that CNQX would reduce overall spontaneous activity in the slice, leading to a reduction of Schaffer collateral impulses and fewer fusion and recycling events at CA3-CA1 synapses. CNQX did not inhibit the stimulation-triggered loading of FM 1–43 into slices. FM 1–43 destaining curves and their τ values for slices incubated for 3 h in CNQX and slices incubated for 3 h in CNQX plus LEV (300 μM) were not different (Fig. 3). This was our first evidence that preventing synaptic activity could prevent LEV's effect.
Fig. 3.
CNQX blocks the LEV effect. A: normalized, average dye-release curves over time during bursts of 40-Hz stimulation for incubations of control ACSF plus 10 μM CNQX and of ACSF containing 300 μM LEV plus 10 μM CNQX. B: average τ values of dye-release curves. All data shown are means ± SE (n = nos. shown in bar diagram are from at least 3 different animals per group).
Whole cell patch-clamp analysis of LEV's effect on synaptic transmission.
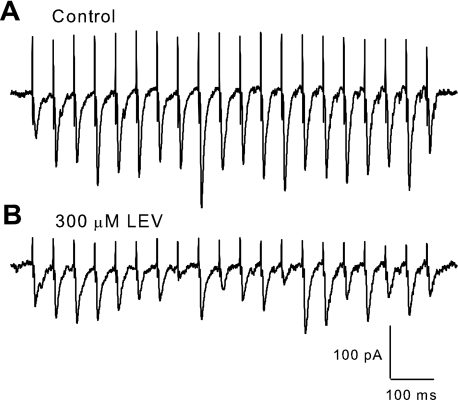
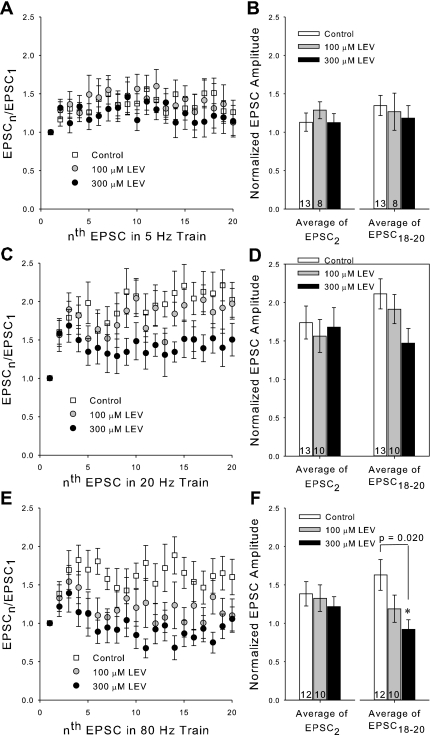
To resolve LEV's effect at much smaller time intervals and ascertain possible effects of stimulation frequency, we recorded EPSCs by voltage clamping pyramidal cell bodies in the CA1 at −70 mV and stimulating Schaffer collaterals with a bipolar electrode. Patches were made in slices that were incubated for at least 3 h in control ACSF or in ACSF plus LEV (100 or 300 μM). Again, the 3-h incubation period was chosen to ensure full LEV efficacy at each concentration. After determining the half-maximum stimulation amplitude for inducing EPSCs, trains at 5–80 Hz were applied. Trains of synaptic currents from control and LEV-treated slices showed facilitation of current amplitudes as expected, but the EPSC amplitudes of LEV-treated slices began to decline compared with controls soon after the first few stimulation pulses for trains 20 Hz and greater (Fig. 4). The effect of LEV was dose dependent, as can be seen by comparing normalized amplitudes for control vs. 100 μM vs. 300 μM LEV slices (Fig. 5). At the beginnings of trains and at slower frequencies, there was little or no difference between control and LEV normalized EPSC amplitudes. No difference was found between paired-pulse ratios (EPSC2 data) at any frequency, suggesting that the mechanism of facilitation by residual calcium within the presynaptic terminal was not affected. However, LEV visibly reduced synaptic currents elicited by pulses later in the trains and at higher frequencies. EPSC measurements were also recorded out to 100 pulses (data not show), and the decrease in EPSC amplitude due to LEV persisted throughout the stimulation.
Fig. 4.
Selected voltage-clamp traces. A and B: comparison of excitatory postsynaptic currents (EPSCs) elicited by a 20-Hz stimulus train illustrates differences between a slice incubated for 3 h in control ACSF (A) and a slice incubated for 3 h in ACSF containing 300 μM LEV (B). There is a strong and lasting facilitation in control traces, while LEV traces show an initial facilitation followed by a decline in EPSC amplitude after the first few pulses.
Fig. 5.
LEV reduces normalized EPSC amplitudes at ends of trains. A, C, and E: average normalized EPSC amplitudes during a 5-, 20-, or 80-Hz train (respectively) of 20 stimulation pulses. B, D, and F: averages of the normalized amplitudes of the 2nd EPSCs and 18th through 20th EPSCs for each of the 5-, 20-, and 80-Hz trains (respectively). All data shown are means ± SE (n = nos. shown in bar diagrams are from at least 4 different animals per group; P values from one-way ANOVA). *Significant difference.
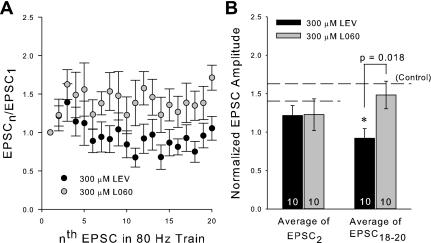
To more strongly link SV2A binding with LEV efficacy and to rule out a nonspecific effect of LEV in our preparation, we recorded from slices incubated 3 h in 300 μM L060, LEV's enantiomer, which has 1,000-fold lower affinity for SV2A (Gillard et al. 2006) and is inactive as an AED in animal models (Gower et al. 1992). Trains of EPSCs from slices incubated for 3 h in 300 μM L060 did not differ greatly from EPSCs recorded from control slices at any frequency. At 80 Hz, the average normalized EPSC amplitudes at the end of trains were significantly different between LEV and L060 groups (Fig. 6). Thus SV2A binding appears to be critical for reduction of EPSCs.
Fig. 6.
L060, the enantiomer of LEV, does not reduce normalized EPSC amplitudes. A: average normalized EPSC amplitudes during an 80-Hz train of 20 stimulation pulses. B: averages of the normalized amplitudes of the 2nd EPSCs and 18th through 20th EPSCs of the 80-Hz trains for slices incubated for 3 h in 300 μM L060 compared with previous 3-h 300 μM LEV data. All data shown are means ± SE (n = nos. shown in bar diagram are from at least 3 different animals per group; P values from Student's t-test). *Significant difference.
We also performed a limited number of experiments with the LEV concentration increased to 1 mM to determine LEV's near-maximum effect on synaptic transmission. At this concentration, which is much higher than serum levels in patients receiving the drug, synaptic transmission persisted and was not reduced much more than for 300 μM LEV-treated slices (data not shown). Thus there is no evidence that LEV ever fully blocks neurotransmitter release.
LEV reduces the RRP of vesicles.
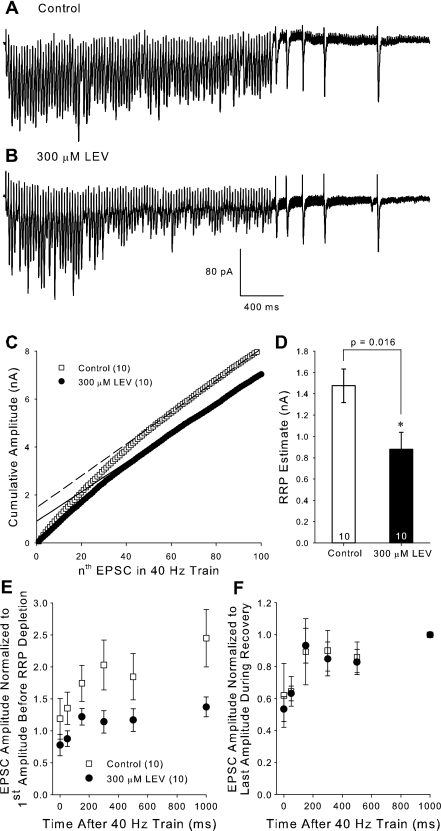
To investigate the specific release mechanisms affected by LEV, we recorded EPSCs during a stimulation protocol that allowed us to estimate the size of the RRP, as well as monitor vesicle recycling in slices incubated for 3 h in either control ACSF or LEV (300 μM). Stimulation consisted of 100 pulses at 40 Hz (Fig. 7, A and B). EPSC amplitudes were summed to form cumulative amplitude plots (Fig. 7C) (Schneggenburger et al. 1999; Stevens and Williams 2007). For slices incubated in LEV, the later points of the averaged cumulative plot diverged from control due to their smaller EPSC amplitudes during the earlier phase of the stimulation. The portions of the plots beyond 60 stimuli were then linearly fit to determine the y-axis intercept of that line, the approximation of the RRP. Incubation in 300 μM LEV decreased the RRP in our slices (Fig. 7D). This finding was not biased by EPSC amplitude variability between control and LEV-treated slices, because the average amplitude of the first EPSC of the control group (62.23 ± 9.24 pA) and LEV group (67.95 ± 7.55 pA) was the same.
Fig. 7.
LEV decreases the RRP but does not shift the time course of recycling. A and B: selected voltage clamp traces during the 100-pulse, 40-Hz train used to estimate the readily releasable pool (RRP) from slices incubated for 3 h in control or in 300 μM LEV ACSF, respectively. C: average cumulative EPSC amplitude plots and their linear fits to the last 40 EPSCs (dashed lines). D: average estimated RRP values. E and F: average EPSCs measured from the recovery pulses normalized to the first amplitude of the 100-pulse train (E) and normalized to the last amplitude during recovery (F). The amplitude at time 0 ms was the last EPSC of the 100-pulse train. All data shown are means ± SE (n = nos. shown in legend or bar diagram are from at least 8 different animals per group; P value from Student's t-test). *Significant difference.
We analyzed LEV's effect on vesicle recycling by eliciting single EPSCs of 50, 150, 300, 500, and 1,000 ms following the 100-pulse, 40-Hz stimulation during which the RRP was depleted (Fig. 7, A and B). As expected, EPSC amplitudes recovered in an exponential manner shortly after the end of the train. When we compared these normalized EPSCs to the first EPSC in the train (Fig. 7E), we found that LEV decreased the amplitude of recovery. At 1 s after the train, control EPSCs recovered to 2.45 ± 0.45 times the amplitude of the first EPSC, while recovery in LEV-treated slices was only 1.37 ± 0.15 times the first EPSC [P = 0.037, Student's t-test, degrees of freedom (dof) = 18]. The increase in EPSC size may have been due to presynaptic potentiation by glutamate occurring as a result of the high-frequency train, which was prevented when LEV was present. When we compared averaged EPSC amplitudes normalized to the 1-s EPSC amplitude, we found that LEV did not shift the time course of recycling (P = 0.845, F = 0.0392, two-way repeated measures ANOVA, total dof = 119) (Fig. 7F). Each curve reached its respective plateau as vesicles were replenished at about the same time.
If LEV decreases the RRP, but does not affect its rate of replenishment, then the RRP is prone to being depleted at earlier time points during stimulation. Our data do not suggest that LEV hinders the presynaptic machinery necessary for prolonged vesicle release, that is, during the relatively exhaustive phase of the train where steady-state EPSC amplitudes are reached. Steady-state amplitudes (averaged from the 61st to the 100th pulses) for LEV-treated slices (61.64 ± 9.65) were only slightly reduced compared with controls (66.59 ± 11.72). Note that the linearly fitted lines in the cumulative amplitude plots are approximately parallel. Reduction of the RRP is a substantial clue to the mechanism of LEV, because depleting transmitter reserves is likely to contribute to the termination of burst discharges in seizures (Staley et al. 1998; McCormick and Contreras 2001).
Manipulating slice synaptic activity modifies LEV's effect.
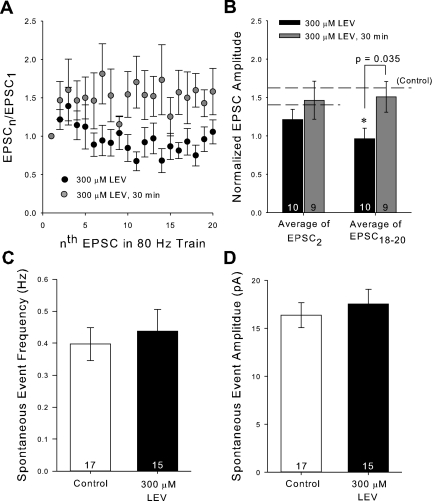
We decided to further test the hypothesis that spontaneous synaptic activity and vesicle recycling, over the course of a long enough incubation period, were required for LEV to reach SV2A. We repeated the same short 30-min incubation protocol used for the two-photon experiments and found little difference between recordings measured with LEV (300 μM) compared with control during trains of any frequency. There was still a statistical difference between EPSC amplitudes of 30 min vs. 3-h LEV-treated slices (Fig. 8, A and B). We went on to verify that LEV itself does not cause a change in the amount of spontaneous activity. We recorded from neurons from control and 300 μM LEV-treated slices in the absence of stimulation and counted the number of spontaneous EPSCs (sEPSC). One event was defined as an inward current of at least 10 pA. We found that LEV did not change the frequency (P = 0.632, Student's t-test, dof = 30) or the amplitude (P = 0.560, Student's t-test, dof = 30) of sEPSCs (Fig. 8, C and D).
Fig. 8.
Short incubations do not induce LEV's effect. A: average normalized EPSC amplitudes during an 80-Hz train of 20 stimulation pulses. B: averages of the normalized amplitudes of the 2nd EPSCs and 18th through 20th EPSCs of the 80-Hz trains for slices incubated for 30 min in 300 μM LEV compared with previous 3-h data. C and D: average frequency (C) and amplitude (D) of spontaneous EPSC (sEPSC) events. All data shown are means ± SE (n = nos. shown in bar diagrams are from at least 6 different animals per group; P value from Student's t-test). *Significant difference.
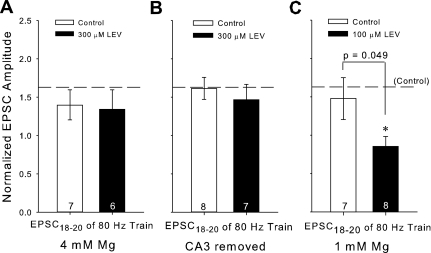
A variety of other variables were subsequently manipulated to determine whether synaptic activity and vesicular release control LEV's efficacy and to verify that our two-photon results with CNQX were not anomalous. First, we reduced slice spontaneous activity during the 3-h LEV incubation by decreasing the Ca2+/Mg2+ incubation ratio from 2 mM/2 mM to 2 mM/4 mM. Mg2+ was restored to 2 mM 10 min before and during patching. Under these conditions, there was almost no difference in EPSCs between control and 300 μM LEV-treated slices after the full 3-h incubation (Fig. 9A).
Fig. 9.
Factors that affect the amount of spontaneous activity in a slice during LEV incubation can prevent or facilitate LEV's effect. A, B, and C: averages of the normalized amplitudes of the 18th through 20th EPSCs for 80-Hz trains for slices incubated 3 h in 4 mM Mg ± 300 μM LEV (A), slices incubated 3 h with removed CA3 regions ± 300 μM LEV (B), or slices incubated 3 h in 1 mM Mg ± 100 μM LEV (C) compared with previous control averages (horizontal reference lines). All data shown are means ± SE (n = nos. shown in bar diagrams are from at least 4 different animals per group; P value from Student's t-test). *Significant difference.
Second, we removed the Schaffer collateral output of CA3 neurons in each slice with a single cut across CA2, which decreased spontaneous activity at the CA3-CA1 synapse. This still allowed initiation of action potentials at the same point on the Schaffer collaterals, and the synaptic current amplitudes were similar between control-CA3 removed slices and previous controls (data not shown). This maneuver also eliminated LEV's effect, even after 3-h incubation. All average EPSC comparisons in this group were statistically insignificant (Fig. 9B).
Third, we employed the converse strategy and increased spontaneous activity during slice incubation. When the Ca2+/Mg2+ ratio was increased to 2 mM/1 mM in the presence of 100 μM LEV (again Mg2+ was restored to 2 mM 10 min before and during patching), we observed a significant reduction of EPSC amplitudes at the end of 80-Hz trains compared with the previous 100 μM LEV data and its control (compare Figs. 5F and 9C). While we found no other comparisons in this low-Mg2+ group that were statistically different, the trend of LEV decreasing EPSCs during higher frequency trains was steady and stronger than for 100 μM LEV incubations in standard ACSF.
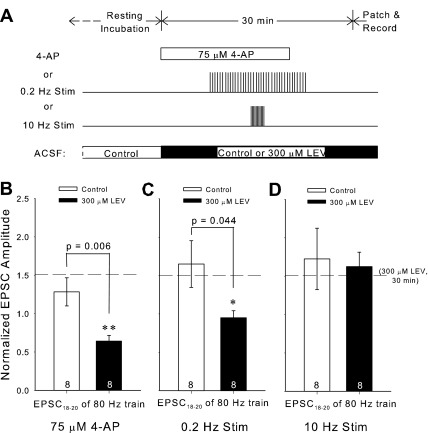
Fourth, we accelerated the time course of LEV's effect with 4-AP, a potassium channel blocker, which increases sEPSC frequency and amplitude in CA1 (Martin et al. 2001). We added 4-AP (75 μM) to the ACSF for a 20-min period within the short 30-min window of 300 μM LEV perfusion (Fig. 10A). Perfusion was then returned to ACSF without 4-AP 10 min before patching to allow for spontaneous slice activity to return to baseline. To confirm that 4-AP increased sEPSCs, we recorded from slices during 4-AP perfusion. The drug's effect was clearly visible. The average frequency of sEPSCs increased ∼4-fold to 1.59 Hz in control ACSF and 1.73 Hz in ACSF plus 300 μM LEV. sEPSC amplitude also increased to 29.7 and 26.8 pA, respectively, an increase of ∼1.5 times previous values. In the presence of 4-AP, LEV's effect was evident within 30 min (Fig. 10B). The differences in averages for the 18th to 20th EPSCs were statistically significant for both 80-Hz (P = 0.006, Student's t-test, dof = 14) and 20-Hz trains (P = 0.006, Student's t-test, dof = 14) (20-Hz data not shown). This is strikingly different from a 30-min exposure to 300 μM LEV, which, under control conditions, did not cause a LEV effect (Fig. 8, A and B).
Fig. 10.
Inducing low-frequency activity reveals an early LEV effect. A: experimental protocol for each choice of activity augmentation: 4-aminopyridine (4-AP) perfusion, 0.2-Hz stimulation, or 10-Hz stimulation. B, C, and D: averages of the normalized amplitudes of the 18th through 20th EPSCs of 80-Hz trains for slices incubated for 30 min in control or 300 μM LEV ACSF with either 4-AP perfusion (B), 0.2-Hz stimulation (C), or 10-Hz stimulation (D). The horizontal reference line marks the comparable average from slices treated 30 min with 300 μM LEV. All data shown are means ± SE (n = nos. shown in bar diagrams are from at least 3 different animals per group; P values from Student's t-test). *,**Significant differences.
Low-, but not high-, frequency stimulation permits LEV's effect.
We next wondered if we could again shorten the incubation time required for LEV's effect, this time by direct stimulation. Using the same bipolar stimulating electrode to activate Schaffer collaterals, we elicited trains of either relatively low- (0.2 Hz) or high- (10 Hz) frequency stimulation during the short 30-min incubation period with 300 μM LEV. Regardless of frequency, a total of 180 pulses were delivered to the slices, and the trains of 180 pulses were centered within the 30-min window of LEV treatment before patching (Fig. 10A). Surprisingly, compared with no drug, 0.2-Hz stimulation with LEV (300 μM) during the 30-min incubation significantly reduced normalized EPSC amplitudes at the ends of 80-Hz trains, while 10-Hz stimulation did not (Fig. 10, C and D). The difference between 0.2-Hz and 10-Hz stimulation, both with LEV, was also significant (P = 0.006, Student's t-test, dof = 14). Comparisons from beginnings of trains and at frequencies <80 Hz were not significant, but did support the respective trends. The difference between 10-Hz stimulation and the relatively slow 0.2-Hz stimulation and 4-AP incubation on LEV modulation of burst properties suggests that there may be a stimulation frequency window necessary for manifestation of LEV's effect.
Application of sucrose hastens LEV's efficacy and washout.
Finally, we exploited the well-known ability of hypertonic sucrose to induce soluble N-ethylmaleimide-sensitive factor attachment protein receptor-dependent and calcium-independent release of the RRP of vesicles and to selectively load the RRP with an FM dye (Rosenmund and Stevens 1996; Stanton et al. 2005). By applying ACSF supplemented with sucrose (800 mosmol) for 25 s, we triggered vesicle fusion and subsequent recycling. We were especially interested in exploiting this technique to “load” LEV into RRP vesicles. We predicted that we could facilitate LEV's entry into vesicles and, therefore, see an almost immediate reduction in EPSCs at the ends of high-frequency trains. Moreover, we expected we could speed LEV's exit from vesicles with a second sucrose application and quickly see EPSC amplitudes return to control levels.
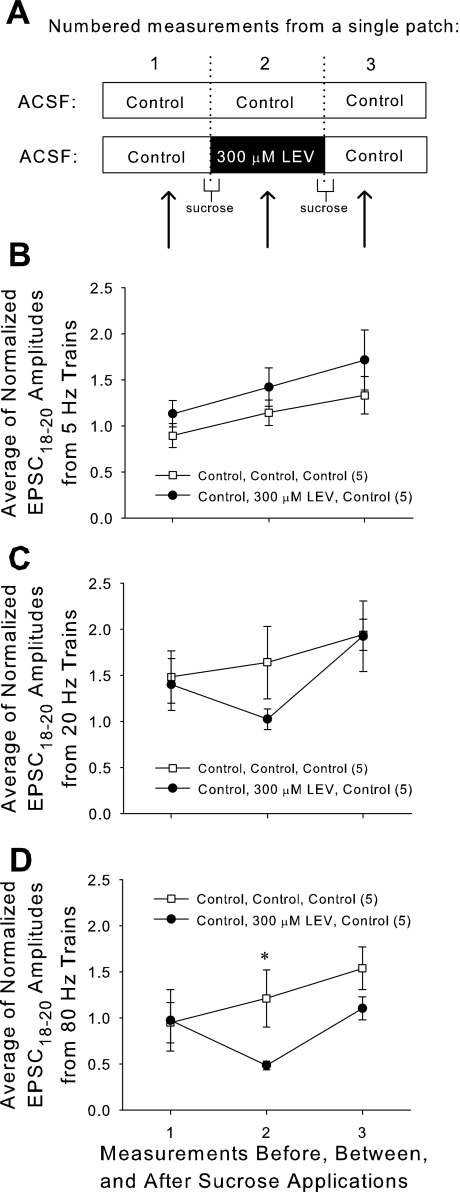
In each slice, a single CA1 neuron was patched for >30 min while we carried out the following protocol: 1) obtain baseline control EPSC measurements; 2) apply first sucrose dose; 3) allow 10-min rest; 4) obtain EPSC measurements; 5) apply second dose of sucrose; 6) allow another 10-min rest; and 7) obtain EPSC measurements. For slices only exposed to control solution (“Control, Control, Control”), the perfusion always consisted of control ACSF. For LEV exposed slices (“Control, 300 μM LEV, Control”), perfusion consisted of control ACSF, except for two segments: the first sucrose application included 300 μM LEV, and this was followed by 10 min of rest perfusion with 300 μM LEV, at the end of which the second round of EPSC measurements was made (Fig. 11A). EPSC measurements were identical to those performed previously, and amplitudes were normalized to the height of the first EPSC of each train. Unfortunately, absolute values of EPSCs could not be compared between measurements in the same slice, because sucrose application caused a decline of absolute amplitudes, and the stimulation current had to be adjusted.
Fig. 11.
Repeated treatment with hypertonic sucrose can boost LEV's entry and exit of synaptic vesicles and reveal an accelerated LEV effect. A: two doses of sucrose were applied while the same neuron was patched. ACSF combinations during that patch period are as shown. EPSC measurements were taken during each of the three labeled time periods. B, C, and D: averages of the normalized amplitudes of the 18th through 20th EPSCs of 5-Hz (B), 20-Hz (C), and 80-Hz (D) trains applied to slices before, between, and after sucrose applications. All data shown are means ± SE (n = nos. shown in legend are from at least 4 different animals per group; P value = 0.049 from Student's t-test). *Significant difference.
When EPSCs were measured at the time when LEV was “loaded” into slices (measurement no. 2 in Fig. 11, B–D), there was a decrease in normalized amplitudes near the ends of stimulation trains for high frequencies. This demonstrated that LEV's effect can manifest in as little as 10 min, if large amounts of vesicle recycling into the RRP occur during that time. At 80 Hz, the difference between control and 300 μM LEV “loaded” slices was significant (P = 0.049, Student's t-test, dof = 14). Upon the second sucrose application with the intent of “unloading” LEV, the effect of the drug was removed, and EPSCs returned near control levels, confirming a facilitated washout of LEV. During normal slice activity, LEV's effect was not easily washed out. When slices incubated for 3 h in 300 μM LEV (to achieve full LEV effect) were then allowed to incubate for 1 h in control ACSF (as a washout period), a strong LEV effect was still present (data not shown). However, LEV's effect dissipated within ∼10 min following a second sucrose application with control ACSF.
DISCUSSION
Synaptic activity modulates the efficacy of LEV.
There is a clear relationship between synaptic activity and the efficacy of LEV. Almost all manipulations during LEV incubation that increased activity and vesicular recycling were followed by a corresponding increase in LEV's effect. Conversely, we could diminish LEV's effect by reducing activity. Perhaps most convincing is the loading-unloading protocol with hypertonic sucrose that quickly induced and abolished LEV's effect by exchange of vesicular contents. While not absolutely definitive, these results are compatible with LEV entry into vesicles during recycling and endocytosis and its escape during vesicle fusion. With the data supporting this mode of entry for LEV, we further hypothesize that LEV's binding site with SV2A may be at an intravesicular portion of the protein or at a region that can be accessed from the intravesicular side of the protein.
There are some counterintuitive observations described above that require elaboration. The absence of LEV's effect after the 10-Hz stimulation and after short LEV incubation followed by FM dye loading with 10-Hz stimulation were initially puzzling. This absence was seen even when LEV was present during stimulation. It is possible that high-frequency stimulation induces presynaptic potentiation that masks a decrease in neurotransmitter release due to LEV. However, this is unlikely because LEV's effect was clearly present during two-photon imaging after longer incubations (Fig. 2, D and E).
There are at least two more likely explanations. First, as synaptic vesicles fuse and recycle, they expose their intravesicular surfaces to the extracellular space and LEV. If LEV binds SV2A and is taken up into those recycled vesicles, their release probabilities will then be modified (see below). If this happens to a sufficient number of vesicles, LEV's effect will be evident during subsequent stimulation. During long incubations or low-frequency activity (spontaneous activity, 0.2-Hz stimulation, or 4-AP exposure), a large number of vesicles from the RRP and recycling pools participate in release (Denker and Rizzoli 2010). However, at higher frequency activity (10 Hz), a smaller population from those pools may disproportionately contribute to release through “kiss-and-run” fusion due to the reuse of the vesicles that undergo this type of fusion (Aravanis et al. 2003). Evidence for kiss-and-run fusion events exists for small synapses of the central nervous system, and it is also clear that individual vesicles can fuse and release their contents multiple times via this mechanism (Aravanis et al. 2003). Furthermore, the relative contribution of kiss-and-run increases during higher frequency (10-Hz) stimulation (Zhang et al. 2009). Thus LEV application during rapid stimulation may cause LEV to be taken up into relatively few fusing vesicles, resulting in an immeasurable LEV effect upon subsequent stimulation.
Alternatively, to explain the two-photon data, FM 1–43 binding sites may exceed those for LEV, so that, during one round of vesicle fusion and recycling, many more FM 1–43 than LEV molecules bind within vesicles. As a result, the vesicle pool is fluorescently labeled, but not affected by LEV. This may explain why short incubations in LEV still exhibit little LEV effect, even after “loading” extracellular contents. The ideal experiment would allow us to directly image LEV in vesicles, but a fluorescently tagged, functional LEV derivative has yet to be developed.
Synaptic activity may also be the main factor in determining the onset of LEV's antiepileptic action in vivo. Pharmacokinetic research indicates that LEV levels in cerebrospinal fluid peak within a few hours after initial oral administration (Doheny et al. 1999; Patsalos 2004), similar to other AEDs. Yet the onset of LEV's anticonvulsant effect can take up to 2 days after treatment initiation (Stefan et al. 2006), far longer than benzodiazepines, which clearly act extracellularly (Riss et al. 2008). This delayed onset of action could be explained by the requirement for synaptic activity to “load” LEV into presynaptic terminals. The unexpectedly short latency of onset (15–30 min) of LEV activity in status epilepticus is also consistent with an activity dependence of LEV loading (Fattouch et al. 2010) and the possibility that LEV may be preferentially loaded into neurons generating the epileptic activity.
The mechanism of action of LEV.
Because LEV's efficacy appears to depend on binding to SV2A, whose exact role in vesicle function remains uncertain, understanding LEV's precise mechanism of action remains elusive. SV2A is thought to participate in priming vesicles at an unidentified step before fusion (Custer et al. 2006; Chang and Sudhof 2009), or to alter SV2A's affinity for synaptotagmin. Interactions between synaptotagmin and SV2A have been well described (Schivell et al. 1996, 2005; Yao et al. 2010). Yet others argue that SV2A does not modulate neurotransmission by directly acting on synaptotagmin, but switches vesicles into a more Ca2+- and synaptotagmin-responsive state (Chang and Sudhof 2009). Another SV2 protein, SV2B, has also been shown to play a role related to presynaptic Ca2+ (Wan et al. 2010). After examining our data in combination with the current literature on SV2 proteins, we suggest two plausible mechanisms for the complicated effect(s) of LEV.
First, as we indicated above, LEV could gain intravesicular access to SV2A via vesicle recycling and endocytosis. An SV2A protein bound by LEV may then be inhibited from participating in its usual role of priming vesicles, and, as a result, production of fewer primed vesicles leads to a smaller RRP and decreased neurotransmission. A second possibility is that LEV directly crosses the plasma membrane to directly enter the presynaptic terminal and bind to SV2A's cytoplasmic side. Once bound, LEV could similarly alter the protein's role in vesicle priming. However, vesicles “preprimed” by SV2A, before LEV exposure, would already be competent for Ca2+-triggered fusion (Chang and Sudhof 2009) and unaffected by LEV. LEV could then only influence the newly recycled vesicles that are subject to an SV2A-dependent step before fusion. Therefore, a change in neurotransmission would only become noticeable after a sufficient number of vesicles had recycled in the presence of LEV. This would account for activity dependence of LEV without requiring its presence within the vesicle. However, if this is the correct explanation for activity dependence, it is difficult to explain why LEV's effect disappears after sucrose exposure (Fig. 11). This sucrose result supports, but does not absolutely confirm, our first suggestion.
Either of these models would be compatible with LEV's stimulation rate dependence on EPSC trains. LEV's effect on vesicles in the RRP would not necessarily be uniform for the entire vesicle fraction. Vesicles in the RRP that bound a low concentration of LEV might be normally released by the first few action potentials in the stimulation train, whereas those that had higher levels of LEV would have a lower release probability, explaining the relative decrement later in the EPSC train. This would account for the progressive drop in EPSCn/EPSC1 as stimulus number (n) increases, or this could be a result of smaller RRPs being exhausted faster.
The patch-clamp data presented here show LEV's effect on excitatory synaptic transmission. When we added CNQX (10 μM) and d-(-)-2-amino-5-phosphonovaleric acid (50 μM) to the perfusion while recording, all synaptic currents were blocked (data not shown). Our laboratory is currently in the process of testing LEV's ability to reduce inhibitory synaptic transmission.
LEV is not the only pharmacological agent that enters synaptic vesicles.
To our knowledge, LEV is the only drug that requires some form of vesicular access to modulate synaptic transmission. A number of widely used drugs alter transmitter release or re-uptake, but through mechanisms totally different from LEV. However, the clostridial toxins botulinum neurotoxin A and tetanus neurotoxin both share sites of action with LEV, entering vesicles by binding to SV2 within the vesicle lumen (Dong et al. 2006; Yeh et al. 2010). Botulinum neurotoxin A seems to exhibit a latency before effect, which is shortened when neurotransmitter release is stimulated (Hughes and Whaler 1962). Similarly, staining for tetanus neurotoxin demonstrates that its activity-dependent entry into nerve terminals resembles LEV (Yeh et al. 2010). Both toxins completely block neurotransmitter release after cleaving soluble N-ethylmaleimide-sensitive factor attachment protein receptor proteins (Schiavo et al. 1992; Blasi et al. 1993). Once transmitter release is blocked, further access to that vesicle is prevented, leaving the remaining toxin in the region available to target additional active vesicles. A similar amplification mechanism may apply for LEV. The vesicles that do not contain LEV are relatively more likely to fuse, recycle, and then take up LEV themselves. In addition, if the turnover of vesicle contents is slower after LEV application, LEV is less likely to be washed out.
LEV's effect on transmitter release is modulatory, not absolute.
Because SV2A only modulates neurotransmitter release, synaptic transmission is preserved in cultured neurons after SV2A knockout (Custer et al. 2006; Chang and Sudhof 2009). Therefore, a drug that binds this protein might not have a large effect on release and should never completely block release. This was exactly what was observed in our experiments. The high concentrations of LEV used in these experiments were chosen to allow us to observe significant differences between control and drug-treated slices. Although the drug concentration required to induce a readily quantifiable electrophysiological change in single patched neurons is almost certainly greater than the concentration required for seizure control, the LEV concentration we most frequently employed (300 μM) is within the range of CSF concentrations in rats treated with anticonvulsive doses of LEV (100–500 μM) (Doheny et al. 1999). In support of our proposed LEV mechanism of action, we have recently replicated all of our LEV results with much lower concentrations of a LEV derivative with higher SV2A affinity (unpublished observations). The most convincing proof of principle would be to demonstrate absence of LEV activity in slices from SV2A knockout animals. However, such experiments are not possible, because SV2A knockouts in mice are quickly lethal (Crowder et al. 1999).
A final fascinating aspect of LEV pharmacology is the dissociation between the (low) frequency of synaptic activity necessary for LEV entry into vesicles and the (high) frequency at which the largest reductions in EPSCs take place. These characteristics suggest that LEV may eventually access most neurons, but selectively diminish neurotransmitter release during the later impulses of long, high-frequency bursts, as observed during seizures. The latter property makes LEV particularly attractive as an AED, because it will have a relatively greater effect on rapid, pathological neuronal firing. This relative preservation of low-frequency activity is consistent with the drug's high therapeutic index (French et al. 2001; Abou-Khalil 2005).
LEV is the first of a new class of AEDs in clinical use. Even though we still have only incomplete knowledge of its mechanism of action, it is already clear that it uniquely targets the paroxysmal activity characteristic of seizures. We believe that a fuller understanding of LEV and its newer derivatives will lead to the development of more drugs that target vesicular proteins as a specific way to prevent seizures, as well as to treat other neurological diseases caused by disordered neurotransmission.
GRANTS
This work was supported by grants from the National Institutes of Health (Grants 5T90-DK070106 and P30-EY11374) and UCB Pharma, Belgium.
DISCLOSURES
The work described in this paper was supported by a scientific grant from UCB Pharma. Communication with them did not influence the planning or analysis of experiments.
ACKNOWLEDGMENTS
We thank Drs. Sandra Bajjalieh, Alain Matagne, Isabelle Niespodziany, and Christian Wolff, who critiqued preliminary versions of this paper; Dr. John Dempster of the University of Strathclyde, who provided the electrophysiology software; and Dr. William Kennedy and Gwen Wendelschafer-Crabb, who provided antibodies and the use of the confocal microscope.
REFERENCES
- Abou-Khalil B. Benefit-risk assessment of levetiracetam in the treatment of partial seizures. Drug Saf 28: 871–890, 2005 [DOI] [PubMed] [Google Scholar]
- Aravanis AM, Pyle JL, Tsien RW. Single synaptic vesicles fusing transiently and successively without loss of identity. Nature 423: 643–647, 2003 [DOI] [PubMed] [Google Scholar]
- Birnstiel S, Wülfert E, Beck SG. Levetiracetam (ucb LO59) affects in vitro models of epilepsy in CA3 pyramidal neurons without altering normal synaptic transmission. Arch Pharm (Weinheim) 356: 611–618, 1997 [DOI] [PubMed] [Google Scholar]
- Blasi J, Chapman ER, Link E, Binz T, Yamasaki S, De Camilli P, Sudhof TC, Niemann H, Jahn R. Botulinum neurotoxin A selectively cleaves the synaptic protein SNAP-25. Nature 365: 160–163, 1993 [DOI] [PubMed] [Google Scholar]
- Chang WP, Sudhof TC. SV2 renders primed synaptic vesicles competent for Ca2+-induced exocytosis. J Neurosci 29: 883–897, 2009 [DOI] [PMC free article] [PubMed] [Google Scholar]
- Crowder KM, Gunther JM, Jones TA, Hale BD, Zhang HZ, Peterson MR, Scheller RH, Chavkin C, Bajjalieh SM. Abnormal neurotransmission in mice lacking synaptic vesicle protein 2A (SV2A). Proc Natl Acad Sci USA 96: 15268–15273, 1999 [DOI] [PMC free article] [PubMed] [Google Scholar]
- Custer KL, Austin NS, Sullivan JM, Bajjalieh SM. Synaptic vesicle protein 2 enhances release probability at quiescent synapses. J Neurosci 26: 1303–1313, 2006 [DOI] [PMC free article] [PubMed] [Google Scholar]
- Denker A, Rizzoli SO. Synaptic vesicle pools: an update. Front Syn Neurosci 2: 135, 2010 [DOI] [PMC free article] [PubMed] [Google Scholar]
- Doheny HC, Ratnaraj N, Whittington MA, Jefferys JGR, Patsalos PN. Blood and cerebrospinal fluid pharmacokinetics of the novel anticonvulsant levetiracetam (ucb L059) in the rat. Epilepsy Res 34: 161–168, 1999 [DOI] [PubMed] [Google Scholar]
- Dong M, Yeh F, Tepp WH, Dean C, Johnson EA, Janz R, Chapman ER. SV2 is the protein receptor for botulinum neurotoxin A. Science 312: 592–596, 2006 [DOI] [PubMed] [Google Scholar]
- Fattouch J, Di Bonaventura C, Casciato S, Bonini F, Petrucci S, Lapenta L, Manfredi M, Prencipe M, Giallonardo AT. Intravenous levetiracetam as first-line treatment of status epilepticus in the elderly. Acta Neurol Scand 121: 418–421, 2010 [DOI] [PubMed] [Google Scholar]
- French J, Edrich P, Cramer JA. A systematic review of the safety profile of levetiracetam: a new antiepileptic drug. Epilepsy Res 47: 77–90, 2001 [DOI] [PubMed] [Google Scholar]
- Gillard M, Chatelain P, Fuks B. Binding characteristics of levetiracetam to synaptic vesicle protein 2A (SV2A) in human brain and in CHO cells expressing the human recombinant protein. Eur J Pharmacol 536: 102–108, 2006 [DOI] [PubMed] [Google Scholar]
- Gower AJ, Noyer M, Verloes R, Gobert J, Wulfert E. ucb L059, a novel anti-convulsant drug: pharmacological profile in animals. Eur J Pharmacol 222: 193–203, 1992 [DOI] [PubMed] [Google Scholar]
- Hughes R, Whaler BC. Influence of nerve-ending activity and of drugs on the rate of paralysis of rat diaphragm preparations by Cl botulinum type A toxin. J Physiol 160: 221–233, 1962 [DOI] [PMC free article] [PubMed] [Google Scholar]
- Kaminski RM, Gillard M, Leclercq K, Hanon E, Lorent G, Dassesse D, Matagne A, Klitgaard H. Proepileptic phenotype of SV2A-deficient mice is associated with reduced anticonvulsant efficacy of levetiracetam. Epilepsia 50: 1729–1740, 2009 [DOI] [PubMed] [Google Scholar]
- Kay AR, Alfonso A, Alford S, Cline HT, Holgado AM, Sakmann B, Snitsarev VA, Stricker TP, Takahashi M, Wu L. Imaging synaptic activity in intact brain and slices with FM1–43 in C. elegans, lamprey, and rat. Neuron 24: 809–817, 1999 [DOI] [PubMed] [Google Scholar]
- Kennedy WR, Wendelschafer-Crabb G, Polydefkis M, McArthur J. Pathology and quantitation of cutaneous nerves. In: Peripheral Neuropathy, edited by Dyck PJ, Thomas PK. Philadelphia, PA: Saunders, 2005, p. 869–896 [Google Scholar]
- Lynch BA, Lambeng N, Nocka K, Kensel-Hammes P, Bajjalieh SM, Matagne A, Fuks B. The synaptic vesicle protein SV2A is the binding site for the antiepileptic drug levetiracetam. Proc Natl Acad Sci USA 101: 9861–9866, 2004 [DOI] [PMC free article] [PubMed] [Google Scholar]
- Margineanu DG, Klitgaard H. Levetiracetam has no significant gamma-aminobutyric acid-related effect on paired-pulse interaction in the dentate gyrus of rats. Eur J Pharmacol 466: 255–261, 2003 [DOI] [PubMed] [Google Scholar]
- Martin ED, Araque A, Buno W. Synaptic regulation of the slow Ca2+-activated K+ current in hippocampal CA1 pyramidal neurons: implication in epileptogenesis. J Neurophysiol 86: 2878–2886, 2001 [DOI] [PubMed] [Google Scholar]
- McCormick DA, Contreras D. On the cellular and network bases of epileptic seizures. Annu Rev Physiol 63: 815–846, 2001 [DOI] [PubMed] [Google Scholar]
- Patsalos PN. Clinical pharmacokinetics of levetiracetam. Clin Pharmacokinet 43: 707–724, 2004 [DOI] [PubMed] [Google Scholar]
- Riss J, Cloyd J, Gates J, Collins S. Benzodiazepines in epilepsy: pharmacology and pharmacokinetics. Acta Neurol Scand 118: 69–86, 2008 [DOI] [PubMed] [Google Scholar]
- Rosenmund C, Stevens CF. Definition of the readily releasable pool of vesicles at hippocampal synapses. Neuron 16: 1197–1207, 1996 [DOI] [PubMed] [Google Scholar]
- Schiavo G, Benfenati F, Poulain B, Rossetto O, Polverino de Laureto P, DasGupta BR, Montecucco C. Tetanus and botulinum-B neurotoxins block neurotransmitter release by proteolytic cleavage of synaptobrevin. Nature 359: 832–835, 1992 [DOI] [PubMed] [Google Scholar]
- Schivell AE, Batchelor RH, Bajjalieh SM. Isoform-specific, calcium-regulated interaction of the synaptic vesicle proteins SV2 and synaptotagmin. J Biol Chem 271: 27770–27775, 1996 [DOI] [PubMed] [Google Scholar]
- Schivell AE, Mochida S, Kensel-Hammes P, Custer KL, Bajjalieh SM. SV2A and SV2C contain a unique synaptotagmin-binding site. Mol Cell Neurosci 29: 56–64, 2005 [DOI] [PubMed] [Google Scholar]
- Schneggenburger R, Meyer AC, Neher E. Released fraction and total size of a pool of immediately available transmitter quanta at a calyx synapse. Neuron 23: 399–409, 1999 [DOI] [PubMed] [Google Scholar]
- Staley KJ, Longacher M, Bains JS, Yee A. Presynaptic modulation of CA3 network activity. Nat Neurosci 1: 201–209, 1998 [DOI] [PubMed] [Google Scholar]
- Stanton PK, Winterer J, Zhang XL, Muller W. Imaging LTP of presynaptic release of FM1–43 from the rapidly recycling vesicle pool of Schaffer collateral-CA1 synapses in rat hippocampal slices. Eur J Neurosci 22: 2451–2461, 2005 [DOI] [PubMed] [Google Scholar]
- Stefan H, Wang-Tilz Y, Pauli E, Dennhöfer S, Genow A, Kerling F, Lorber B, Fraunberger B, Halboni P, Koebnick C, Gefeller O, Tilz C. Onset of action of levetiracetam: a RCT trial using therapeutic intensive seizure analysis (TISA). Epilepsia 47: 516–522, 2006 [DOI] [PubMed] [Google Scholar]
- Stevens CF, Williams JH. Discharge of the readily releasable pool with action potentials at hippocampal synapses. J Neurophysiol 98: 3221–3229, 2007 [DOI] [PMC free article] [PubMed] [Google Scholar]
- Wan Q, Zhou Z, Thakur P, Vila A, Sherry DM, Janz R, Heidelberger R. SV2 acts via presynaptic calcium to regulate neurotransmitter release. Neuron 66: 884–895, 2010 [DOI] [PMC free article] [PubMed] [Google Scholar]
- Yang XF, Rothman SM. Levetiracetam has a time- and stimulation-dependent effect on synaptic transmission. Seizure 18: 615–619, 2009 [DOI] [PubMed] [Google Scholar]
- Yang XF, Weisenfeld A, Rothman SM. Prolonged exposure to levetiracetam reveals a presynaptic effect on neurotransmission. Epilepsia 48: 1861–1869, 2007 [DOI] [PubMed] [Google Scholar]
- Yao J, Nowack A, Kensel-Hammes P, Gardner RG, Bajjalieh SM. Cotrafficking of SV2 and synaptotagmin at the synapse. J Neurosci 30: 5569–5578, 2010 [DOI] [PMC free article] [PubMed] [Google Scholar]
- Yeh FL, Dong M, Yao J, Tepp WH, Lin G, Johnson EA, Chapman ER. SV2 mediates entry of tetanus neurotoxin into central neurons. PLoS Pathog 6: 11, 2010 [DOI] [PMC free article] [PubMed] [Google Scholar]
- Zhang Q, Li Y, Tsien RW. The dynamic control of kiss-and-run and vesicular reuse probed with single nanoparticles. Science 323: 1448–1453, 2009 [DOI] [PMC free article] [PubMed] [Google Scholar]
- Zona C, Niespodziany I, Marchetti C, Klitgaard H, Bernardi G, Margineanu DG. Levetiracetam does not modulate neuronal voltage-gated Na+ and T-type Ca2+ currents. Seizure 10: 279–286, 2001 [DOI] [PubMed] [Google Scholar]


