

Abstract
Study Objectives:
The cyclic sequence of NREM and REM sleep, the so-called ultradian rhythm, is a highly characteristic feature of sleep. However, the mechanisms responsible for the ultradian REM sleep rhythm, particularly in humans, have not to date been fully elucidated. We hypothesize that a stage transition mechanism is involved in the determination of the ultradian REM sleep rhythm.
Participants:
Ten healthy young male volunteers (age: 22 ± 4 years, range 19–31 years) spent 3 nights in a sleep laboratory. The first was the adaptation night, and the second was the baseline night. On the third night, the subjects received risperidone (1 mg tablet), a central serotonergic and dopaminergic antagonist, 30 min before the polysomnography recording.
Measurements and Results:
We measured and investigated transition probabilities between waking, REM, and NREM sleep stages (N1, N2, and N3) within the REM-onset intervals, defined as the intervals between the onset of one REM period and the beginning of the next, altered by risperidone. We also calculated the transition intensity (i.e., instantaneous transition rate) and examined the temporal pattern of transitions within the altered REM-onset intervals. We found that when the REM-onset interval was prolonged by risperidone, the probability of transitions from N2 to N3 was significantly increased within the same prolonged interval, with a significant delay and/or recurrences of the peak intensity of transitions from N2 to N3.
Conclusions:
These results suggest that the mechanism governing NREM sleep stage transitions (from light to deep sleep) plays an important role in determining ultradian REM sleep rhythms.
Citation:
Kishi A; Yasuda H; Matsumoto T; Inami Y; Horiguchi J; Tamaki M; Struzik ZR; Yamamoto Y. NREM sleep stage transitions control ultradian REM sleep rhythm. SLEEP 2011;34(10):1423-1432.
Keywords: Ultradian rhythm; sleep stage dynamics; transition probability; serotonin, dopamine
INTRODUCTION
One of the critical moments in sleep research came in 1953 with the discovery of REM sleep.1 Since then sleep has been regarded as an active process rather than merely the cessation of activity. Sleep is, by nature, not a static but a dynamic phenomenon, resulting from complex interactions of the behavior of central neurons, mainly in the hypothalamus and brainstem.2–8 Above all, the cyclic sequence of NREM and REM sleep, or the so-called ultradian rhythm, is a highly characteristic feature of sleep.9 The ultradian REM sleep rhythm is probed through REM-onset intervals, defined as the intervals between the onset of one REM period and the beginning of the next.10
For many years, the well-known reciprocal interaction model by McCarley and Hobson5,6,11 has been used to describe ultradian periodicity, the approximately 90-min sleep cycle, indicating that NREM-REM cycles are controlled by both cholinergic and monoaminergic neuronal systems. In the original reciprocal interaction model, cholinergic neurons act as REM-on cells and send excitatory synapses to monoaminergic neurons (REM-off cells) and to the cholinergic neurons themselves, while monoaminergic neurons act as REM-off cells and send inhibitory synapses to cholinergic neurons and also to the monoaminergic neurons themselves. Although further modifications of the original reciprocal interaction model, e.g., the incorporation of self-inhibitory cholinergic autoreceptors and excitatory interactions between cholinergic and non-cholinergic REM-on neurons, have been proposed over the past 30 years with new findings of synaptic details of the model, none of these appear to have produced substantial changes in the basic framework of the original cholinergic–monoaminergic (REM-on–REM-off) reciprocal interaction.5,6,8 It is therefore straightforward to observe the shortening of REM-onset intervals by a cholinergic agonist and the prolongation by a cholinergic antagonist.12 However, according to various monoaminergic/cholinergic models,2 the monoaminergic antagonist should shorten REM-onset intervals, because decreased neurotransmission of monoaminergic neurons should result in the activation of cholinergic neurons via decreased inhibition of cholinergic neurons, while actual experimental observations in rats13 and humans14 show the opposite effect.
On the other hand, γ-aminobutyric acid (GABA)-ergic neuronal populations have also been shown to be involved in REM sleep regulation.15,16 A flip-flop switch model for REM sleep alternation has recently been proposed, in which the ultradian REM sleep alternation is controlled by mutually inhibitory interactions between GABA-ergic REM-on and REM-off neuronal populations.15 As this model assumes that the GABA-ergic REM-off neurons have excitatory inputs from monoaminergic REM-off neurons, it is also expected that the monoaminergic antagonist should shorten the REM-onset intervals. This is because decreased neurotransmission of monoaminergic neurons should lead to the decreased firing of GABA-ergic REM-off neurons, resulting in the disinhibition (i.e., activation) of GABA-ergic REM-on neurons. This is again inconsistent with actual experimental findings.13,14
Recently, analysis of behavioral state transitions, including sleep stage transitions, has been shown to be useful since it can shed light on new properties of sleep regulation.17,18 We have recently reported that risperidone, which is an atypical antipsychotic drug and is a very potent antagonist of central 5-hydroxytryptamine-2 (5-HT2) receptors and dopamine D2 receptors (and also has α1- and α2-adrenergic and histaminergic H1 blocking properties and little affinity for cholinergic receptors),19 alters dynamic sleep stage transitions from light (stage 2) to deep (stage 3) sleep.14 We have also reported that REM-onset intervals are prolonged when risperidone is administered.14 These findings suggest that sleep stage transitions from light to deep sleep may play a key role in the prolongation of the ultradian REM sleep rhythm. In this regard, prior models for ultradian REM sleep alternation have not taken into account such a key factor as transitions between light and deep sleep within NREM sleep, which is a characteristic feature of human sleep.
To date, data have not been presented to indicate a direct correspondence between sleep stage transitions and REM-onset intervals. Furthermore, there is as yet no explanation for the discrepancy between the experimental observations and the theoretical explanation derived from the model as to the effect of monoaminergic antagonists on ultradian REM sleep rhythm. Therefore, in the present study, we test our hypothesis that the mechanism governing NREM sleep stage transitions (from light to deep sleep) is involved in the determination of the ultradian REM sleep rhythm. Specifically, we investigate the stage transition probability and the temporal pattern of the underlying stage transition “intensity” within the REM-onset interval altered by risperidone.
METHODS
Subjects
Experimental group
The subjects in the experimental group were 10 healthy young male volunteers (age: 22 ± 4 years, range 19–31 years).14,20 None of the subjects had any history of sleep disorders or any other form of physical or psychiatric illness. The subjects had regular sleep-wake cycles, were not in the habit of taking a nap or consuming alcoholic beverages before sleep, and were drug-free non-smokers. After an explanation of the risks and benefits, all the subjects gave their informed written consent, before undergoing this study. The ethics committee of Shimane University School of Medicine approved this study.
The subjects were asked to arrive at the sleep laboratory at 21:00 and prepare for polysomnographic (PSG) recording. The subjects spent 3 nights in the laboratory. The first was the adaptation night and the second was the baseline night. On the third night the subjects received risperidone (1 mg tablet) 30 min before the PSG recording. The subjects went to bed and woke up at their usual time. Considering the individual variations of the circadian rhythm, we fixed neither retiring nor waking times uniformly.
We did not employ a counterbalanced study design for the following reasons: (1) Administering the drug first would be problematic because of possible lingering or rebound effects; (2) The long washout phase (e.g., a week) would completely alter the study design. In order to overcome the problem of the lack of a counterbalanced study, as the study design entailed a fixed sequence of events, we also studied a matched control group as follows.
Control group
The subjects in the control group were 7 healthy young male volunteers (age: 23 ± 1 years, range 21–25 years). None of the subjects had any history of sleep disorders or any other form of physical or psychiatric illness. The subjects had regular sleep-wake cycles, were not in the habit of taking a nap or consuming alcoholic beverages before sleep, and were drug-free nonsmokers. After an explanation of the risks and benefits, all the subjects gave their informed written consent, before undergoing this study. The ethics committee of Hiroshima University approved this study.
The subjects were asked to arrive at the laboratory 3 hours before their retiring time and prepare for the PSG recording. They spent 3 successive nights in the laboratory. No drugs were administered. Further information is available in the paper by Tamaki et al.21
Polysomnography
The subjects in the experimental group underwent nocturnal PSG by means of standard procedures that included recording a sleep electroencephalogram (EEG; C3/A2 and O1/A2), electrooculogram (EOG), submental electromyogram (EMG) and electrocardiogram (ECG). Sleep was scored every 20 sec, according to the standard criteria of Rechtschaffen and Kales (R&K).22 Sleep stages were scored by dividing a sleep recording into non-overlapping epochs of equal duration (20 sec), and a single stage was assigned to each epoch. Information about the PSG of the subjects in the control group is available in the paper by Tamaki et al.21
Data Analysis
In 2007, the American Academy of Sleep Medicine (AASM) modified the standard guidelines for sleep scoring by R&K22 and developed new guidelines (the AASM standard).23 As the data from these experiments had previously been scored according to R&K, in this study we combined stages 3 and 4 to approximate the new AASM standard. We have thus re-formulated our transition analysis within the framework of AASM (waking, REM sleep, and NREM sleep [N1, N2, and N3]) for this and prospective papers.
Behavioral state transition probabilities were calculated between Waking (W), REM sleep (R), N1, N2, and N3. Epochs of movement time were regarded as waking epochs in the analysis. The transition probabilities were calculated both by dividing the number of transitions between behavioral states by the total number of all transitions (the global transition probability: 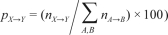 , and by dividing the number of transitions from a specific state to one of the other states by the total number of transitions from that specific state to another state (the normalized transition probability:
 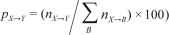 , where {A, B, X, Y} are derived from {W, R, N1, N2, and N3} and X→Y is the number of transitions from behavioral states X to Y (X ≠ Y) during the whole night’s sleep.18 Mean ± SD of the number of continuous runs of each behavioral state (i.e., periods of consecutive epochs of the same state bounded by one of the other states)24 analyzed per subject and night for the control group and for the experimental group are shown in Table 1 and Table 2, respectively. In Table 4 and Supplementary Tables S2–S5, the averages of the transition probabilities are shown, using the mean transition probability for the whole condition.
Table 1.
Mean ± SD of the number of continuous runs of each behavioral state analyzed per subject and night for the control group
| Stage | Second | Third | Paired t-test |
|---|---|---|---|
| Waking | 28.6 ± 11.4 | 30.7 ± 10.3 | n.s. |
| REM | 17.0 ± 3.8 | 19.6 ± 5.3 | n.s. |
| NREM | 35.6 ± 7.5 | 37.6 ± 12.6 | n.s. |
| N1 | 35.7 ± 6.7 | 42.3 ± 19.1 | n.s. |
| N2 | 77.4 ± 22.7 | 79.7 ± 30.2 | n.s. |
| N3 | 48.0 ± 20.4 | 47.7 ± 13.6 | n.s. |
Mean of the number of continuous runs of each behavioral state (i.e., periods of consecutive epochs of the same state bounded by one of the other states) did not differ significantly between the second night and the third night for all states.
Table 2.
Mean ± SD of the number of continuous runs of each behavioral state analyzed per subject and night for the experimental group
| Stage | Baseline | Risperidone | Paired t-test |
|---|---|---|---|
| Waking | 29.9 ± 9.9 | 22.7 ± 6.6 | n.s. |
| REM | 11.2 ± 5.6 | 7.3 ± 3.3 | n.s. |
| NREM | 27.0 ± 6.2 | 21.9 ± 6.4 | n.s. |
| N1 | 22.2 ± 11.3 | 16.5 ± 6.9 | n.s. |
| N2 | 62.4 ± 11.1 | 72.3 ± 36.4 | n.s. |
| N3 | 35.6 ± 10.2 | 52.7 ± 33.3 | n.s. |
Mean of the number of continuous runs of each behavioral state (i.e., periods of consecutive epochs of the same state bounded by one of the other states) did not differ significantly between the baseline night and the risperidone night for all states.
Table 4.
Normalized transition probabilities between five behavioral states within paired REM-onset intervals for the experimental group
| (%) | Baseline |
Risperidone |
||||||||
|---|---|---|---|---|---|---|---|---|---|---|
| W | N1 | N2 | N3 | R | W | N1 | N2 | N3 | R | |
| W | 33.3 | 54.2 | 0.0 | 12.5 | 48.8 | 40.2 | 0.0 | 11.0 | ||
| N1 | 15.7 | 78.4 | 0.0 | 5.9 | 26.0 | 60.3 | 0.0 | 13.7 | ||
| N2 | 32.2 | 16.4 | 42.5 | 8.9 | 19.8** | 14.5 | 61.4** | 4.3 | ||
| N3 | 3.2 | 0.0 | 96.8 | 0.0 | 2.4 | 0.0 | 97.6 | 0.0 | ||
| R | 60.0 | 12.0 | 28.0 | 0.0 | 67.9 | 10.7 | 21.4 | 0.0 | ||
Normalized transition probabilities between Waking (W), REM sleep (R), N1, N2, and N3 within paired REM-onset intervals for the baseline night and the risperidone night for the experimental group. The labels (W, N1, N2, N3, and R) in the rows denote the preceding states, and those in the columns denote the subsequent states of transitions.
P < 0.01 from the baseline night.
The intervals between the onset of one REM period and the beginning of the next (REM-onset intervals) were calculated according to criteria derived from Feinberg.10 In keeping with these criteria, a REM period was accepted as complete if it was ≥ 5 min in duration (except for the first REM period, which has no minimum length). REM periods of duration < 5 min were conjoined with the succeeding REM period. REM periods interrupted by NREM sleep ≤ 15 min were treated as single periods; if > 15 min of NREM sleep intervened, they were scored as 2 separate REM periods. For the treatment of the waking time, we subtracted the waking time when calculating the intervals, because a previous study has shown that the REM sleep cycle is sleep dependent.25 Distributions of REM-onset intervals were analyzed by pooling those of all of the individuals in each condition.
When analyzing the relationship between the REM-onset interval and the behavioral state transition probability, the sleep cycles of each subject were considered: we matched the REM-onset interval for the baseline night and that for the risperidone night by the same subject and the same sleep cycle (Figure 1). Among these matched pairs, pairs were extracted for the analysis of which the REM-onset intervals for the risperidone night were prolonged, in conformity with the overall result.14 When the number of REM-onset intervals was different between the baseline and the risperidone night for the same subject, REM-onset intervals which did not have matched pairs were not included in this analysis. Then, normalized transition probabilities within REM-onset intervals which belong to extracted matched pairs (paired REM-onset intervals) were calculated.
Figure 1.

An example of the pair matching of the REM-onset interval (ROI) for the baseline night (A) and that for the risperidone night (B). Each pair of REM-onset intervals was matched by the same subject and the same sleep cycle. Among these matched pairs, pairs of which the REM-onset intervals for the risperidone night were altered with the same tendency as the whole were extracted in order to analyze the relationship between the REM-onset interval and the sleep stage transition.
The temporal pattern of behavioral state transitions was analyzed by calculating the transition intensity which was obtained as follows: (1) Point processes were generated for each subject, set to 1 at each point where a transition occurred, and otherwise to 0 (Figure 2B); (2) These point processes were smoothened by taking a Hanning window-based weighted moving average for data from 10 min before to 10 min after the current window (i.e., with 20 min 20 sec window length; the epochs are 20 sec in duration); this instantaneous transition rate was defined as the transition intensity time series (Figure 2C). The positions of peaks of transition intensities within REM-onset intervals were calculated as the elapsed time between the onset of the REM-onset interval and the local maximum point of the transition intensity for the REM-onset interval belonging to the extracted matched pairs mentioned above. The number of peaks of transition intensities was calculated by counting the number of local maximum points of transition intensities within each paired REM-onset interval.
Figure 2.

An example of the hypnogram within one REM-onset interval (ROI) (A), the point process time series from N2 to N3 derived from panel A (B) and the transition intensity time series from N2 to N3 obtained from panel B (C). The REM-onset interval in panel A corresponds to the ROI-1 in Figure 1B. The point process in panel B consists of 0 and 1, set to 1 at each point where a transition from N2 to N3 occurred, and otherwise to 0. The transition intensity time series from N2 to N3 is calculated by smoothing the point process in panel B by taking a Hanning window-based weighted moving average for data from 10 min before to 10 min after the current window.
Statistical Analysis
Differences in transition probabilities between nights for each group were assessed using a paired t-test, which was performed on probabilities for each subject in a group of normalized transition probabilities. Differences in mean REM-onset intervals between nights for each group were assessed using a non-paired t-test, as the number of REM-onset intervals was different between nights for each group. Differences in cycle-based mean REM-onset intervals between nights for the experimental group were assessed using the Mann-Whitney U test. Differences in positions of peaks of transition intensities within paired REM-onset intervals between nights were assessed using Welch’s t-test. Differences in the number of peaks of transition intensities within paired REM-onset intervals between nights were assessed using a paired t-test. Statistical significance was accepted when P < 0.05.
RESULTS
Control Group
Traditional sleep variables
Traditional descriptive statistics of sleep parameters during the second night and the third night for the control group are shown in Supplementary Table S1. There were no significant differences in the traditional sleep variables between the second night and the third night.
Transition probabilities
Global and normalized transition probabilities between the 5 behavioral states (W, R, N1, N2, and N3) for the control group are shown in Table S2 and Table S3, respectively. The results are illustrated in the simplified diagram in Figure 3A. The global transition probabilities from N1 to REM were significantly different between the second night (3.6%) and the third night (3.9%). The mean normalized transition probabilities did not differ significantly between the second night and the third night.
Figure 3.

Transition probabilities between 5 behavioral states (Waking [W], REM sleep [R], N1, N2, and N3) for the control group (A) and for the experimental group (B). The thickness of the arrows represents the ratio of global transition probabilities for the second night (control group: A) and for the baseline night (experimental group: B). The black arrow indicates that the normalized transition probability is significantly greater for the risperidone night than for the baseline night (**P < 0.01). The gray arrows indicate that the normalized transition probability does not differ significantly between nights for each group.
REM-onset intervals
The mean REM-onset interval did not differ significantly between the second night (91.4 ± 14.7 min) and the third night (94.0 ± 21.0 min) (Figure 4A).
Figure 4.

Mean ± SD of the REM-onset interval for the second night (gray) and the third night (black) for the control group (A) and mean ± SD of the REM-onset interval for the baseline night (gray) and the risperidone night (black) for the experimental group (B). For the control group, there was no significant difference in the mean REM-onset intervals between the second night and the third night. For the experimental group, the mean REM-onset interval was significantly longer for the risperidone night than for the baseline night (**P < 0.01).
Experimental Group
Traditional sleep variables
Traditional descriptive statistics of sleep parameters during the baseline night and the risperidone night for the experimental group have been published elsewhere.20 Following risperidone administration, there was a significant increase in the percentage of stage 2 sleep to total sleep period (baseline; 58.5% ± 6.3%, risperidone; 65.3% ± 5.9%, P = 0.017), and a significant decrease in the percentage of REM sleep to total sleep period (baseline; 23.0% ± 2.3%, risperidone; 17.3% ± 5.0%, P = 0.037). There were no other significant changes in the sleep parameters.
Transition probabilities
Global and normalized transition probabilities between the 6 behavioral states (W, R, stages 1, 2, 3, and 4) for the experimental group have been published elsewhere.14 Global and normalized transition probabilities between the 5 behavioral states (W, R, N1, N2, and N3) within the framework of the AASM standard for the experimental group are shown in Supplementary Table S4 and Table S5, respectively. The results are illustrated in the simplified diagram in Figure 3B. In the global transition probabilities between waking, REM sleep, N1, N2, and N3, the transitions between N2 and N3 (N2 → N3 and N3 → N2) were significantly greater for the risperidone night (30.3% for N2 → N3 and 29.2% for N3 → N2) than for the baseline night (21.8% for N2 → N3 and 20.8% for N3 → N2), and the transitions from N1 to N2 (N1 → N2) were significantly greater for the baseline night (9.4%) than for the risperidone night (6.2%). In the normalized transition probabilities, the transitions from N2 to N3 (N2 → N3) were significantly greater for the risperidone night (72.3%) than for the baseline night (56.7%).
REM-onset intervals
The mean REM-onset interval was significantly longer for the risperidone night (128.0 ± 45.3 min) than for the baseline night (95.0 ± 27.7 min) (P < 0.01) (Figure 4B). When analyzing the difference of the cycle-based mean REM-onset intervals between nights, the mean first REM-onset interval was significantly longer for the risperidone night (142.9 ± 50.4 min) than for the baseline night (95.7 ± 27.5 min) (P < 0.05) (Table 3).
Table 3.
Mean ± SD of the cycle-based REM-onset interval for the experimental group
| Cycle | Baseline | Risperidone | Mann-Whitney U-test |
|---|---|---|---|
| First (min) | 95.7 ± 27.5 | 142.9 ± 50.4 | P < 0.05 |
| Second (min) | 103.3 ± 19.5 | 138.4 ± 48.8 | n.s.† |
| Third (min) | 97.5 ± 31.1 | 113.7 ± 13.0 | n.s. |
| Fourth (min) | 80.7 ± 12.9 | 79.4 ± 18.2 | n.s. |
Values of the REM-onset interval for each cycle for the baseline night and the risperidone night for the experimental group are presented as means ± SD.
P = 0.0576.
Transition probability within the altered REM-onset interval
Normalized transition probabilities between 5 behavioral states (W, R, N1, N2, and N3) within paired REM-onset intervals are shown in Table 4. When the REM-onset interval was prolonged by risperidone for the risperidone night compared to the corresponding interval for the baseline night matched by the same sleep cycle of the same subject, the normalized transition probability from N2 to N3 (N2 → N3) within matched intervals for the risperidone night was significantly greater than that for the baseline night (P < 0.01), and there was a significant decrease of the probability of transitions from N2 to W (N2 → W) for the risperidone night when compared to the baseline night (P < 0.01). No other pattern of transitions was significantly different between conditions.
Temporal pattern of transition intensities within the altered REM-onset interval
After verifying the relationship between the prolonged REM-onset interval and the increased probability of transitions from N2 to N3, we set out to examine the temporal pattern of transitions from N2 to N3 within prolonged REM-onset intervals. Intensities of the transitions from N2 to N3 within paired REM-onset intervals for the baseline night and for the risperidone night are shown in Figure 5A and B. Positions of peaks of transition intensities from N2 to N3 were significantly different in the baseline night and the risperidone night (P < 0.05); peaks of transition intensities from N2 to N3 for the risperidone night were significantly delayed when compared to the baseline night (61.0 ± 18.9 min for the baseline night and 87.8 ± 54.8 min for the risperidone night; values are presented as mean ± SD, Figure 5C). The number of peaks of transition intensities from N2 to N3 was significantly different in the baseline night and the risperidone night (P < 0.01); the number of peaks of transition intensities from N2 to N3 was significantly greater for the risperidone night (1.9 ± 1.4; mean ± SD) than for the baseline night (0.7 ± 0.6; mean ± SD) (Figure 5D).
Figure 5.

Intensities of transitions from N2 to N3 within paired REM-onset intervals for the baseline night (A) and the risperidone night (B), the mean position of peaks of transition intensities from N2 to N3 for the baseline night and the risperidone night (C), and the mean number of peaks of transition intensities from N2 to N3 for the baseline night and the risperidone night (D). The peak of the intensity of transition from N2 to N3 was significantly delayed for the risperidone night compared to the baseline night (*P < 0.05). The number of peaks of the intensity of transition from N2 to N3 was significantly increased for the risperidone night compared to the baseline night (**P < 0.01).
DISCUSSION
There is a consensus that sleep displays an approximately 90-min periodicity, the so-called ultradian rhythm, in which alternations of NREM sleep and REM sleep successively occur.9 Although such a conceptual periodicity of the sleep cycle is well recognized, actual hypnograms display rather complicated, apparently non-periodic sequences of transitions between behavioral states (Waking, REM, N1, N2, and N3). Recent studies have shown that these complicated transitions are not merely random. Rather, distributions of durations of each behavioral state exhibit stage-specific behavior,17,18 suggesting that episodes of each behavioral state of every duration are meaningful. Thus, detailed analyses of state transitions between one REM sleep stage and the subsequent REM stage may be important for elucidating the to date unexplained mechanism(s) responsible for the ultradian rhythm.26
Our present study is the first to demonstrate that the state transition mechanism may be involved in the determination of the ultradian REM sleep rhythm. In addition, we demonstrate that the temporal structures of sleep stage transitions may be influenced by specific neurotransmitters. Specifically, we have established that the antagonist of serotonin 5-HT2 receptors and dopamine D2 receptors increases dynamic transitions from light (N2) to deep (N3) sleep, together with the significant prolongation of REM-onset intervals, with the significant delay and/or recurrences of the intensity of transitions from light (N2) to deep (N3) sleep.
Observations of prolonged REM-onset intervals by a monoaminergic antagonist,13,14 together with suppressed REM sleep activity (e.g., increased REM latency and reduced REM sleep durations),27–29 however, are not fully compatible with the well-known reciprocal interaction model by McCarley and Hobson,5,6,11 because decreased neurotransmission of monoaminergic neurons should result in the activation of cholinergic REM-on neurons. The traditional reciprocal interaction model only assumes alternations of NREM sleep and REM sleep, failing to provide a clear explanation for the discrepancy between the theoretical and experimental findings on the effect of monoaminergic antagonists on REM-onset intervals. Importantly, this also holds true for the recently proposed GABA-ergic flip-flop switch model.15 In the present study, we have elucidated the contribution of the mechanisms regulating dynamic sleep stage transitions to the ultradian REM sleep rhythm. Specifically, the sleep stage transition from light (N2) to deep (N3) sleep, which should partially be driven by a serotonergic and dopaminergic antagonist, was related to the prolongation of the REM-onset interval. Because there is virtually no transition permitted directly from deep sleep stages (stages 3 or 4 in R&K) to the REM sleep stage in humans,14,18 the increased transition probability to slow wave sleep by risperidone should also contribute to the prolongation of REM-onset intervals, possibly together with the suppression of the transitions to REM sleep. This is complemented by a previous study showing that dopamine plays a key role in the genesis of REM sleep.30
We also reveal that the temporal pattern of transitions from light (N2) to deep (N3) sleep is significantly altered when REM-onset intervals are prolonged by monoaminergic antagonist. In the case of the normal REM-onset interval for the baseline night, the mean peak time of the intensity of the transitions from N2 to N3 was approximately 60 min from the start of the REM-onset interval, and the number of peaks of the intensity of the transitions from N2 to N3 was mostly only one or none. These observations are consistent with the traditional understanding of the apparent periodicity of the sleep cycle.9 Similarly, by using the notion of the transition intensity, a previous study has also shown that NREM to REM transitions display a 90-min periodicity.31 In the case of the prolonged REM-onset interval for the risperidone night, the mean peak time of the intensity of the transitions from N2 to N3 was significantly delayed, approximately 90 min from the beginning of the REM-onset interval, which should be the time to make the transition to REM. Further, the number of peaks of the intensity of the N2 to N3 transitions was significantly increased, indicating the recurrences of the wave of transitions toward deep sleep within one REM-onset interval.
These results suggest that the underlying mechanism partially altered by central serotonergic and dopaminergic antagonist, which generates the delayed and recurring intensity of the transitions from light (N2) to deep (N3) sleep, leads to the prolongation of REM-onset intervals. This could be interpreted as indicating that a “sub-ultradian” cycle of light (N2) to deep (N3) sleep within the ultradian REM sleep rhythm might influence the ultradian cycle itself, and supports our hypothesis that the stage transition mechanism plays an important role in the determination of the ultradian REM sleep rhythm.
The notion of a negative correlation between slow wave sleep duration and REM latency in the first sleep cycle has been widely documented. Åkerstedt et al. showed that REM latency was positively correlated with the amount of slow wave sleep in the first cycle, but negatively correlated with slow wave sleep latency.32 Bunnell et al. investigated the effect of daytime maximum exercise on nocturnal sleep and reported that subjects who exercised regularly displayed an increased duration of slow wave sleep, coupled with an increased REM latency. By contrast, subjects who took no regular exercise displayed a shortened REM latency and duration of slow wave sleep in the first sleep cycle.33 It has also been shown that patients with depression have a shortened REM latency and reduced slow wave sleep, possibly due to little slow wave sleep pressure.34 This is clearly related to the notion of a prolonged REM-onset interval with an increased propensity to enter slow wave sleep.
In this context, because many studies have also shown that selective 5-HT2 antagonists, ritanserin and ketanserin, enhance slow wave sleep duration,35–43 it may be argued that simply enhancing slow wave sleep duration via 5-HT2 blockade prolongs ultradian REM-onset intervals. However, our data have shown that, while the dual blockade of serotonin 5-HT2 and dopamine D2 receptors significantly increased N2 durations, it did not result in increased N3 duration,20 but instead in a significant increase in transitions between N2 and N3. This suggests a possible role of dopaminergic neurons, not slow wave sleep duration, in controlling such transitions within NREM sleep stages and allowing the prolongation of REM-onset intervals.
The general pattern of monoaminergic cell activities, such as those of serotonergic, histaminergic, and norepinephrinergic neurons, is the highest during waking, gradually decreases during NREM sleep, and reaches its nadir during REM sleep.7 This is consistent with our finding of increased transitions from light to deep sleep caused by monoaminergic antagonist, but further makes us expect an earlier appearance of REM sleep. The dopaminergic cell, however, increases terminal release in REM sleep, unlike other monoaminergic neurons, and is quiet during NREM sleep,44,–46 suggesting a particular role of dopaminergic neurons in prolonging ultradian REM sleep rhythm when they are blocked, as well as controlling within NREM sleep stage transitions. Although detailed mechanisms explaining the effect of monoaminergic antagonists on REM-onset intervals still remain unknown, it may in the future be possible to elucidate them by incorporating a mechanism governing NREM sleep stage transitions into the existing reciprocal interaction model.5,6,11
Due to the nature of antipsychotics, risperidone has anti-histaminergic and noradrenergic actions as well as its putatively therapeutic serotonergic and dopaminergic effects.19 The effects of histaminergic and noradrenergic blocking properties on sleep could be assumed to work in the same way as the serotonergic one, since histaminergic and noradrenergic cells are also monoaminergic REM-off neurons. Monoaminergic blocking properties of risperidone might potentially result in disinhibition of GABA-ergic neurons in the ventrolateral preoptic nucleus (VLPO), resulting in increased inhibition of cholinergic REM-on neurons. This kind of indirect effect of risperidone might partially contribute to the counterintuitive observation of reduced REM sleep duration for the risperidone night.20
As the study design entails a fixed sequence of events, there might be concerns about the habituation effect on the results. In this study, we prepared matched control data, in which the subjects spent 3 successive nights in the laboratory with no drugs being administered. There was no difference in the traditional sleep variables, normalized transition probabilities, or REM-onset intervals between the second night and the third night. As for global transition probabilities, the probability of transitions from N1 to REM sleep was significantly greater for the third night than for the second night, but the difference of the percentage itself was quite small (3.6% for the second night and 3.9% for the third night). These results indicate that the differences observed in the experimental group between nights are caused by the effect of risperidone. Moreover, the adopted method of pair matching in the analysis of the relationship between the REM-onset interval and the corresponding transition probability within the same interval, in which each pair is matched by the same subject and the same sleep cycle, helps to control the possible variability between subjects and also between sleep stages during the nights.
In conclusion, we demonstrate that sleep stage transitions may play an important role in the determination of the ultradian REM sleep rhythm. Dynamic transition analysis is thus shown to be a useful tool in revealing the neural basis of sleep regulation, and to provide novel insights into the unexplained mechanism(s) responsible for the ultradian rhythm.
DISCLOSURE STATEMENT
This was not an industry supported study. The authors have indicated no financial conflicts of interest.
ACKNOWLEDGMENTS
The authors thank Tadao Hori for his cooperation in this study. The authors are grateful to David M. Rapoport for his helpful comments on this paper. This study was partly supported by Grant-in-Aid for Scientific Research (no. 20300201) of the Ministry of Education, Culture, Sports, Science and Technology, Japan to Dr. Yamamoto and Grant-in-Aid for JSPS Fellows (no. 21-10303) to Dr. Kishi. Dr. Tamaki was supported by “Brain Machine Interface Development” carried out under the Strategic Research Program for Brain Sciences by the Ministry of Education, Culture, Sports, Science and Technology, Japan, and also supported by Grant-in-Aid for Research Activity Start-up (no. 22830136), from Japan Society for the Promotion of Science.
Table S1.
Descriptive statistics of traditional sleep variables for the control group
| Variable | Second | Third | Paired t-test |
|---|---|---|---|
| Time in bed (min) | 409.1 ± 93.3 | 431.3 ± 58.2 | n.s. |
| Total sleep time (min) | 391.7 ± 90.5 | 411.5 ± 58.9 | n.s. |
| Sleep efficiency (%) | 95.8 ± 2.0 | 95.4 ± 3.1 | n.s. |
| Waking after sleep onset (min) | 1.2 ± 1.5 | 2.7 ± 5.6 | n.s. |
| N1 (min) | 30.2 ± 7.4 | 34.1 ± 14.6 | n.s. |
| N2 (min) | 207.3 ± 56.8 | 225.4 ± 50.9 | n.s. |
| N3 (min) | 65.0 ± 14.0 | 52.2 ± 17.8 | n.s. |
| REM sleep (min) | 89.2 ± 40.1 | 99.8 ± 22.7 | n.s. |
| Sleep latency (min) | 5.5 ± 5.5 | 4.5 ± 3.6 | n.s. |
Values of traditional sleep variables for the second night and the third night for the control group are presented as means ± SD. There was no significant difference between the second night and the third night.
Table S2.
Global transition probabilities between five behavioral states for the control group
| (%) | Second |
Third |
||||||||
|---|---|---|---|---|---|---|---|---|---|---|
| W | N1 | N2 | N3 | R | W | N1 | N2 | N3 | R | |
| W | 8.4 | 3.8 | 0.1 | 1.9 | 9.2 | 2.8 | 0.1 | 2.2 | ||
| N1 | 1.7 | 11.9 | 0.0 | 3.6 | 2.7 | 12.5 | 0.0 | 3.9* | ||
| N2 | 7.2 | 4.6 | 23.0 | 2.5 | 5.8 | 6.1 | 21.5 | 2.7 | ||
| N3 | 2.1 | 0.1 | 20.9 | 0.1 | 1.9 | 0.0 | 19.7 | 0.0 | ||
| R | 3.4 | 4.1 | 0.7 | 0.0 | 4.0 | 3.8 | 1.0 | 0.0 | ||
Global transition probabilities between Waking (W), REM sleep (R), N1, N2, and N3 for the second night and the third night for the control group. The labels (W, N1, N2, N3, and R) in the rows denote the preceding states and those in the columns denote the subsequent states of transitions.
P < 0.05 from the baseline night.
Table S3.
Normalized transition probabilities between five behavioral states for the control group
| (%) | Second |
Third |
||||||||
|---|---|---|---|---|---|---|---|---|---|---|
| W | N1 | N2 | N3 | R | W | N1 | N2 | N3 | R | |
| W | 58.9 | 26.6 | 1.0 | 13.5 | 64.4 | 19.8 | 0.5 | 15.3 | ||
| N1 | 9.6 | 69.2 | 0.0 | 21.2 | 14.2 | 65.2 | 0.0 | 20.6 | ||
| N2 | 19.2 | 12.4 | 61.6 | 6.8 | 16.0 | 16.8 | 59.7 | 7.5 | ||
| N3 | 8.9 | 0.3 | 90.5 | 0.3 | 8.7 | 0.0 | 91.3 | 0.0 | ||
| R | 41.2 | 50.4 | 8.4 | 0.0 | 45.3 | 43.1 | 11.7 | 0.0 | ||
Normalized transition probabilities between Waking (W), REM sleep (R), N1, N2, and N3 for the second night and the third night for the control group. The labels (W, N1, N2, N3, and R) in the rows denote the preceding states and those in the columns denote the subsequent states of transitions.
Table S4.
Global transition probabilities between five behavioral states for the experimental group
| (%) | Baseline |
Risperidone |
||||||||
|---|---|---|---|---|---|---|---|---|---|---|
| W | N1 | N2 | N3 | R | W | N1 | N2 | N3 | R | |
| W | 7.6 | 7.3 | 0.1 | 4.1 | 5.6 | 5.8 | 0.2 | 2.1 | ||
| N1 | 3.3 | 9.4 | 0.1 | 0.9 | 2.3 | 6.2* | 0.0 | 1.0 | ||
| N2 | 9.5 | 5.2 | 21.8 | 1.9 | 6.9 | 3.5 | 30.3** | 1.2 | ||
| N3 | 1.0 | 0.1 | 20.8 | 0.0 | 1.3 | 0.1 | 29.2** | 0.0 | ||
| R | 5.2 | 0.7 | 0.9 | 0.0 | 3.2 | 0.3 | 0.7 | 0.0 | ||
Global transition probabilities between Waking (W), REM sleep (R), N1, N2, and N3 for the baseline night and the risperidone night for the experimental group. The labels (W, N1, N2, N3, and R) in the rows denote the preceding states, and those in the columns denote the subsequent states of transitions.
P < 0.01 and
P < 0.05 from the baseline night.
Table S5.
Normalized transition probabilities between five behavioral states for the experimental group
| (%) | Baseline |
Risperidone |
||||||||
|---|---|---|---|---|---|---|---|---|---|---|
| W | N1 | N2 | N3 | R | W | N1 | N2 | N3 | R | |
| W | 40.1 | 38.2 | 0.3 | 21.4 | 40.9 | 42.2 | 1.7 | 15.2 | ||
| N1 | 23.9 | 68.9 | 0.5 | 6.8 | 24.2 | 65.4 | 0.0 | 10.3 | ||
| N2 | 24.7 | 13.6 | 56.7 | 5.0 | 16.5 | 8.4 | 72.3** | 2.8 | ||
| N3 | 4.8 | 0.3 | 94.9 | 0.0 | 4.4 | 0.2 | 95.4 | 0.0 | ||
| R | 75.9 | 10.7 | 13.4 | 0.0 | 75.3 | 8.2 | 16.4 | 0.0 | ||
Normalized transition probabilities between Waking (W), REM sleep (R), N1, N2, and N3 for the baseline night and the risperidone night for the experimental group. The labels (W, N1, N2, N3, and R) in the rows denote the preceding states and those in the columns denote the subsequent states of transitions.
P < 0.01 from the baseline night.
REFERENCES
- 1.Aserinsky E, Kleitman N. Regularly occurring periods of eye motility, and concomitant phenomena, during sleep. Science. 1953;118:273–4. doi: 10.1126/science.118.3062.273. [DOI] [PubMed] [Google Scholar]
- 2.Hobson JA, Lydic R, Baghdoyan HA. Evolving concepts of sleep cycle generation: from brain centers to neuronal populations. Behav Brain Sci. 1986;9:371–448. [Google Scholar]
- 3.Jones BE. Paradoxical REM sleep promoting and permitting neuronal networks. Arch Ital Biol. 2004;142:379–96. [PubMed] [Google Scholar]
- 4.Luppi PH, Gervasoni D, Boissard R, et al. Brainstem structures responsible for paradoxical sleep onset and maintenance. Arch Ital Biol. 2004;142:397–411. [PubMed] [Google Scholar]
- 5.Pace-Schott EF, Hobson JA. Basic mechanisms of sleep: new evidence on the neuroanatomy and neuromodulation of the NREM-REM cycle. In: Kenneth LD, Dennis C, Joseph TC, Charles N, editors. Neuropsychopharmacology: the fifth generation of progress. 5th ed. Philadelphia, PA: Lippincott Williams – Wilkins; 2002. pp. 1859–77. [Google Scholar]
- 6.Pace-Schott EF, Hobson JA. The neurobiology of sleep: genetics, cellular physiology and subcortical networks. Nat Rev Neurosci. 2002;3:591–605. doi: 10.1038/nrn895. [DOI] [PubMed] [Google Scholar]
- 7.Saper CB, Chou TC, Scammell TE. The sleep switch: hypothalamic control of sleep and wakefulness. Trends Neurosci. 2001;24:726–31. doi: 10.1016/s0166-2236(00)02002-6. [DOI] [PubMed] [Google Scholar]
- 8.Hobson JA, Pace-Schott EF, Stickgold R. Dreaming and the brain: toward a cognitive neuroscience of conscious states. Behav Brain Sci. 2000;23:793–842. doi: 10.1017/s0140525x00003976. discussion 904-1121. [DOI] [PubMed] [Google Scholar]
- 9.Carskadon MA, Dement WC. Normal human sleep overview. In: Kryger MH, Roth T, Dement WC, editors. Principles and practice of sleep medicine. 4th ed. Philadelphia, PA: Elsevier Saunders; 2005. pp. 13–23. [Google Scholar]
- 10.Feinberg I. Changes in sleep cycle patterns with age. J Psychiatr Res. 1974;10:283–306. doi: 10.1016/0022-3956(74)90011-9. [DOI] [PubMed] [Google Scholar]
- 11.McCarley RW, Hobson JA. Neuronal excitability modulation over the sleep cycle: a structural and mathematical model. Science. 1975;189:58–60. doi: 10.1126/science.1135627. [DOI] [PubMed] [Google Scholar]
- 12.Sitaram N, Moore AM, Gillin JC. Experimental acceleration and slowing of REM sleep ultradian rhythm by cholinergic agonist and antagonist. Nature. 1978;274:490–2. doi: 10.1038/274490a0. [DOI] [PubMed] [Google Scholar]
- 13.Benington JH, Heller HC. Monoaminergic and cholinergic modulation of REM-sleep timing in rats. Brain Res. 1995;681:141–6. doi: 10.1016/0006-8993(95)00305-a. [DOI] [PubMed] [Google Scholar]
- 14.Kishi A, Yasuda H, Matsumoto T, et al. Sleep stage transitions in healthy humans altered by central monoaminergic antagonist. Methods Inf Med. 2010;49:458–61. doi: 10.3414/ME09-02-0032. [DOI] [PubMed] [Google Scholar]
- 15.Lu J, Sherman D, Devor M, Saper CB. A putative flip-flop switch for control of REM sleep. Nature. 2006;441:589–94. doi: 10.1038/nature04767. [DOI] [PubMed] [Google Scholar]
- 16.Fort P, Bassetti CL, Luppi PH. Alternating vigilance states: new insights regarding neuronal networks and mechanisms. Eur J Neurosci. 2009;29:1741–53. doi: 10.1111/j.1460-9568.2009.06722.x. [DOI] [PubMed] [Google Scholar]
- 17.Comte JC, Ravassard P, Salin PA. Sleep dynamics: a self-organized critical system. Phys Rev E. 2006;73:056127. doi: 10.1103/PhysRevE.73.056127. [DOI] [PubMed] [Google Scholar]
- 18.Kishi A, Struzik ZR, Natelson BH, Togo F, Yamamoto Y. Dynamics of sleep stage transitions in healthy humans and patients with chronic fatigue syndrome. Am J Physiol Regul Integr Comp Physiol. 2008;294:1980–7. doi: 10.1152/ajpregu.00925.2007. [DOI] [PMC free article] [PubMed] [Google Scholar]
- 19.Janssen PAJ, Niemegeers CJE, Awouters F, Schellekens KHL, Megens AAHP, Meert TF. Pharmacology of risperidone (R 64 766), a new antipsychotic with serotonin-S2 and dopamine-D2 antagonistic properties. J Pharmacol Exp Ther. 1988;244:685–93. [PubMed] [Google Scholar]
- 20.Matsumoto M, Mizuno S, Tsukada J, Inami Y, Horiguchi J. Effect of risperidone on polysomnography in healthy subjects. Sleep Biol Rhythms. 2007;5:146–8. [Google Scholar]
- 21.Tamaki M, Nittono H, Hayashi M, Hori T. Examination of the first-night effect during the sleep-onset period. Sleep. 2005;28:195–202. doi: 10.1093/sleep/28.2.195. [DOI] [PubMed] [Google Scholar]
- 22.Rechtschaffen A, Kales A. A manual of standardized terminology, techniques and scoring system for sleep states of human subjects. Washington, DC: US Government Printing Office; 1968. [Google Scholar]
- 23.Iber C, Ancoli-Israel S, Chesson A, Quan SF. 1st ed. Westchester, IL: American Academy of Sleep Medicine; 2007. The AASM manual for the scoring of sleep and associated events: rules, terminology, and technical specifications. [Google Scholar]
- 24.Norman RG, Scott MA, Ayappa I, Walsleben JA, Rapoport DM. Sleep continuity measured by survival curve analysis. Sleep. 2006;29:1625–31. doi: 10.1093/sleep/29.12.1625. [DOI] [PubMed] [Google Scholar]
- 25.Moses J, Lubin A, Johnson LC, Naitoh P. Rapid eye movement cycle is a sleep-dependent rhythm. Nature. 1977;265:360–1. doi: 10.1038/265360a0. [DOI] [PubMed] [Google Scholar]
- 26.Phillips AJK, Robinson PA. A quantitative model of sleep-wake dynamics based on the physiology of the brainstem ascending arousal system. J Biol Rhythms. 2007;22:167–79. doi: 10.1177/0748730406297512. [DOI] [PubMed] [Google Scholar]
- 27.Giménes S, Clos S, Romero S, Grasa E, Morte A, Barbanoj MJ. Effects of olanzapine, risperidone and haloperidol on sleep after single oral morning dose in healthy volunteers. Psychopharmacology. 2007;190:507–16. doi: 10.1007/s00213-006-0633-7. [DOI] [PubMed] [Google Scholar]
- 28.Sharpley AL, Bhagwagar Z, Hafizi S, Whale WR, Gijsman HJ, Cowen PJ. Risperidone augmentation decreases rapid eye movement sleep and decreases wake in treatment-resistant depressed patients. J Clin Psychiatry. 2003;64:192–6. doi: 10.4088/jcp.v64n0212. [DOI] [PubMed] [Google Scholar]
- 29.Yamashita H, Morinobu S, Yamawaki S, Horiguchi J, Nagao M. Effect of risperidone on sleep in schizophrenia: a comparison with haloperidol. Psychiat Res. 2002;109:137–42. doi: 10.1016/s0165-1781(02)00009-4. [DOI] [PubMed] [Google Scholar]
- 30.Dzirasa K, Ribeiro S, Costa R, et al. Dopaminergic control of sleep-wake states. J Neurosci. 2006;26:10577–89. doi: 10.1523/JNEUROSCI.1767-06.2006. [DOI] [PMC free article] [PubMed] [Google Scholar]
- 31.Yassouridis A, Steiger A, Klinger A, Fahrmeir L. Modelling and exploring human sleep with event history analysis. J Sleep Res. 1999;8:25–36. doi: 10.1046/j.1365-2869.1999.00133.x. [DOI] [PubMed] [Google Scholar]
- 32.Åkerstedt T, Hume K, Minors D, Waterhouse J. Experimental separation of time of day and homeostatic influences on sleep. Am J Physiol Regul Integr Comp Physiol. 1998;274:1162–8. doi: 10.1152/ajpregu.1998.274.4.R1162. [DOI] [PubMed] [Google Scholar]
- 33.Bunnell DE, Bevier WC, Horvath SM. Nocturnal sleep, cardiovascular function, and adrenal activity following maximum-capacity exercise. Electroencephalogr Clin Neurophysiol. 1983;56:186–9. doi: 10.1016/0013-4694(83)90072-x. [DOI] [PubMed] [Google Scholar]
- 34.Benca RM, Obermeyer WH, Thisted RA, Gillin JC. Sleep and psychiatric disorders. A meta-analysis. Arch Gen Psychiatry. 1992;49:651–68. doi: 10.1001/archpsyc.1992.01820080059010. [DOI] [PubMed] [Google Scholar]
- 35.Landolt HP, Meier V, Burgess HJ, et al. Serotonin-2 receptors and human sleep: effect of a selective antagonist on EEG power spectra. Neuropsychopharmacology. 1999;21:455–66. doi: 10.1016/S0893-133X(99)00052-4. [DOI] [PubMed] [Google Scholar]
- 36.Sharpley AL, Solomon RA, Fernando AI, da Roza Davis JM, Cowen PJ. Dose-related effects of selective 5-HT2 receptor antagonists on slow wave sleep in humans. Psychopharmacology. 1990;101:568–9. doi: 10.1007/BF02244239. [DOI] [PubMed] [Google Scholar]
- 37.Sharpley AL, Elliott JM, Attenburrow MJ, Cowen PJ. Slow wave sleep in humans: role of 5-HT2A and 5-HT2C receptors. Neuropharmacology. 1994;33:467–71. doi: 10.1016/0028-3908(94)90077-9. [DOI] [PubMed] [Google Scholar]
- 38.Idzikowski C, Mills FJ, Glennard R. 5-Hydroxytryptamine-2 antagonist increases human slow wave sleep. Brain Res. 1986;378:164–8. doi: 10.1016/0006-8993(86)90299-4. [DOI] [PubMed] [Google Scholar]
- 39.Idzikowski C, Mills FJ, James RJ. A dose-response study examining the effects of ritanserin on human slow wave sleep. Br J Clin Pharmacol. 1991;31:193–6. doi: 10.1111/j.1365-2125.1991.tb05514.x. [DOI] [PMC free article] [PubMed] [Google Scholar]
- 40.Mayer G. Ritanserin improves sleep quality in narcolepsy. Pharmacopsychiatry. 2003;36:150–5. doi: 10.1055/s-2003-41200. [DOI] [PubMed] [Google Scholar]
- 41.Monti JM. Disturbances of sleep and wakefulness associated with the use of antihypertensive agents. Life Sci. 1987;41:1979–88. doi: 10.1016/0024-3205(87)90471-1. [DOI] [PubMed] [Google Scholar]
- 42.van Laar M, Volkerts E, Verbaten M. Subchronic effects of the GABA-agonist lorazepam and the 5-HT2A/2C antagonist ritanserin on driving performance, slow wave sleep and daytime sleepiness in healthy volunteers. Psychopharmacology. 2001;154:189–97. doi: 10.1007/s002130000633. [DOI] [PubMed] [Google Scholar]
- 43.Adam K, Oswald I. Effects of repeated ritanserin on middle-aged poor sleepers. Psychopharmacology. 1989;99:219–21. doi: 10.1007/BF00442811. [DOI] [PubMed] [Google Scholar]
- 44.Maloney KJ, Mainville L, Jones BE. c-Fos expression in dopaminergic and GABAergic neurons of the ventral mesencephalic tegmentum after paradoxical sleep deprivation and recovery. Eur J Neurosci. 2002;15:774–8. doi: 10.1046/j.1460-9568.2002.01907.x. [DOI] [PubMed] [Google Scholar]
- 45.Léna I, Parrot S, Deschaux O, et al. Variations in extracellular levels of dopamine, noradrenaline, glutamate, and aspartate across the sleep-wake cycle in the medial prefrontal cortex and nucleus accumbens of freely moving rats. J Neurosci Res. 2005;81:891–9. doi: 10.1002/jnr.20602. [DOI] [PubMed] [Google Scholar]
- 46.Dahan L, Astier B, Vautrelle N, Urbain N, Kocsis B, Chouvet G. Prominent burst firing of dopaminergic neurons in the ventral tegmental area during paradoxical sleep. Neuropsychopharmacology. 2007;32:1232–41. doi: 10.1038/sj.npp.1301251. [DOI] [PubMed] [Google Scholar]
Associated Data
This section collects any data citations, data availability statements, or supplementary materials included in this article.
Supplementary Materials
Table S1.
Descriptive statistics of traditional sleep variables for the control group
| Variable | Second | Third | Paired t-test |
|---|---|---|---|
| Time in bed (min) | 409.1 ± 93.3 | 431.3 ± 58.2 | n.s. |
| Total sleep time (min) | 391.7 ± 90.5 | 411.5 ± 58.9 | n.s. |
| Sleep efficiency (%) | 95.8 ± 2.0 | 95.4 ± 3.1 | n.s. |
| Waking after sleep onset (min) | 1.2 ± 1.5 | 2.7 ± 5.6 | n.s. |
| N1 (min) | 30.2 ± 7.4 | 34.1 ± 14.6 | n.s. |
| N2 (min) | 207.3 ± 56.8 | 225.4 ± 50.9 | n.s. |
| N3 (min) | 65.0 ± 14.0 | 52.2 ± 17.8 | n.s. |
| REM sleep (min) | 89.2 ± 40.1 | 99.8 ± 22.7 | n.s. |
| Sleep latency (min) | 5.5 ± 5.5 | 4.5 ± 3.6 | n.s. |
Values of traditional sleep variables for the second night and the third night for the control group are presented as means ± SD. There was no significant difference between the second night and the third night.
Table S2.
Global transition probabilities between five behavioral states for the control group
| (%) | Second |
Third |
||||||||
|---|---|---|---|---|---|---|---|---|---|---|
| W | N1 | N2 | N3 | R | W | N1 | N2 | N3 | R | |
| W | 8.4 | 3.8 | 0.1 | 1.9 | 9.2 | 2.8 | 0.1 | 2.2 | ||
| N1 | 1.7 | 11.9 | 0.0 | 3.6 | 2.7 | 12.5 | 0.0 | 3.9* | ||
| N2 | 7.2 | 4.6 | 23.0 | 2.5 | 5.8 | 6.1 | 21.5 | 2.7 | ||
| N3 | 2.1 | 0.1 | 20.9 | 0.1 | 1.9 | 0.0 | 19.7 | 0.0 | ||
| R | 3.4 | 4.1 | 0.7 | 0.0 | 4.0 | 3.8 | 1.0 | 0.0 | ||
Global transition probabilities between Waking (W), REM sleep (R), N1, N2, and N3 for the second night and the third night for the control group. The labels (W, N1, N2, N3, and R) in the rows denote the preceding states and those in the columns denote the subsequent states of transitions.
P < 0.05 from the baseline night.
Table S3.
Normalized transition probabilities between five behavioral states for the control group
| (%) | Second |
Third |
||||||||
|---|---|---|---|---|---|---|---|---|---|---|
| W | N1 | N2 | N3 | R | W | N1 | N2 | N3 | R | |
| W | 58.9 | 26.6 | 1.0 | 13.5 | 64.4 | 19.8 | 0.5 | 15.3 | ||
| N1 | 9.6 | 69.2 | 0.0 | 21.2 | 14.2 | 65.2 | 0.0 | 20.6 | ||
| N2 | 19.2 | 12.4 | 61.6 | 6.8 | 16.0 | 16.8 | 59.7 | 7.5 | ||
| N3 | 8.9 | 0.3 | 90.5 | 0.3 | 8.7 | 0.0 | 91.3 | 0.0 | ||
| R | 41.2 | 50.4 | 8.4 | 0.0 | 45.3 | 43.1 | 11.7 | 0.0 | ||
Normalized transition probabilities between Waking (W), REM sleep (R), N1, N2, and N3 for the second night and the third night for the control group. The labels (W, N1, N2, N3, and R) in the rows denote the preceding states and those in the columns denote the subsequent states of transitions.
Table S4.
Global transition probabilities between five behavioral states for the experimental group
| (%) | Baseline |
Risperidone |
||||||||
|---|---|---|---|---|---|---|---|---|---|---|
| W | N1 | N2 | N3 | R | W | N1 | N2 | N3 | R | |
| W | 7.6 | 7.3 | 0.1 | 4.1 | 5.6 | 5.8 | 0.2 | 2.1 | ||
| N1 | 3.3 | 9.4 | 0.1 | 0.9 | 2.3 | 6.2* | 0.0 | 1.0 | ||
| N2 | 9.5 | 5.2 | 21.8 | 1.9 | 6.9 | 3.5 | 30.3** | 1.2 | ||
| N3 | 1.0 | 0.1 | 20.8 | 0.0 | 1.3 | 0.1 | 29.2** | 0.0 | ||
| R | 5.2 | 0.7 | 0.9 | 0.0 | 3.2 | 0.3 | 0.7 | 0.0 | ||
Global transition probabilities between Waking (W), REM sleep (R), N1, N2, and N3 for the baseline night and the risperidone night for the experimental group. The labels (W, N1, N2, N3, and R) in the rows denote the preceding states, and those in the columns denote the subsequent states of transitions.
P < 0.01 and
P < 0.05 from the baseline night.
Table S5.
Normalized transition probabilities between five behavioral states for the experimental group
| (%) | Baseline |
Risperidone |
||||||||
|---|---|---|---|---|---|---|---|---|---|---|
| W | N1 | N2 | N3 | R | W | N1 | N2 | N3 | R | |
| W | 40.1 | 38.2 | 0.3 | 21.4 | 40.9 | 42.2 | 1.7 | 15.2 | ||
| N1 | 23.9 | 68.9 | 0.5 | 6.8 | 24.2 | 65.4 | 0.0 | 10.3 | ||
| N2 | 24.7 | 13.6 | 56.7 | 5.0 | 16.5 | 8.4 | 72.3** | 2.8 | ||
| N3 | 4.8 | 0.3 | 94.9 | 0.0 | 4.4 | 0.2 | 95.4 | 0.0 | ||
| R | 75.9 | 10.7 | 13.4 | 0.0 | 75.3 | 8.2 | 16.4 | 0.0 | ||
Normalized transition probabilities between Waking (W), REM sleep (R), N1, N2, and N3 for the baseline night and the risperidone night for the experimental group. The labels (W, N1, N2, N3, and R) in the rows denote the preceding states and those in the columns denote the subsequent states of transitions.
P < 0.01 from the baseline night.