

Abstract
A clot's function is to achieve hemostasis by resisting fluid flow. Permeability is the measurement of a clot's hemostatic potential. It is sensitive to a wide range of biochemical parameters and pathologies. In this work, we consider the hydrodynamic phenomenon that reduces the mobility of fluid near the fiber surfaces. This no-slip boundary condition both defines the gel's permeability and suppresses nanoparticle diffusion in gel interstices. Here we report that, unlike previous work where steric effects also hindered diffusion, our system—nanoparticles in fibrin gel—was subject exclusively to hydrodynamic diffusion suppression. This result enabled an automated, high-throughput permeability assay that used small clot volumes. Permeability was derived from nanoparticle diffusion using the effective medium theory, and showed one-to-one correlation with measured permeability. This technique measured permeability without quantifying gel structure, and may therefore prove useful for characterizing similar materials (e.g., extracellular matrix) where structure is uncontrolled during polymerization and difficult to measure subsequently. We also report that PEGylation reduced, but did not eliminate, the population of immobile particles. We studied the forces required to pull stuck PEG particles free to confirm that the attachment is a result of neither covalent nor strong electrostatic binding, and discuss the relevance of this force scale to particle transport through physiological clots.
Introduction
Measurements of blood clotting function inform treatment throughout medicine. Clotting diagnostics are vital both because hemostasis is essential to health, and because pathological clotting, whether hypoactive (as in hemophilia) or hyperactive (as in cardiovascular disease), is a leading cause of morbidity and mortality worldwide. A clot's function is to resist fluid flow, so a vital measurement of clot quality is a permeability assay (1), which is sensitive to a wide range of biochemical parameters (2–7) and pathologies, including diabetes (8), hemophilia (9), myocardial infarction (heart attack) (10), in-stent-thrombosis (11), idiopathic venous thromboembolism (12), and ischemic stroke (13,14). Yet despite the wealth of targeted research studies that demonstrate permeability's relevance, the measurement has not gained substantial clinical adoption because it is time- and labor-intensive. In this study we demonstrate that nanoparticle diffusion can serve as a permeability assay that is automated, multiwell-compatible, and scales to microliter-sized clot volumes.
Permeability is a measurement of fluid flow through a bulk material. Miniaturizing the assay leads to a gel physics question: what microscopic properties or phenomena are tied to bulk fluid flow through a gel? A natural place to look is the gel's structure. Indeed, there is validated theory for fibrous gels that predicts permeability, captured by the Darcy constant κ, from the fiber diameter df and the volume fraction ϕ (15). However, precise measurement of clot structure presents challenges. Clot turbidity can provide insight into fiber diameter (16), but cannot measure volume fraction. Extracting clot structure from microscopy techniques remains an area of active research (17,18).
In fact, gel permeability is less a property of gel structure than it is a fluid's interaction with gel structure. The fluid flowing through the gel is subject to a no-slip boundary condition that reduces the fluid flow near the fiber surfaces. To measure this hydrodynamic phenomenon at the microscale, we developed a variation on the techniques of microrheology, in which the Brownian motion of small particles is used to calculate the bulk storage and loss moduli of the surrounding material (19–22). Here, we use the effective medium theory (23) to relate nanoparticle diffusion to permeability. Prior work has been unable to apply the effective medium theory without the addition of a term that depends on gel structure (df and ϕ) (24). We explain the time- and length-scales over which the effective medium theory can be applied without correction.
This study, like that of Valentine et al. (25), used commercially available carboxylate-modified polystyrene nanoparticles that we surface-functionalized with 2 kDa polyethylene glycol (PEG). PEG surface chemistry dramatically reduced—but surprisingly, does not eliminate—the sticking of particles to the gel. We therefore examined the forces required to pull ostensibly stuck PEG particles free from fibrin.
Diffusion suppression theory
In considering diffusion of chemically inert spheres in fibrin, we assume the gel to be a fluid-flooded scaffold of rigid rods. The degree of fiber motion depends on the spacing between fiber junctions and the fiber persistence length. Junction density varies with clotting conditions; reports of fiber persistence length have varied by orders of magnitude depending on the length-scales probed (26–28). In any case, fiber motion is small relative to the interfiber spacing.
Sub-mesh-size particles diffusing within this type of structure are subject to two physical phenomena that hinder particle motion. The first is hydrodynamic diffusion suppression, the result of an increased friction coefficient on the particle due to no-slip boundary conditions at the fiber surfaces. The second is steric diffusion suppression, the result of the particle's physical exclusion from the space that the fibers occupy. The effects are separable (29),
| (1) |
where D0 is the diffusion coefficient (30) in buffer and Deff is the in-gel diffusion coefficient. F captures the hydrodynamic interaction and S(df, ϕ), the steric; both F and S range from 0–1.
We hypothesize that the steric interaction occurs only if the particle diffuses for enough time (and therefore across enough distance) that the particle encounters many fibers (Fig. 1). Over short timescales there is no steric interaction (S(df,ϕ) → 1), and diffusion is suppressed by hydrodynamic effects alone (Deff/D0 → F). Hydrodynamic interactions are created by the same boundary conditions that determine gel permeability, so that diffusion and permeability may be related through the effective medium theory (23),
| (2) |
where d is the particle diameter and κ is the Darcy constant or hydraulic conductivity. Originally proposed in 1989 (23), this theory was tested (24) and shown to inadequately describe diffusion suppression without the addition of the steric term S. The steric term was required because particles diffused across distances of 20 μm in agarose gels with pores ∼10 nm—a pairing of length-scales that ensured particle collisions with the gel matrix. However, with a sufficiently large fiber-to-fiber spacing or a sufficiently short distance traveled, diffusion with no steric interactions should be observable. Fibrin fiber spacings range from ∼0.1–10 μm (31), and can therefore accommodate larger particles. Larger nanoparticles move slower and are easier to image, so they can be tracked with less sensitive and higher-bandwidth technology. In this sense, fibrin is especially convenient as a system to study hydrodynamic diffusion suppression.
Figure 1.
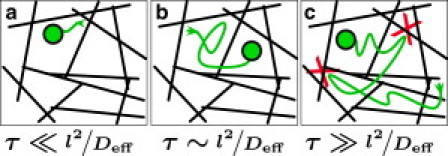
Phenomena that suppress diffusion depend on the timescale of particle motion, τ, and the spacing of the fibers, l. (a) A particle diffusing over very short timescales samples the fluid locally: the closer the particle is to the fiber surfaces, the more diffusion is suppressed, so Deff becomes a function of the particle's position in space. (b) Over slightly longer timescales, the particle samples locations both near and far from the fibers so that on average the fluid is effectively a uniform medium of lower viscosity. This is the assumption of the effective medium theory used in this work. (c) If the particle diffuses for long enough, it will begin colliding with the fibers (marked by X). These events are steric interactions, and must be accounted for as in Eq. 1.
Materials and Methods
Proteins and reagents
Diamine polyethylene glycol (PEG) of molecular mass 2000 Da was purchased from RAPP Polymere (Tübingen, Germany), 1-ethyl-3-(3-dimethylaminopropyl)carbodiimide and hydrochloride from Invitrogen (Carlsbad, CA), glycine (98%) from Acros Organics (Morris Plains, NJ), and 2-(n-morpholino)ethanesulfonic acid from Sigma-Aldrich (St. Louis, MO). HEPES buffered saline (HBS) was prepared with n-(2-hydroxyethyl) piperazine-n′-2-ethanesulfonic acid (Fisher Scientific, Fair Lawn, NJ). Dulbecco's phosphate-buffered saline 1× was purchased from GIBCO (Grand Island, NY). Plasminogen-depleted human fibrinogen and human α-thrombin were purchased from Enzyme Research Laboratories (South Bend, IN) and aliquots were stored at –80°C.
Alexa Fluor-488-labeled fibrinogen
Alexa Fluor 488-labeled fibrinogen from Invitrogen was prepared according to the product manual except the starting protein concentration was 4 mg/mL. Labeling yielded 8 mol of dye per mole of protein. Aliquots stored at –80°C were thawed only once before use.
Nanoparticle and fibrin clot preparation
Clots were formed at the concentrations indicated by mixing equal volumes of thrombin and fibrinogen solution in a plasma-cleaned 96-well plate, then incubated for 2.5 h at room temperature. Fluorescent fibrin gels were prepared by adding 4% by weight Alexa Fluor 488-labeled fibrinogen. Di-amine PEG was attached to carboxylate-modified fluorescent microspheres (Invitrogen), then surface modification and size was confirmed by Zeta-sizer (Malvern Instruments, Malvern, UK), as in existing protocols (32). (No significant changes in particle size or aggregation were detected after PEGylation.) Particles were added to the thrombin solution during preparation at a concentration to yield 20–25 beads per field of view (number density 108 cm–3). During the same preparation, the reagents were used to form clots in plastic tubing. After clot formation, tubes were cut to a fixed length using a razor blade. The tubing was sufficiently rigid that no deformation was observed, and the clot did not apparently stick to the side of the razor after cutting. HBS was perfused by gravity feed (total volume 0.1–1 mL) and flow rate was measured using graduated markings and a stopwatch. We calculated permeability by the Darcy equation, , where is the flow rate, ΔP is the pressure gradient across the clot, η is the HBS viscosity, and A is the tube's cross section, and L is its length.
Turbidity
Clotting time was determined by loading a microplate of similarly prepared clots into a SpectraMax Plus 384 (Molecular Devices, Sunnyvale, CA) spectrophotometer. The incubation time for these experiments was taken to be longer than the longest clotting time of all the clot types.
Laser-scanning confocal microscopy
Clots were imaged with an LSM 5 Pascal laser-scanning confocal microscope with an Axiovert 200 M stand, a 63×/1.4 NA oil immersion Plan Apochromatic lens, and LSM 5 software (Carl Zeiss, Oberkochen, Germany). An argon ion laser at 20% power at 488 nm was used for excitation and a green band-pass filter of 505–530 nm was used for emission. The pinhole diameter was 1 airy unit, the zoom factor was 1, and the resolution was 1024 × 1024 pixels for 8-bit images. Optical resolution was 0.14 μm in the x-y plane and 0.5 μm in the z axis. Stacks of 10.09 μm were captured at a height of 50 μm in each clot using the optimal interval for Nyquist sampling at 0.32 μm to obtain 33 optical slices. Images area was 145 μm × 145 μm.
High-throughput data acquisition and analysis
Clots were formed in 96-well optical-bottom microplates and placed on a custom-built, inverted wide-field epifluorescence microscope with a 40×/0.65 NA air objective (UKA Optics, Oyster Bay, NY), an automated X-Y stage (Ludl Electronics Products, Hawthorne, NY), a Flea2 camera (Point Gray Research, Richmond, British Columbia, Canada), and custom-controlled software. Videos of particle diffusion were recorded at 20 frames/s for 12 s at 13 different locations in each well. Particle tracking was performed automatically using custom-designed CISMM Video SpotTracker v5.29 (http://www.cismm.org/downloads/). Particle trajectories were filtered to eliminate tracks that lasted <2 s.
A programmatic analysis pipeline was developed using the MATLAB programming environment (The MathWorks, Natick, MA). In homogenous but viscoelastic materials, particle diffusion is suppressed on certain timescales such that
| (3) |
where 0 < α < 1 (33). The power-law α may not be constant over all timescales. However, for any range of τ over which α = 1, the motion is classic diffusion, such that (in two dimensions)
| (4) |
where 〈r2〉 is the time-averaged squared displacement over a given lag time τ, and D is the diffusion coefficient. For particle tracks in which 0.8 < α < 1.2, we calculated D for each track by averaging D = 〈r2〉/4τ for all τ < 1 s.
Diffusion simulation
To test the fidelity of our software algorithms, we implemented a random walk generator that took a fluid viscosity (η0 = 10−3), temperature (T = 297 K), particle size (d = 228 nm), and time interval between steps τ = 1/20 s. It generated two pseudo-random sequences of step sizes that were normally distributed about zero, integrated to calculate positions x(t), y(t), then scaled to real units by the input parameters as defined by Eq. 4. This simulated particle trace was then processed using the same analysis pipeline as the real particle traces (Fig. 2).
Figure 2.
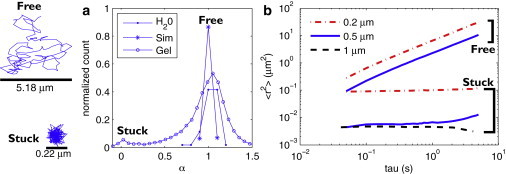
Nanoparticle diffusion in fibrin is bimodal, while microparticles get stuck. (a) From diffusion measurements of three particle sizes (0.2, 0.5, and 1 μm) in gels formed with 1 mg/mL fibrinogen and 10 nM thrombin, we generate a histogram of the 〈r2〉 power-law α. Particles in fibrin (○) fall into two populations: freely diffusing (α → 1) and stuck (α → 0). To verify that the observation of free and stuck populations was not an artifact of bead tracking or analysis algorithms, we compared our data with measurements on particles diffusing in buffer (●) and simulations of random-walks (∗), both of which showed no stuck population. (b) We separate and average the stuck and free population for each particle size and plot the average 〈r2〉 for both populations of each type of bead. Freely diffusing particles are those with 0.8 < α < 1.2. Stuck particles are those with α < 0.2. Note that there is no freely diffusing population of 1-μm particles.
Statistical methods
For measurements of Deff we calculated the 95% confidence interval (equivalent to a p-value of 0.05) , where Di is the Deff calculated for each tracker. This 95% confidence interval was plotted as vertical error bars in Figs. 3 and 4. Similar processing was used to determine confidence intervals for permeability, plotted as horizontal error bars in Fig. 4.
Figure 3.
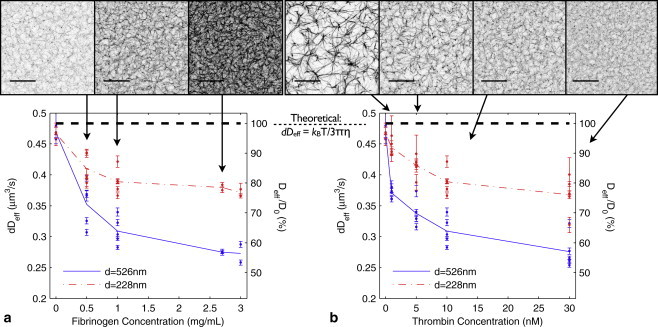
Nanoparticle diffusion is suppressed by fibrin gel. Comparing confocal microscopy (scale bar is 20 μm) of fibrin with particle diffusion shows that the size-scaled diffusion coefficient dDeff is sensitive to fibrin gel structure. The spacing between fibers can vary widely among clots of varying type, from 0.1–10 μm (31). Our clot imaging (Fig. 3) show fiber spacings across a similarly wide range. (a) Diffusion under varying fibrinogen concentration (thrombin concentration 10 nM). Deff of 526 nm particles (solid) diverges from buffer value (0 mg/mL fibrinogen) with increasing fibrinogen concentration. The smaller (228 nm) particles' diffusion (dash-dot) is also suppressed by the gel, but is less sensitive to the changes in gel structure. (b) A similar effect occurs with 228-nm and 526-nm particles under varying thrombin concentration (fibrinogen concentration 1 mg/mL). (Dashed line in both graphs) Theoretical prediction of dDeff for a sphere diffusing in water. In a homogeneous material, the quantity dDeff for two particles of different sizes is expected to be invariant. As this is not the case, nanoparticles of different sizes experience effectively different viscosities. Number of trackers N > 150 for each data point. On average, N = 480. Bars show 95% confidence intervals.
Figure 4.
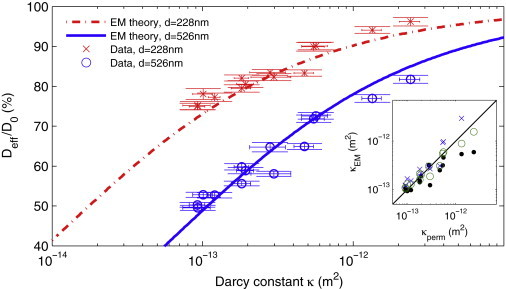
Nanoparticle diffusion in fibrin measures bulk permeability through the effective medium theory. Our data (×, ○) for Deff and κ overlay the effective medium theory (dash-dot and solid lines), without fitting parameters. (Horizontal and vertical bars) 95% confidence intervals. (Inset) The effective medium theory can be used to calculate clot permeability from a small-volume, high throughput diffusion assay. We derive κem from Deff and see one-to-one correspondence for 0.2 (×) and 0.5 μm (○) particles. Also shown is κem (●) derived using a technique that is agnostic to the background viscosity (Eq. 6).
Magnetic force application
Driven microrheometry measurements were performed on fibrin gels using a recently described multiforce high throughput system (34). Super-paramagnetic 2.8 μm particles (Invitrogen) were functionalized with PEG and mixed with varying concentrations of fibrinogen, as described above. Fibrin gels with suspended particles were formed in a magnetic microplate.
The magnetic drive sequence began with a de-Gauss (a rapidly decaying force profile that eliminates remanent magnetization—see Spero et al. (34)), followed by three pulses. Many PEG particles traveled all the way across the field of view to collide with the pole tip, causing tracks to end early. Due to the erratic motion of the particles, videos were decimated from 120 Hz to 4 Hz to enable hand-tracking of particles using the Manual Tracking plug-in for ImageJ (National Institutes of Health, Bethesda, MD). The error in this method is ∼d(1/3) = ± 1 μm. Net displacement was defined as the distance between a particle's first and last recorded positions. For particles that entered from outside the field of view, the initial position was taken to be the position at which the particle entered the field.
Results
Nanoparticle diffusion in fibrin is bimodal
Using an automated video microscopy system, we measured diffusion of thousands of PEG-functionalized nanoparticles (diameters d = 0.228, 0.526, and 1 μm) and examined their mean-squared displacements 〈r2〉 ∝ τα. We observed two populations of power laws α, as seen earlier in Fig. 2. Most particles diffused freely (α → 1), as if in a purely viscous fluid. The remaining particles had a lower power-law dependence (α → 0) indicative of a stuck particle. As expected, the particles diffusing in buffer and the simulated random walks both exhibited α → 1.
Nanoparticle diffusion depends on clot structure
To determine how free particle diffusion responds to the presence of a fibrin gel, we tested a range of purified gel types: from low to high thrombin concentration (1–30 nM); from low to high fibrinogen concentration (0.5–3 mg/mL); and with the two particle sizes (d = 228 and 526 nm). In each type of clot, and for each particle size, we captured on average 690 particle tracks, 480 of which were freely diffusing. Representative confocal microscopy of the clots is shown in Fig. 3. From the freely diffusing particle traces (α → 1), we calculated Deff. At least 150 freely diffusing particles were used to calculate each datapoint. The number of particles in the measurement is the dominant parameter in defining the confidence bars in Fig. 3.
We considered the measured diffusion coefficient scaled by the particle diameter, dDeff. According to Stokes-Einstein theory, this value should collapse to a common value for particles of different sizes in buffer,
| (5) |
where η0 is the viscosity of buffer and kBT is the thermal energy. Fig. 3 shows that only in buffer was dDeff invariant with bead size. As both fibrin density and thrombin concentration increased, the 526-nm particles saw greater fractional diffusion suppression than the 228-nm particles, implying that differently sized particles experience environments of different effective viscosities.
Diffusion at short timescales measures bulk permeability
To better understand the diffusion suppression reported in Fig. 3, we explicitly tested the effective medium theory (Eq. 2) by measuring gel permeability κ (Table 1). Clot permeabilities were in the expected range for purified clots—for example, see Blombäck and Okada (1). As expected, the permeability dropped with increasing thrombin and fibrinogen concentrations.
Table 1.
Summary of permeability measurements
| Fibrinogen (mg/mL) | Thrombin (nM) | κ (μm2) |
|---|---|---|
| 0.5 | 10 | 50 |
| 1 | 1 | 2.4 |
| 1 | 5 | 0.55 |
| 1 | 10 | 0.48 |
| 1 | 30 | 0.30 |
| 2.7 | 10 | 0.18 |
| 2 | 30 | 0.12 |
| 3 | 30 | 0.10 |
We compare our results with the effective medium theory in Fig. 4. The data points show excellent agreement with the theory, plotted as lines. Note that the data are plotted independent of the theory; namely, no fitting was performed to assemble Fig. 4. This result strongly implies that on these length- and timescales, hydrodynamic effects alone suppress nanoparticle diffusion in fibrin, as we hypothesized in our introduction of Eq. 1. Hydrodynamic diffusion suppression also explains the reason for the difference in relative suppression of 526-and 228-nm particles in Fig. 3: on average, the surface of the larger particles is closer to the gel matrix, where the fluid is less mobile and the resistance to motion greater. We are not aware of another polymer gel system in which this condition has been shown to hold true.
According to Eq. 2, Deff is determined both by the gel (through κ) and the viscosity and temperature of the solvent (through D0 (30)). In purified fibrinogen clots, the solvent viscosity is well controlled, but this is not the case in plasma or whole blood clots, where the viscosity is typically 2- to 100-fold (35). The solvent viscosity could be measured by eluting the solvent from the clot and measuring its viscosity independently, but this is impractical in a high-throughput protocol. We factored out the temperature and solvent viscosity by calculating the ratio Dd=526/Dd=228 for each clot type, then derived permeability using the relation
| (6) |
Fig. 4 shows one-to-one correlation between the Darcy constant calculated from the effective medium theory (κem) and the Darcy constant measured by gel perfusion (κperm).
Stuck particles pull free under applied force
It was surprising that some particles, even after PEG functionalization, did not freely diffuse. To explore the reason for this sticking, we used a magnetic force system (34) to apply forces to particles. We used 2.8-μm PEG and COOH particles, which, as with the 1-μm particles studied above, did not freely diffuse. Because COOH particles stick to fibrin, they oscillated back and forth as the force was turned on and off, but ultimately traveled short distances (0–26 μm). Some PEG particles, by contrast, jumped through the matrix of the gel, traveling as much as 65 μm in even the least permeable clots. Some PEG particles, however, did not travel long distances. In short, PEG surface chemistry increased microparticle mobility, but PEG particle behavior was heterogeneous and highly unpredictable. Videos of the driven particle experiments are available in Movie S1 in the Supporting Material.
The net travel of PEG particles as compared with COOH particles are shown in Fig. 5. The mean distances traveled by PEG particles as reported in Fig. 5 were lower bounds, because 31% (3 mg/mL fibrinogen clots) to 44% (0.5 mg/mL fibrinogen) of particles entered the field of view from off-screen while the forces were being applied. By contrast, no COOH particles entered the field of view during the pulling except in the clots formed with the least fibrinogen, in which 11% of particles entered from off-screen.
Figure 5.
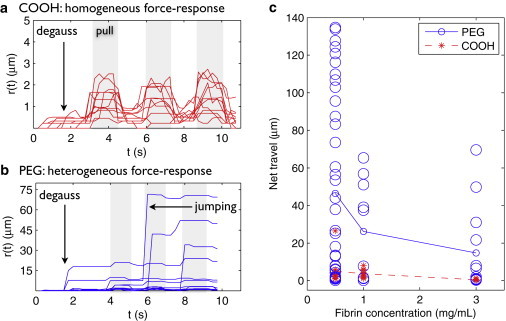
PEG microparticles (d = 2.8 μm) can be forced through fibrin gels at forces found in physiological blood flow. Magnets were de-Gaussed (see Spero et al. (34)), then pulsed three times, applying forces ≥100 pN. (See Discussion for physiological relevance of this force scale.) (a) COOH microparticle trajectories r(t) in clots prepared from 3 mg/mL fibrinogen, 10 nM thrombin. Without PEGylation, particles have a homogeneous, elastic force response: particles advance when the force is applied (shaded region) and retract when the force is turned off. (b) PEG microparticle trajectories r(t) in clots prepared from 3 mg/mL fibrinogen, 10 nM thrombin. Small forces (≥100 pN) break the stuck state of some PEG particles so that they jump long distances through the gel and do not retract to their original location. Some PEG particle tracks end early because the particles collide with the pole tip. The force response of PEG particles is heterogeneous: some do not travel long distances, which we attribute to physical entrapment of the particles in the gel. (c) Scatter plot showing net displacement of 2.8 μm PEG particles (○) and COOH particles (∗) after three pulses. Across clot types, there is a highly mobile population of PEG particles that does not exist for COOH particles. However, particle travel is widely scattered, suggesting a heterogeneous environment. (Lines) Average particle travel, for reference. Number of COOH particles N = 9, 10, and 11 and number of PEG particles N = 39, 10, and 13 for 0.5, 1, and 3 mg/mL fibrinogen, respectively.
From these data we can deduce the force required to disrupt the stuck-state of PEG particles in fibrin gel. The force applied by this magnetics system is highest at the edge of the pole tip; the farther the particle from the tip, the lower the applied force. The force at the pole tip was 2 nN; at the edge of the field of view (∼150 μm from the pole tip) the force was 0.1 nN. Therefore, forces of <100 pN can disrupt the stuck state of the particles such that they may move long distances through the gel. Thus, although PEGylated micron-scale particles do not freely diffuse in fibrin gels, they can be forced through the matrix at low force.
Discussion
Diffusion measures permeability in high throughput
We have demonstrated a fully automated assay (see Materials and Methods) that measures Deff and shown its utility as a single-parameter indicator of clot structure. Moreover, this diffusion coefficient can be used to calculate clot permeability through the effective medium theory. The myriad biochemical factors and pathological conditions that can affect clot structure speak to the need for effective tools to measure clot structure in high throughput. In particular, a high throughput permeability assay would enable small molecule or protein library screens to develop drugs that specifically target modification of clot permeability.
Nanoparticle-determination of permeability enables considerable labor and time savings over a permeability measurement. Each clot measurement in this work is based on thirteen 12-s videos, or 2.6 min per clot type. For a 96-well microplate, this represents 4.2 h of unattended data collection. By contrast, 96 permeability measurements would require 72–120 h of manual data collection, not including time required to exchange samples. In addition, the diffusion assay is microplate-compatible, so sample preparation and tray handling could also be automated.
Fig. 4 shows that the perfusion measurement of permeability is more sensitive than the calculated method. The former varies by a factor of 20 whereas the latter varies by a factor of 1.6. The calculated method, therefore, is best suited to high throughput screening studies, in which the faster diffusion method can identify leads for subsequent, detailed study. The measurement sensitivity is a concern if the scatter of κem for one clot type varied more than the separation between κem for two different clot types. Therefore, if greater sensitivity is required for such screens, the high throughput compatibility of the diffusion method enables measurements of multiple clots of each type to better distinguish close clusters. We also note that the calculated method could potentially reveal microscale heterogeneity of permeability within a clot or provide an in vivo characterization where pressure measurements across the clot would be difficult.
Regarding the short-timescale constraint for this assay: Fig. 1 a suggests that measuring particle diffusion on very short timescales would reveal spatial variation in Deff. In our data we did not see any evidence of this effect because the interfiber spacing l was typically <1 μm and Deff was ∼1 μm2/s, meaning spatial variations arise only for τ << 1 s, and this work used 0.05 < τ < 1 s. Hence, our data averages over the spatial variations in fluid mobility, as shown in Fig. 1 b. However, the suppression in both Fig. 1 a and b is due to the same hydrodynamic phenomenon, so this analysis should hold even if data from a shorter τ are used, provided that a statistically satisfactory population is gathered. By contrast, diffusion over long timescales would reveal additional diffusion suppression due to steric effects, and this would complicate efforts to extract permeability from particle diffusion.
Nature of stuck particles
Pulling on magnetic microbeads in fibrin revealed that forces <100 pN were adequate to break the stuck state of some PEG particles. By comparison, a typical covalent bond might require 1 eV/1 Å = 16 pN to rupture, and an ionic bond, 1 eV/1 nm = 160 pN. Our results strongly imply that covalent and strong electrostatic interactions—which the PEG particle surface was intended to minimize—are indeed blocked.
What, then, immobilizes a PEG particle in a clots? Potential mechanisms include physical entrapment, weak electrostatic interactions, or stochastic effects such as depletion flocculation. We believe these questions mark out fertile ground for discovery, and remain especially relevant in microrheology, where PEG functionalization has become an accepted technique for minimizing particle-polymer interaction.
Finally, our results provide some insight into issues of drug vector design. There are circumstances—most prominently, in fibrinolytic therapy—in which a drug must be delivered to or through a clot. Adding PEG to the surface of a drug vector should improve the vector's mobility. However, the existence of a stuck population in these experiments underscores that the physical picture for drug vector delivery through clots is not complete. The scatter in the microparticle transport under applied force (Fig. 5 c) shows that some particles are easier to pull free than others, with the minimum rupture force <100 pN. According to Stokes's Law, a particle in water experiences a 100-pN force at a flow rate of v < 4 cm/s (36). The higher viscosity of blood further reduces the required flow rate to v = 0.04–2 cm/s. Arterial flow rates are ∼75–110 mL/min (37), which for a typical artery lumen diameter of 4 mm (38) corresponds to a fluid velocity of 10–15 cm/s.
This result suggests that whatever the reason for the association between stuck PEG particles and fibrin in vitro, freely flowing blood may be able to prevent it in vivo. By contrast, an occlusive, low-permeability arterial clot (κ ∼ 10−13 m2, ΔP ∼ 50 mmHg), implies fluid velocities v ∼1 μm/s, suggesting that in such clots PEG microparticles could become attached to fibrin and not be dislodged by perfusion. These results highlight the need for further research into the impact of drug vector size and surface chemistry on drug delivery through clots, both in microfluidic and animal models.
Acknowledgments
This work was supported by National Institutes of Health grants 5-P41-RR02025- 21 and P41-EB002025. Richard Chasen Spero, Rachel K. Sircar, Russell M. Taylor II, and Richard Superfine are invested in Rheomics Inc., which has licensed techniques used in this article and protected under provisional patent application 421/248PROV.
Supporting Material
References
- 1.Blombäck B., Okada M. Fibrin gel structure and clotting time. Thromb. Res. 1982;25:51–70. doi: 10.1016/0049-3848(82)90214-6. [DOI] [PubMed] [Google Scholar]
- 2.Blombäck B., Carlsson K., Procyk R. Fibrin in human plasma: gel architectures governed by rate and nature of fibrinogen activation. Thromb. Res. 1994;75:521–738. doi: 10.1016/0049-3848(94)90227-5. [DOI] [PubMed] [Google Scholar]
- 3.van Gelder J., Nair C., Dhall D. Colloid determination of fibrin network permeability. Blood Coag. Fibrinolysis. 1996;7:747–760. doi: 10.1097/00001721-199611000-00002. [DOI] [PubMed] [Google Scholar]
- 4.Ajjan R., Lim B.C.B., Ariëns R.A.S. Common variation in the C-terminal region of the fibrinogen β-chain: effects on fibrin structure, fibrinolysis and clot rigidity. Blood. 2008;111:643–650. doi: 10.1182/blood-2007-05-091231. [DOI] [PubMed] [Google Scholar]
- 5.He S., Bark N., Blombäck M. Effects of acetylsalicylic acid on increase of fibrin network porosity and the consequent upregulation of fibrinolysis. J. Cardiovasc. Pharmacol. 2009;53:24–29. doi: 10.1097/FJC.0b013e3181953e0f. [DOI] [PubMed] [Google Scholar]
- 6.Ajjan R.A., Standeven K.F., Grant P.J. Effects of aspirin on clot structure and fibrinolysis using a novel in vitro cellular system. Arterioscler. Thromb. Vasc. Biol. 2009;31:1696–1702. doi: 10.1161/ATVBAHA.109.183707. [DOI] [PubMed] [Google Scholar]
- 7.Mutch N.J., Engel R., Ariëns R.A. Polyphosphate modifies the fibrin network and down-regulates fibrinolysis by attenuating binding of tPA and plasminogen to fibrin. Blood. 2010;117:661–668. doi: 10.1182/blood-2009-11-254029. [DOI] [PubMed] [Google Scholar]
- 8.Dunn E.J., Ariëns R.A.S., Grant P.J. The influence of type 2 diabetes on fibrin structure and function. Diabetologia. 2005;48:1198–1206. doi: 10.1007/s00125-005-1742-2. [DOI] [PubMed] [Google Scholar]
- 9.He S., Blombäck M., Jacobsson Ekman G., Hedner U. The role of recombinant factor VIIa (FVIIa) in fibrin structure in the absence of FVIII/FIX. J. Thromb. Hemostasis. 2003;1:1215–1219. doi: 10.1046/j.1538-7836.2003.00242.x. [DOI] [PubMed] [Google Scholar]
- 10.Fatah K., Silveira A., Karpe F. Proneness to formation of tight and rigid fibrin gel structures in men with myocardial infarction at a young age. Thromb. Hemostasis. 1996;76:417–421. [PubMed] [Google Scholar]
- 11.Undas A., Zalewski J., Zmudka K. Altered plasma fibrin clot properties are associated with in-stent thrombosis. Arterioscler. Thromb. Vasc. Biol. 2010;30:276–282. doi: 10.1161/ATVBAHA.109.194936. [DOI] [PubMed] [Google Scholar]
- 12.Undas A., Zawilska K., Tracz W. Altered fibrin clot structure/function in patients with idiopathic venous thromboembolism and in their relatives. Blood. 2009;114:4272–4278. doi: 10.1182/blood-2009-05-222380. [DOI] [PubMed] [Google Scholar]
- 13.Undas A., Podolec P., Tracz W. Altered fibrin clot structure/function in patients with cryptogenic ischemic stroke. Stroke. 2009;125:357–361. doi: 10.1161/STROKEAHA.108.532812. [DOI] [PubMed] [Google Scholar]
- 14.Undas A., Slowik A., Tracz W. Fibrin clot properties in acute ischemic stroke: relation to neurological deficit. Thromb. Res. 2010;125:357–361. doi: 10.1016/j.thromres.2009.11.013. [DOI] [PubMed] [Google Scholar]
- 15.Jackson G., James D. The permeability of fibrous porous media. Can. J. Chem. Eng. 1986;64:364–374. [Google Scholar]
- 16.Carr M.J., Hermans J. Size and density of fibrin fibers from turbidity. Macromolecules. 1978;11:46–50. doi: 10.1021/ma60061a009. [DOI] [PubMed] [Google Scholar]
- 17.Collet J.-P., Lesty C., Weisel J.W. Dynamic changes of fibrin architecture during fibrin formation and intrinsic fibrinolysis of fibrin-rich clots. J. Biol. Chem. 2003;278:21331–21335. doi: 10.1074/jbc.M212734200. [DOI] [PubMed] [Google Scholar]
- 18.Mickel W., Münster S., Schröder-Turk G.E. Robust pore size analysis of filamentous networks from three-dimensional confocal microscopy. Biophys. J. 2008;95:6072–6080. doi: 10.1529/biophysj.108.135939. [DOI] [PMC free article] [PubMed] [Google Scholar]
- 19.Mason T., Weitz D. Linear viscoelasticity of colloidal hard sphere suspensions near the glass transition. Phys. Rev. Lett. 1995;75:2770–2773. doi: 10.1103/PhysRevLett.75.2770. [DOI] [PubMed] [Google Scholar]
- 20.Crocker J.C., Valentine M.T., Weitz D.A. Two-point microrheology of inhomogeneous soft materials. Phys. Rev. Lett. 2000;85:888–891. doi: 10.1103/PhysRevLett.85.888. [DOI] [PubMed] [Google Scholar]
- 21.Kimura Y. Microrheology of soft matter. J. Phys. Soc. Jpn. 2009;78 041005-1–8. [Google Scholar]
- 22.Wirtz D. Particle-tracking microrheology of living cells: principles and applications. Annu. Rev. Biophys. 2009;38:301–326. doi: 10.1146/annurev.biophys.050708.133724. [DOI] [PubMed] [Google Scholar]
- 23.Phillips R., Deen W., Brady J. Hindered transport of spherical macromolecules in fibrous membranes and gels. AIChE J. 1989;35:1761–1769. [Google Scholar]
- 24.Johnson E., Berk D., Deen W. Hindered diffusion in agarose gels: test of effective medium model. Biophys. J. 1996;68:1561–1568. doi: 10.1016/S0006-3495(96)79645-5. [DOI] [PMC free article] [PubMed] [Google Scholar]
- 25.Valentine M., Perlman Z., Weitz D. Colloid surface chemistry critically affects multiple particle tracking measurements of biomaterials. Biophys. J. 2004;71:2742–2750. doi: 10.1529/biophysj.103.037812. [DOI] [PMC free article] [PubMed] [Google Scholar]
- 26.Collet J.-P., Shuman H., Weisel J.W. The elasticity of an individual fibrin fiber in a clot. Proc. Natl. Acad. Sci. USA. 2005;102:9133–9137. doi: 10.1073/pnas.0504120102. [DOI] [PMC free article] [PubMed] [Google Scholar]
- 27.Jahnel M., Waigh T.A., Lu J.R. Thermal fluctuations of fibrin fibers at short time scales. Soft Matter. 2008;4:1438–1442. doi: 10.1039/b802555j. [DOI] [PubMed] [Google Scholar]
- 28.Piechocka I.K., Bacabac R.G., Koenderink G.H. Structural hierarchy governs fibrin gel mechanics. Biophys. J. 2010;98:2281–2289. doi: 10.1016/j.bpj.2010.01.040. [DOI] [PMC free article] [PubMed] [Google Scholar]
- 29.Phillips R. A hydrodynamic model for hindered diffusion of proteins and micelles in hydrogels. Biophys. J. 2000;79:3350–3353. doi: 10.1016/S0006-3495(00)76566-0. [DOI] [PMC free article] [PubMed] [Google Scholar]
- 30.Einstein A. On the movement of small particles suspended in stationary liquids required by the molecular-kinetic theory of heat. Annalen der Physik. 1905;17:549–560. [Google Scholar]
- 31.Diamond S.L. Engineering design of optimal strategies for blood clot dissolution. Annu. Rev. Biomed. Eng. 1999;1:427–462. doi: 10.1146/annurev.bioeng.1.1.427. [DOI] [PubMed] [Google Scholar]
- 32.Lai S., O'Hanlon D., Hanes J. Rapid transport of large polymeric nanoparticles in fresh undiluted human mucus. Proc. Natl. Acad. Sci. USA. 2007;104:1482–1487. doi: 10.1073/pnas.0608611104. [DOI] [PMC free article] [PubMed] [Google Scholar]
- 33.Wong I., Gardel M., Weitz D. Anomalous diffusion probes microstructure dynamics of entangled F-actin networks. Phys. Rev. Lett. 2004;92:178101. doi: 10.1103/PhysRevLett.92.178101. [DOI] [PubMed] [Google Scholar]
- 34.Spero R., Vicci L., Superfine R. High throughput system for magnetic manipulation of cells, polymers, and biomaterials. Rev. Sci. Instru. 2008;79:044302. doi: 10.1063/1.2976156. [DOI] [PMC free article] [PubMed] [Google Scholar]
- 35.Rand P.W., Lacombe E., Austin W.H. Viscosity of normal human blood under normothermic and hypothermic conditions. J. Appl. Physiol. 1964;19:117–222. doi: 10.1152/jappl.1964.19.1.117. [DOI] [PubMed] [Google Scholar]
- 36.Happel J., Brenner H. Mechanics of Fluids and Transport Processes. Springer; New York: 1983. Low Reynolds number hydrodynamics: with special applications to particulate media. [Google Scholar]
- 37.Knaapen P., Camici P.G., van Rossum A.C. Coronary microvascular resistance: methods for its quantification in humans. Basic Res. Cardiol. 2009;104:485–498. doi: 10.1007/s00395-009-0037-z. [DOI] [PMC free article] [PubMed] [Google Scholar]
- 38.Dodge J.T., Brown B.G., Dodge H.T. Lumen diameter of normal human coronary arteries. Influence of age, sex, anatomic variation, and left ventricular hypertrophy or dilation. Circulation. 1992;86:232–246. doi: 10.1161/01.cir.86.1.232. [DOI] [PubMed] [Google Scholar]
Associated Data
This section collects any data citations, data availability statements, or supplementary materials included in this article.