

Abstract
Alcohols are known modulators of lipid bilayer properties. Their biological effects have long been attributed to their bilayer-modifying effects, but alcohols can also alter protein function through direct protein interactions. This raises the question: Do alcohol's biological actions result predominantly from direct protein-alcohol interactions or from general changes in the membrane properties? The efficacy of alcohols of various chain lengths tends to exhibit a so-called cutoff effect (i.e., increasing potency with increased chain length, which that eventually levels off). The cutoff varies depending on the assay, and numerous mechanisms have been proposed such as: limited size of the alcohol-protein interaction site, limited alcohol solubility, and a chain-length-dependent lipid bilayer-alcohol interaction. To address these issues, we determined the bilayer-modifying potency of 27 aliphatic alcohols using a gramicidin-based fluorescence assay. All of the alcohols tested (with chain lengths of 1–16 carbons) alter the bilayer properties, as sensed by a bilayer-spanning channel. The bilayer-modifying potency of the short-chain alcohols scales linearly with their bilayer partitioning; the potency tapers off at higher chain lengths, and eventually changes sign for the longest-chain alcohols, demonstrating an alcohol cutoff effect in a system that has no alcohol-binding pocket.
Introduction
Alcohols have been extensively studied for more than a century, yet their mechanism of action remains controversial. Seminal work by Meyer (1) and Overton (2) linked the action of alcohols and other anesthetics to changes in membrane properties through the proportionality between their oil/water partitioning and their anesthetic action (for a review, see Seeman (3)). Investigators have extensively studied alcohol-induced changes in lipid bilayer properties using numerous different systems and methods that focus on a variety of properties (see Table 1). In addition to alcohol's acute effects (e.g., changing the lipid bilayer free volume (4–6) and disorder (7–9)), alcohols and other organic solvents also have chronic effects (e.g., changing protein distribution and expression (10), and lipid composition (11)).
Table 1.
Bilayer physicochemical properties invoked to account for the effect of alcohols
| Property | Examples of use |
|---|---|
| Area compressibility modulus | (12) |
| Bending modulus | (12) |
| Hydration | (13) |
| Interfacial tension | (12) |
| Ionic permeability | (14,15) |
| Lateral pressure profile | (16,17) |
| Lysis tension | (12) |
| Molar volume/free volume | (4–6,12) |
| Order parameter | (7–9,13,18) |
| Phase transition temperature | (19–21) |
| Thickness | (12,22,23) |
List is not exhaustive but demonstrates the complexity of the alcohol-bilayer interaction by showing a few descriptors and referencing examples of their use.
The biological efficacy of alcohols of various chain lengths (i.e., with different numbers of carbon atoms) often displays a so-called cutoff effect (24–27). For the shorter alcohols, the alcohols' potency increases with increasing chain length. Beyond a certain chain length, further increases in length have less effect on potency, and may even reduce it. A cutoff effect is observed in a variety of systems: Alcohols with chain lengths ≤ 6 increase the formation of the photoactivated form of rhodopsin in 1-palmitoyl-2-oleylphosphatidylcholine lipid vesicles, whereas longer alcohols decrease its formation (5). In Xenopus oocytes, ethanol through 1-butanol potentiate nicotinic acetylcholine receptor currents, whereas longer alcohols inhibit them (28). The antimicrobial activity for a range of microbes peaks at alcohol chain lengths varying between 7 and 16 carbons depending on the organism (29), and the anesthetic effect on tadpoles reaches a maximum at 1-dodecanol and 1-tridecanol, with longer alcohols being inactive (9).
The cutoff effect could be due to steric hindrances in alcohol-protein interactions; however, it could also reflect alcohol-bilayer interactions that are more complex than would be expected from a simple partition model. The interplay between an alcohol's affinity for a protein and limited solubility also can lead to a cutoff effect (30). Aagaard and co-workers (6) found that short-chain alcohols (1-hexanol and shorter) cause volume increases when partitioning into dimyristoylphosphatidylcholine bilayers, whereas longer alcohols cause volume decreases. These cutoff effects tend to appear when the alcohol chain length is approximately equal to half the acyl chain length of the bilayer-forming lipids, as suggested previously (6) and (31).
In addition to alcohol modifications of lipid bilayer properties, there is evidence for direct alcohol interactions with membrane proteins (for a review, see Dopico and Lovinger (32)). Membrane proteins' alcohol sensitivity has been assigned to specific protein regions, and some proteins' alcohol response can be modulated by single amino acid substitutions (33–36).
There is no dispute that alcohols alter lipid bilayer properties, as assayed with a variety of methods, but are these effects sufficient to alter membrane protein function at the concentrations where they alter biological functions? Do direct alcohol-protein interactions dominate, or are the biological effects of alcohols due to a combination of direct and bilayer-mediated effects? To address these questions, and to explore the general structure-activity relationship for amphiphiles, we determined the bilayer-modifying potency of various alcohols using a gramicidin (gA)-based fluorescence assay (37,38). gA channels are formed by the transbilayer dimerization to two nonconducting subunits (39). The channel's hydrophobic length is usually less than the bilayer's hydrophobic thickness, meaning that the bilayer adapts locally to accommodate the channel. This adaptation, or deformation, has an associated energetic cost such that the gA channel monomer↔dimer equilibrium is energetically coupled to the cost of deforming the bilayer (40–43). gA channels thus serve as molecular force probes to assay changes in lipid bilayer properties, as sensed by a bilayer-spanning channel (42,45). Changes in bilayer properties that alter the energetics of the gA monomer↔dimer equilibrium alter the time-averaged number of conducting gA channels, which can be assayed from the changes in the rate of fluorescence quenching.
Materials and Methods
Alcohols of the highest available purity were obtained from Sigma Chemical (St. Louis, MO). We determined the alcohols' bilayer-modifying potency using a gA-based fluorescence assay as described previously (37,38) and in the Supporting Material. In brief, we made fluorophore-loaded large unilamellar lipid vesicles (LUVs) using a mixture of hydration, sonication, freeze-thawing, and mini-extrusion. The vesicle-forming lipid was 1,2-dierucoyl-sn-glycero-3-phosphocholine (DC22:1PC; Avanti Polar Lipids, Alabaster, AL), which was selected based on the gA channel dynamics and gel/liquid-crystalline transition temperature (see Supporting Material). The fluorophore was the disodium salt of 8-aminonaphthalene-1,3,6-trisulfonic acid (ANTS; Invitrogen, Eugene, OR). Experiments were done with gA-containing and -free LUVs. The gA-containing LUVs were incubated with 260 nM gA from Bacillus brevis (Sigma Chemical) for 24 h before each experiment. The LUVs were incubated with the alcohols for 10 min at 25°C, which was sufficient for equilibration (see Supporting Material). We determined the gA channel activity from the fluorescence time course, recorded with an SX.20 stopped-flow spectrometer (Applied Photophysics, Leatherhead, UK), after mixing the ANTS-loaded LUVs 1:1 with either a gA channel-permeable quencher (Tl+; 50 mM TlNO3, 94 mM NaNO3, 10 mM HEPES, pH 7.0) or a Tl+-free buffer (140 mM NaNO3, 10 mM HEPES, pH 7.0). The fluorescence was normalized to the initial buffer value and the rate of quencher influx was quantified as described in the Supporting Material. We quantified each alcohol's bilayer-modifying potency (D) as the concentration at which the alcohol doubled the quenching rate, which we determined by fitting a linear relation (f([alc]) = 1 + [alc]/D) to the relative increases in quenching rate as a function of alcohol concentration ([alc]).
For experiments with long-chain alcohols, the alcohols were diluted in chloroform and mixed in with the vesicle-forming lipid before the vesicles were dried and rehydrated. The addition of 780 nM (rather than 260 nM) gA to the gA-containing LUVs increased the number of conducting channels and allowed us to better detect any decrease in quenching rate (i.e., a decrease in the number of channels). The quenching rates are reported without normalization as the averages of four to six experiments from at least two different vesicle preparations.
In experiments with thinner bilayers, fluorophore-loaded LUVs were made from 1,2-dieicosenoyl-sn-glycero-3-phosphocholine (DC20:1PC) and used with either gA from B. brevis or a sequence-shortened gA analog, des-[Val1-Gly2]gA− (gA−(13)), synthesized and purified as described previously (46).
Results
We determined the bilayer-perturbing potency of a series of aliphatic alcohols in DC22:1PC lipid bilayers using a gA-based fluorescence assay (37,38). Fig. 1 shows fluorescence time courses demonstrating the effect of 3-pentanol on the quenching (Tl+ influx) rate. Without quencher, the ANTS-loaded LUVs fluoresce with no apparent decay (Fig. 1, A and B, top curve) on this timescale (1 s). When the quencher (Tl+) is added to ANTS-filled LUVs without gA, there is a small instantaneous quenching of extravesicular fluorophore, and a slow reduction in fluorescence due to quencher leakage through the vesicle membrane (Fig. 1, A and B, second and third curves from top). The quencher (Tl+) readily permeates through conducting gA channels (47,48). In the presence of gA, a fraction of the LUVs will have one or more conducting gA channels, and gA monomers may dimerize to form conducting channels during the experiment, leading to quencher influx and reduction in fluorescence (Fig. 1, A and B, fourth curve). The alcohols shift the gA monomer↔dimer equilibrium toward the conducting dimers, leading to more conducting gA channels and faster quencher influx (Fig. 1, A and B, bottom three curves). The quenching rate was quantified (see Supporting Material) (37) and the change in fluorescence quenching as a function of alcohol concentration ([alc]) was determined (Fig. 1 C). At high concentrations, alcohols reduce bilayer stability (12,21) and break down the lipid bilayer barrier properties, causing increased ion permeability (14,15). Therefore, for each alcohol, we tested the maximum concentration used in vesicles without gA to confirm that the alcohols at these concentrations do not by themselves promote significant quencher leakage or vesicle breakdown. We also examined whether the alcohols increase the Tl+ influx rate by promoting Tl+ movement along defects at the channel/bilayer boundary, and found that this was not the case (see Discussion).
Figure 1.
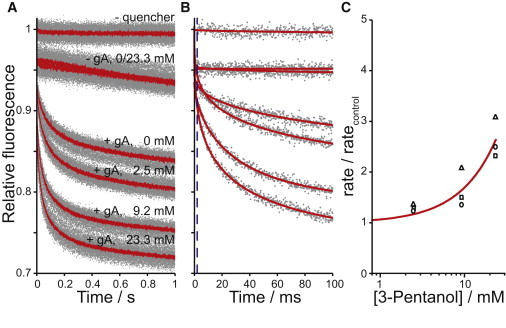
3-Pentanol's bilayer-perturbing effect, as determined using a gA-based fluorescence assay. Normalized fluorescence time courses for fluorophore-loaded LUVs incubated with varying [3-pentanol], with and without 260 nM gA and with and without external quencher. (A) Average traces (lines) and results from all repeats (>7 per condition; dots) over 1 s. (B) One repeat for each experimental condition in A (dots), as well as stretched exponential fits (2–100 ms) to those repeats (solid lines). The stippled line denotes the 2 ms mark. (C) The normalized quenching rate relative to rates of vesicles with the same amount of gA and no added 3-pentanol. Results are for three different days of experiments (differently shaped symbols); the solid line indicates a f([alc]) = 1 + [alc]/D fit to the results.
We tested a total of 24 different aliphatic alcohols, including straight-chain alcohols from methanol through 1-decanol, and a number of branched variants. Fig. 2 A shows the relative changes in quenching rate for the straight-chain alcohols, and Fig. 2 B shows similar results for a representative set of branched alcohols (1-pentanol, 2-pentanol, and 3-pentanol). Fig. S1 summarizes our results for the 24 alcohols. For the shorter straight-chain alcohols (methanol through 1-hexanol), the potency increases logarithmically for each added methylene group, in agreement with the expected change in bilayer partition energy (700–800 cal/mole for each added –CH2 group (49–53)). Further increases in chain length (1-octanol and 1-nonanol) cause smaller increases in potency, and 1-decanol is less potent than 1-heptanol.
Figure 2.
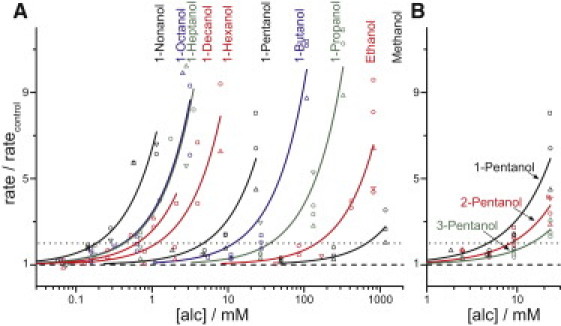
Relative changes in quenching rate as a function of alcohol concentration. Results are shown for (A) straight-chain alcohols (methanol through 1-decanol) and (B) 1-pentanol, 2-pentanol, and 3-pentanol. Each alcohol was tested on at least three different days (differently shaped symbols); the solid lines are fits of f([alc]) = 1 + [alc]/D to the results. The dashed lines mark 1 (no change) and the dotted lines mark 2 (the doubling rates, D).
For each alcohol, a straight line (f([alc]) = 1 + [alc]/D) is fit to the results to determine the [alc] needed to double the quenching rate (D) as a measure of the alcohol's bilayer-modifying potency. Fig. 3 A shows D for all of the alcohols tested (using this experimental design). Similarly to the dose-response curves (Fig. 2 and Fig. S1), D shows the same logarithmic decrease (increase in potency) as a function of chain length for the shorter alcohols, with a gradual leveling off at longer chain lengths. Except for nonanol and decanol, the straight-chain variants are more potent than their branched counterparts.
Figure 3.
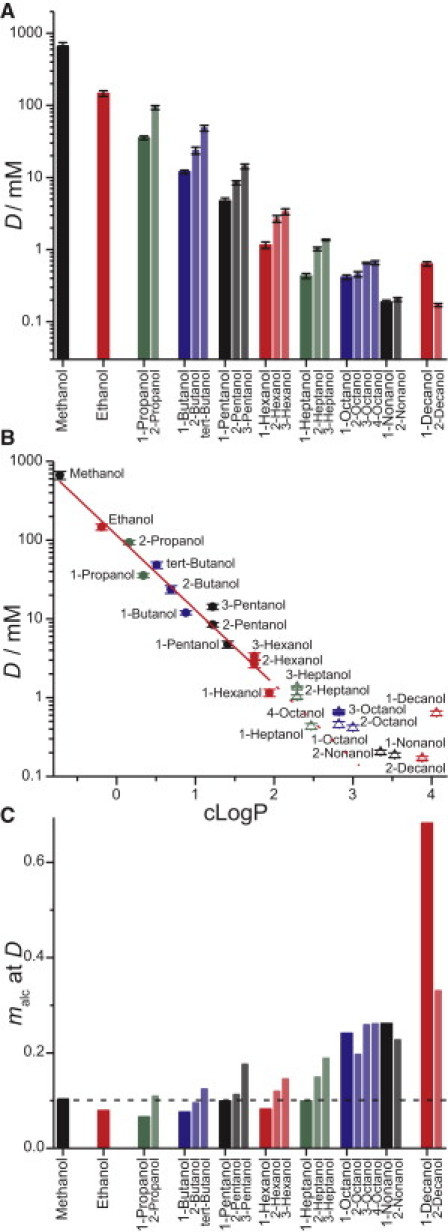
Bilayer-perturbing potency of alcohols. The concentration at which the alcohols double the quenching rate D, as determined by fitting f([alc]) = 1 + [alc]/D to the alcohols' fluorescence quenching dose-response curve; error bars are the fits' standard errors for D. (A) D as a function of alcohol chain length. (B) D as a function of alcohol bilayer partitioning. The alcohol's bilayer partition coefficient is estimated as the calculated octanol/water partition coefficient (cLogP), using the ACD/Labs LogP algorithm (54). A linear fit (solid line) of all alcohols with six or fewer carbons (solid symbols) gives a slope = 0.95, R = 0.97. The dotted line is an extrapolation of the linear fit and meant to guide the eye. (C) The alcohol membrane mole fraction (malc) at D. The stippled line indicates malc = 0.1.
Fig. 3 B shows how the alcohols' bilayer-perturbing potency (quantified as D) varies with their estimated bilayer partition coefficient (Kp). There is considerable variation in both the experimental and calculated octanol/water and lipid bilayer Kps. For this analysis, we used the alcohols' calculated octanol/water partitioning (cLogP) from the ACD/Labs LogP algorithm (54) as a proxy for alcohols bilayer/water Kps (55–58). For a discussion/evaluation of the alcohols' Kps in lipid bilayers, see the Supporting Material and Fig. S2. The shorter alcohols (methanol through hexanol) have very similar bilayer activity, as their effect scales linearly with their predicted bilayer Kps (Fig. 3 B, red line). The longer alcohols (octanol through decanol) have less effect than predicted from their Kps and results for the shorter alcohols.
The increased hydrophobicity of the longer alcohols, together with the finite water/lipid volume ratio, means that the actual aqueous alcohol concentrations ([alc]a) will be lower than the added (or nominal) concentrations ([alc]nom). Therefore, the nominal concentrations needed to double the quenching rate (D) will be higher than would be the case in a system with infinite water/lipid ratio. To verify that the relative decrease in potency of the longer alcohols is not due to depletion from the aqueous phase, we calculated the alcohols' free [alc]a and the alcohol mole fractions in the membrane (malc) using the Kps defined above (Fig. 3 C and Supporting Material). For the shorter alcohols (methanol through hexanol), the malc-values required to double the quenching rate are roughly the same: about one alcohol per 10 lipids. For the longer alcohols (octanol through decanol), the longer the chain length, the higher is the malc required to observe the same change in gA activity. For tabulated information on the alcohols tested (i.e., structure, molecular weight, D, cLogP, and malc) using this experimental design, see Table S1.
Limited aqueous solubility of the longer-chain alcohols could lead to the formation of a separate alcohol phase and a reduction in the actual malc. Solubility limitations therefore would be expected to show up as apparent saturation of the alcohol-induced increase in fluorescence quenching with increasing [alc]. We detected no such saturation, and all of the alcohols tested displayed a linear increase in quenching rate with [alc] (Fig. S1). Previous alcohol solubility determinations (59) and solubility values reported in the PhysProp database (Syracuse Research, Syracuse, NY) indicate that, at D, all [alc]nom (except that of 1-decanol) are below the aqueous solubility. (No solubility data are available for 2-decanol, but 2-decanol was used at concentrations equal to or lower than that of 1-decanol, and branched alcohols have a higher solubility than their straight-chain counterparts.) 1-Decanol's solubility limit is below [alc]nom but above the calculated [alc]a at D.
To examine whether the added 1-decanol reached the bilayer phase, we repeated the gA-based fluorescence experiments for ethanol, 1-octanol, and 1-decanol using twice the amount of lipid (see Fig. S3). For ethanol and 1-octanol, there was no significant difference. For 1-decanol, D was 75% higher than in the regular experiments, in good agreement with the expected 60% reduction in the aqueous phase concentration, indicating that all of the alcohol is accessible to the bilayer phase.
The longer the alcohol, the lower the [alc] that is required for a given effect (Figs. 2 and 3 A), except for 1-decanol. From methanol through 1-hexanol, each straight-chain alcohol's potency increases three- to fourfold for each additional –CH2 group, consistent with their increased Kp. The increase in potency (i.e., reduction in D) from 1-heptanol through 1-nonanol is smaller, and higher concentrations of 1-decanol than 1-heptanol are needed to observe the same effect. This is reminiscent of a cutoff effect, which is often taken as evidence for a protein-binding site. In this case, however, the cutoff effect occurs in the absence of an alcohol-binding site, and reflects chain-length-dependent changes in the alcohol-induced modulation of bilayer properties. This is consistent with the previously observed decline in the alcohols' bilayer-modifying effects at longer alcohol chain lengths (5,13), and suggests that increasing the alcohol's chain length compensates for the disordering at the bilayer/solution interface.
The alcohol chain lengths where we observe a cutoff are close to half the acyl chain length of the lipids (11 for the 22-carbon-long DC22:1PC lipids used in the LUVs), in general agreement with observations that the alcohol-induced changes in bilayer properties shift from disordering to ordering at alcohol chain lengths close to half the length of the bilayer-forming lipids (6,31). This would suggest that even longer-chain alcohols should have even further reduced potency, and that eventually we should be able to observe a shift from increasing the quenching rate to decreasing it, i.e., a shift from stabilizing the conducting/dimerized gA to stabilizing the nonconducting monomeric form. We found that this is indeed the case (see below).
For methanol through heptanol, the branched alcohols are less potent than their straight-chain counterparts (Fig. 3 A), in agreement with the reduced hydrophobicity of branched alcohols (Table S1). The branched octanols are less potent than 1-octanol, but the relative differences are smaller than for the shorter alcohols. 2-Nonanol is approximately equipotent to 1-nonanol, and 2-decanol is more potent than 1-decanol, again suggesting that the alcohols are reaching some cutoff length. The reduced hydrophobicity of the branched 2-nonanol and 2-decanol, as compared with 1-nonanol and 1-decanol, is balanced by the reduced bilayer-modifying potency of the longer-chain alcohols (closer to half the length of the lipid acyl chains; see below). The increased bilayer-modifying potency (per molecule) of the long-chain branched alcohols is sufficient to compensate for their reduced bilayer concentration relative to their straight-chain counterparts.
To further explore the basis for the reduced bilayer-modifying propensity of the longer-chain alcohols, we examined alcohols with chain lengths > 10. Fig. 4 shows the quenching rate for fluorophore-loaded LUVs made with 20 mol % long-chain alcohols in the lipid phase. (Due to insolubility, we could not add them through the aqueous phase, so we added the alcohols before making the vesicles; see Materials and Methods.) Fig. 4 A shows average fluorescence time courses recorded with LUVs made with no alcohol (control), 1-dodecanol, and 1-hexadecanol. The top three traces are without gA, the remaining six have gA, and the bottom three also have 816 mM ethanol (added to the aqueous phase) as a positive control. The presence of 20 mol % of any of the alcohols tested did not increase quencher leakage into the vesicles (Fig. 4 A, top three traces). Fig. 4 B summarizes the results (average ± SD) for control (no alcohol), 1-octanol, 1-decanol, 1-dodecanol, 1-tetradecanol, 1-hexadecanol, and a sample prepared with 20% more lipid (to control for the added volume of the long-chain alcohols). The water-soluble alcohols, 1-octanol and 1-decanol, cause no change in influx rate, as would be expected from the low concentration in each sample (56 μM in the aqueous phase). 1-Dodecanol, 1-tetradecanol, and 1-hexadecanol reduce the influx rate (p < 0.01), showing that these long-chain alcohols shift the gA monomer↔dimer equilibrium away from the dimeric form. Subsequent addition of ethanol shifts the equilibrium back toward the conducting gA dimer (Fig. 4 A, bottom three traces, shows the fast fluorescence time courses recorded for control, 1-dodecanol, and 1-hexadecanol LUVs with 816 mM ethanol in the aqueous phase). Alcohols inserted into the LUVs bilayer occupy a specific area, increasing the total bilayer area and diluting the gA in the membrane. This does not, however, account for the reduced quenching rates, as demonstrated by the controls with 20% more lipid (the lipids have a larger area per molecule than the alcohols), which show only a modest reduction in quenching rate (Fig. 4 B). Nor are the changes in quenching rate due to alcohol-induced changes in the gel-liquid crystal transition temperature (Supporting Material).
Figure 4.
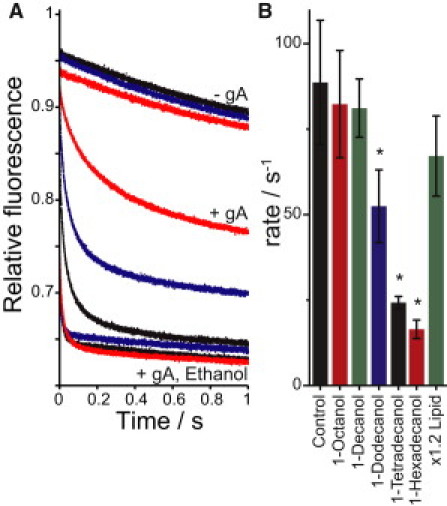
Bilayer-perturbing effects of long-chain alcohols. Fluorophore-loaded LUVs were made with 20 mol % of long alcohols added to the vesicle-making lipid solution. (A) Average traces without gA for the no-alcohol control, 1-dodecanol, and 1-hexadecanol (top three traces). The remaining six traces have 780 nM gA for 1-hexadecanol, 1-dodecanol, and control (middle three traces), and 816 mM ethanol (added to the aqueous LUV solution) for 1-dodecanol, control, and 1-hexadecanol (bottom three traces). (B) Fluorescence quenching rates (average ± SD, n = 4–6) for vesicles with 780 nM gA; 20 mol % of the following alcohols was added to the vesicle-making solution: nothing/control, 1-octanol, 1-decanol, 1-dodecanol, 1-tetradecanol, 1-hexadecanol, and additional DC22:1PC lipid. The asterisk indicates a significance of p < 0.01 compared with control.
In DC22:1PC lipid vesicles, higher mole fractions of octanol through decanol relative to the shorter alcohols were needed to achieve the same increases in quenching rates (Fig. 3 C), and 1-dodecanol to 1-hexadecanol decreased the influx rate (Fig. 4). These results are consistent with an alcohol cutoff occurring at chain lengths close to half the length of the lipid acyl chains (6,31). The alcohol cutoff thus would be expected to shift to shorter chain lengths in thinner bilayers. Fig. 5 A shows average fluorescence time courses, and Fig. 5 B shows normalized quenching rates in fluorophore-loaded DC20:1PC LUVs. The thinner DC20:1PC bilayers have a greater permeability to Tl+ than the DC22:1PC bilayers (cf. the top traces in Fig. 5 A and Figs. 1 A and 4 A), and the DC20:1PC LUVs are more sensitive to disruption by alcohols. Because the gA monomer↔dimer equilibrium depends on bilayer thickness (hydrophobic mismatch between the channel and the bilayer), the equilibrium is shifted toward the conducting gA dimers in the thinner DC20:1PC LUVs, and it becomes difficult to detect changes in gA activity (see Fig. S4 and discussion in the Supporting Material). We therefore used a sequence-shortened gA−(13) (two amino acids shorter than wild-type gA). In fluorophore-loaded DC20:1PC LUVs doped with gA−(13), we observed that ethanol, 1-octanol, and 1-nonanol increased the quenching rate, whereas 1-decanol decreased the rate (Fig. 5 B). The alcohol cutoff shifted toward shorter chain lengths in the thinner bilayer.
Figure 5.
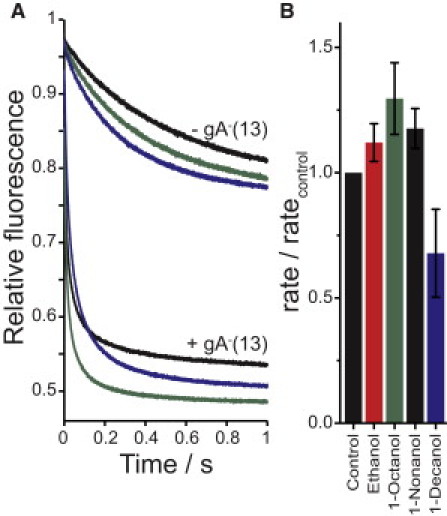
Alcohol bilayer-perturbing effects in thinner (DC20:1PC) bilayers. Fluorophore-loaded LUVs were made using DC20:1PC, and 80 nM of a sequence-shortened gA analog (gA−(13)) were added to the gA-containing vesicles. The effects of ethanol, 1-octanol, 1-nonanol, and 1-decanol were determined at twice their doubling rate concentration, D, or 294, 0.82, 0.38, and 1.26 mM respectively. (A) Average traces without gA for control, 1-octanol, and 1-decanol (top three traces), and with added gA−(13) for control, 1-decanol, and 1-octanol (bottom three traces). (B) Average and SD of the relative change in quenching rates as a function of added alcohols.
Discussion
It has long been known that alcohols alter lipid bilayer properties and membrane protein function (3,32). Investigators have described the changes in bilayer properties using a variety of terms, reflecting the experimental methods used (Table 1). It thus remains a challenge to decipher the extent to which the mechanisms that underlie alcohol-induced changes in membrane protein function result from direct alcohol-protein interactions or from changes in lipid bilayer physicochemical properties. We therefore took the reverse approach and used gA channels to probe the alcohols' bilayer-modifying effect as sensed by a bilayer-spanning channel.
Alcohols change the bilayer properties
In the gA-based fluorescence assay, the rate of fluorescence quenching reflects the time-averaged number of conducting gA channels in the LUVs, meaning that changing the equilibrium distribution between nonconducting gA monomer and conducting channels will alter the quenching rate (37,38). Because the energetics of the gA monomer↔dimer equilibrium varies with changes in bilayer properties such as bilayer thickness, elasticity, and curvature (45), the gA channels become useful probes for alcohol-induced changes in bilayer properties. All 27 aliphatic alcohols tested changed the bilayer properties, as evidenced by the altered quenching rate. At the concentrations tested, none of the alcohols significantly changed the quenching rate in the absence of gA channels, nor did the alcohols in combination with gA channels cause quencher permeable defects in bilayer (Fig. S4).
Methanol through nonanol increase the quenching rate, and the longer alcohols (1-dodecanol, 1-tetradecanol, and 1-hexadecanol) decrease the rate. 1-Decanol increases the quenching rate in DC22:1PC LUVs but decreases the rate in DC20:1PC LUVs. The relative bilayer-modifying potency of the water-soluble alcohols (methanol through decanol) in DC22:1PC LUVs is defined by the alcohol concentration that doubles the quenching rate, D (see Fig. 3 A). For the shorter alcohols (methanol through hexanol), the bilayer-modifying potency scales linearly with the predicted bilayer partitioning (Fig. 3 B). The alcohol mole fractions in the membrane (malc) needed to double the quenching rate is about one alcohol molecule per 10 lipid molecules (Fig. 3 C and Table S1), corresponding to one alcohol molecule in the first lipid shell around the gA channel. For the longer alcohols (octanol through decanol), the bilayer-perturbing effect tapers off (i.e., greater malc is required to observe similar bilayer effects).
Alcohols have their –OH group in the bilayer interfacial region and their hydrophobic methyl groups in the hydrophobic core of the bilayer (60) (also see references in Aagaard et al. (6)), thereby perturbing the lipid acyl chain packing. Each additional methyl group increases the alcohols' partition coefficient into the bilayer, but the bilayer-perturbing effect per molecule remains similar. Around hexanol to octanol, the alcohol chain becomes long enough to diminish the overall bilayer effect of the alcohols. For nonanol and decanol, the reduced bilayer-perturbing effect per molecule outweighs the increased partitioning due to greater hydrophobicity. For the long-chain alcohols (1-dodecanol, 1-tertradecanol, and 1-hexadecanol (Fig. 4)), the alcohols' chain effect dominates and the overall bilayer-perturbing effect changes sign, biasing the monomer↔dimer equilibrium toward the monomer instead of the dimer.
Effects of alcohol depend on the bilayer
Previous electrophysiology results obtained using gA channels in thinner hydrocarbon-containing bilayers showed a switch away from stabilizing the monomer over the dimer at shorter alcohol chain lengths. In monoolein/squalane bilayers, 1-hexanol, 1-octanol, 1-decanol, 1-dodecanol, 1-tetradecanol, 1-hexadecanol, and 1-octadecanol decreased gA single-channel lifetimes (61). In diphytanoylphosphatidylcholine (DPhPC)/n-decane bilayers, 1-butanol, 1-hexanol, and 1-octanol decreased the gA single-channel lifetime, whereas ethanol increased the lifetime (62,63).
The single-channel studies report changes in gA lifetime, whereas the fluorescence assay detects overall change in gA activity (lifetime and frequency). Nevertheless, the single-channel results suggest a cutoff at chain lengths less than half the length of the lipid acyl chains. The disparity in the measured bilayer-modifying potencies likely reflects the different systems used, i.e., hydrocarbon-free bilayers having 20- to 22-carbon-long lipid acyl chains (DC20:1PC or DC22:1PC) in the fluorescence assay versus hydrocarbon containing (squalane or n-decane) bilayers having 18- (monoolein) or 16- (DPhPC) carbon-long acyl chains in the electrophysiology experiments. The hydrocarbon in the bilayers may also be modifying some effects of alcohol. In monoolein/n-hexadecane bilayers, 1-heptanol through 1-decanol decrease and 1-undecanol through 1-hexadecanol increase bilayer capacitance (22). In monoolein/squalane (or squalene) bilayers, the shorter alcohols increase the capacitance, peaking at alcohol chain lengths of ∼8. This effect decreases at longer chain lengths: at chain lengths ≥ 14, the capacitance decreases below control values (22). Finol-Urdaneta et al. (23) reported no change in bilayer capacitance with ethanol, 1-propanol, and 1-butanol in 1-palmitoyl-2-oleoyl phosphatidylethanolamine/phosphatidylglycerol (PE/PG)/n-decane bilayers or 1-heptanol in PE/PG/hexadecane bilayers. The bilayer-modifying propensity of an alcohol depends on both the alcohol and the composition of the bilayer (including any hydrocarbon) in question.
The effects of alcohols also have been found to vary with the bilayer environment in other systems: Ethanol's potentiation of BKCa channels activity displayed a gradual decrease in thicker bilayers (14–24 carbon phosphatidylcholine-containing bilayers), and ethanol reduced channel activity in sphingomyelin-containing bilayers (64). Ethanol, 1-butanol, and 1-hexanol promoted the formation of rhodopsin MII, whereas 1-octanol and 1-decanol inhibited MII formation, with lower potency (in either direction) in 1-palmitoyl-2-oleoylphosphatidylcholine vesicles than in 1-palmitoyl-2-docosahexaenoylphosphatidylcholine vesicles (5).
Alcohol's effects also depend on the protein/system
Fig. 6 shows a comparison of straight-chain alcohols' potency in a few systems that were selected to test the effects of a series of straight-chain alcohols and quantify their potency (the definition of potency depends on the system in question; see legend to Fig. 6). Systems with biphasic alcohol effects were excluded; for example, short- to medium-chain alcohols potentiate acetylcholine-mediated response in oocytes, whereas medium- to long-chain alcohols inhibit the response (28), and short- and medium-chain alcohols stabilize rhodopsin MII, whereas long-chain alcohols stabilize rhodopsin MI (5). For short-chain alcohols, the effects of alcohol scale equally with increasing chain length, reflecting their increased hydrophobicity. At a certain alcohol chain length, depending on the system, further increases in alcohol chain length do not increase the potency as much, and may even reduce potency, leading to an effective alcohol cutoff. In some systems the effects of alcohol can even reverse, demonstrating that such effects depend on the system (i.e., protein and bilayer environment) in question.
Figure 6.
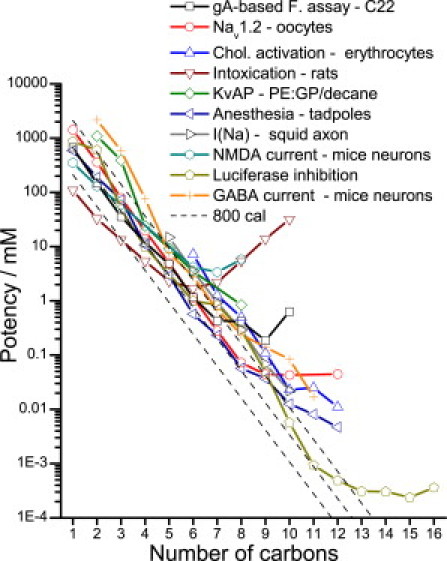
Potency of straight-chain alcohols in different systems. An alcohol's potency is defined differently depending on the system, as follows: D for the gA-based fluorescence assay in DC22:1PC lipid vesicles (boxes); IC50 inhibition of Nav1.2 sodium current in oocytes (65) (circles); cholesterol activation measured as the concentration that promotes hemolysis of red blood cells in a cholesterol oxidase assay (66) (up triangles); ED3 is the injected dose required (in mmole/kg, not mM) to produce ataxia 2 behavior (as described by Majchrowicz (67)) for intoxication in rats (56) (down triangles); IC67% reduction in unitary conductance of KvAP channels reconstituted in PE:GP/n-decane planar bilayers (23) (diamonds); anesthesia ED50 as determined by the loss of righting reflex of tadpoles (68) (left triangles); 50% suppression of peak inward current in voltage-clamped intact giant squid axons (69) (right triangles); EC50 inhibition of NMDA-induced current in mice hippocampus neurons (70) (hexagons); ED50 50% reduction of luciferase fluorescence in buffer (27) (pentagons); and EC50 potentiation of GABA-induced current in mice hippocampus neurons (71) (crosses). The dashed lines have slopes of 0.59 log units representing 800 cal/mole per –CH2 group.
Conclusions
Alcohols display a cutoff in a system (gA channels) with no alcohol-binding pocket or steric hindrances, demonstrating that the bilayer-mediated effects of alcohol are more complex than previously thought. Therefore, the presence of an alcohol cutoff does not necessarily provide evidence for a direct protein-alcohol interaction (i.e., the existence of an alcohol-binding site).
The alcohols examined in this study altered the lipid bilayer properties, as measured with a gA-based florescence assay, at concentrations equal to or higher than those reported to cause intoxication (56), similar to those reported to affect various membrane proteins (32), and below those that cause anesthesia (3). This suggests that the biological actions of alcohol likely arise from a combination of specific membrane protein-alcohol interactions, as well as alcohol-induced changes in membrane properties.
Acknowledgments
The authors thank Roger E. Koeppe II and Denise V. Greathouse for generously supplying the gA−(13), and Ruchi Kapoor, Kevin Lum, Radda Rusinova, Jon T. Sack, and R. Lea Sanford for stimulating discussions.
This work was supported by grants from the National Institutes of Health (R01GM021342 and American Recovery and Reinvestment Act supplement GM021342-35S1 to O.S.A.).
Contributor Information
Helgi I. Ingólfsson, Email: hei2001@med.cornell.edu.
Olaf S. Andersen, Email: sparre@med.cornell.edu.
Supporting Material
References
- 1.Meyer H. Zur Theorie der Alkoholnarkose. Naunyn Schmiedebergs Arch. Pharmacol. 1901;46:338–346. [Google Scholar]
- 2.Overton C.E. Gustav Fischer; Jena, Germany: 1901. Studien über die Narkose zugleich ein Beitrag zur allgemeinen Pharmakologie. [Google Scholar]
- 3.Seeman P. The membrane actions of anesthetics and tranquilizers. Pharmacol. Rev. 1972;24:583–655. [PubMed] [Google Scholar]
- 4.Mullins L.J. Viewing anesthesia research 1954–1990. Ann. N. Y. Acad. Sci. 1991;625:841–844. doi: 10.1111/j.1749-6632.1991.tb33932.x. [DOI] [PubMed] [Google Scholar]
- 5.Mitchell D.C., Lawrence J.T., Litman B.J. Primary alcohols modulate the activation of the G protein-coupled receptor rhodopsin by a lipid-mediated mechanism. J. Biol. Chem. 1996;271:19033–19036. doi: 10.1074/jbc.271.32.19033. [DOI] [PubMed] [Google Scholar]
- 6.Aagaard T.H., Kristensen M.N., Westh P. Packing properties of 1-alkanols and alkanes in a phospholipid membrane. Biophys. Chem. 2006;119:61–68. doi: 10.1016/j.bpc.2005.09.003. [DOI] [PubMed] [Google Scholar]
- 7.Chin J.H., Goldstein D.B. Effects of low concentrations of ethanol on the fluidity of spin-labeled erythrocyte and brain membranes. Mol. Pharmacol. 1977;13:435–441. [PubMed] [Google Scholar]
- 8.Lyon R.C., McComb J.A., Goldstein D.B. A relationship between alcohol intoxication and the disordering of brain membranes by a series of short-chain alcohols. J. Pharmacol. Exp. Ther. 1981;218:669–675. [PubMed] [Google Scholar]
- 9.Pringle M.J., Brown K.B., Miller K.W. Can the lipid theories of anesthesia account for the cutoff in anesthetic potency in homologous series of alcohols? Mol. Pharmacol. 1981;19:49–55. [PubMed] [Google Scholar]
- 10.Treistman S.N., Martin G.E. BK Channels: mediators and models for alcohol tolerance. Trends Neurosci. 2009;32:629–637. doi: 10.1016/j.tins.2009.08.001. [DOI] [PMC free article] [PubMed] [Google Scholar]
- 11.Wieslander A., Rilfors L., Lindblom G. Metabolic changes of membrane lipid composition in Acholeplasma laidlawii by hydrocarbons, alcohols, and detergents: arguments for effects on lipid packing. Biochemistry. 1986;25:7511–7517. doi: 10.1021/bi00371a038. [DOI] [PubMed] [Google Scholar]
- 12.Ly H.V., Longo M.L. The influence of short-chain alcohols on interfacial tension, mechanical properties, area/molecule, and permeability of fluid lipid bilayers. Biophys. J. 2004;87:1013–1033. doi: 10.1529/biophysj.103.034280. [DOI] [PMC free article] [PubMed] [Google Scholar]
- 13.Ho C., Stubbs C.D. Effect of n-alkanols on lipid bilayer hydration. Biochemistry. 1997;36:10630–10637. doi: 10.1021/bi9703150. [DOI] [PubMed] [Google Scholar]
- 14.Bangham A.D., Standish M.M., Miller N. Cation permeability of phospholipid model membranes: effect of narcotics. Nature. 1965;208:1295–1297. doi: 10.1038/2081295a0. [DOI] [PubMed] [Google Scholar]
- 15.Gutknecht J., Tosteson D.C. Ionic peremability of thin lipid membranes. Effects of n-alkyl alcohols, polyvalent cations, and a secondary amine. J. Gen. Physiol. 1970;55:359–374. doi: 10.1085/jgp.55.3.359. [DOI] [PMC free article] [PubMed] [Google Scholar]
- 16.Griepernau B., Böckmann R.A. The influence of 1-alkanols and external pressure on the lateral pressure profiles of lipid bilayers. Biophys. J. 2008;95:5766–5778. doi: 10.1529/biophysj.108.142125. [DOI] [PMC free article] [PubMed] [Google Scholar]
- 17.Terama E., Ollila O.H., Vattulainen I. Influence of ethanol on lipid membranes: from lateral pressure profiles to dynamics and partitioning. J. Phys. Chem. B. 2008;112:4131–4139. doi: 10.1021/jp0750811. [DOI] [PubMed] [Google Scholar]
- 18.Westerman P.W., Pope J.M., Dubro D.W. The interaction of n-alkanols with lipid bilayer membranes: a 2H-NMR study. Biochim. Biophys. Acta. 1988;939:64–78. doi: 10.1016/0005-2736(88)90048-x. [DOI] [PubMed] [Google Scholar]
- 19.Hornby A.P., Cullis P.R. Influence of local and neutral anaesthetics on the polymorphic phase preferences of egg yolk phosphatidylethanolamine. Biochim. Biophys. Acta. 1981;647:285–292. doi: 10.1016/0005-2736(81)90256-x. [DOI] [PubMed] [Google Scholar]
- 20.Lohner K. Effects of small organic molecules on phospholipid phase transitions. Chem. Phys. Lipids. 1991;57:341–362. doi: 10.1016/0009-3084(91)90085-p. [DOI] [PubMed] [Google Scholar]
- 21.Hunt G.R., Kaszuba M. The effect of n-alcohols on vesicular permeability induced at the lipid phase transition temperature: a 1H-NMR study. Chem. Phys. Lipids. 1989;51:55–65. doi: 10.1016/0009-3084(89)90066-2. [DOI] [PubMed] [Google Scholar]
- 22.Elliott J.R., Haydon D.A. The influence of n-alkanols on the capacity per unit area of planar lipid bilayers. Biochim. Biophys. Acta. 1984;773:165–168. doi: 10.1016/0005-2736(84)90561-3. [DOI] [PubMed] [Google Scholar]
- 23.Finol-Urdaneta R.K., McArthur J.R., Morris C.E. Modulation of KvAP unitary conductance and gating by 1-alkanols and other surface active agents. Biophys. J. 2010;98:762–772. doi: 10.1016/j.bpj.2009.10.053. [DOI] [PMC free article] [PubMed] [Google Scholar]
- 24.Ferguson J. The use of chemical potentials as indices of toxicity. Proc. R. Soc. Lond. B Biol. Sci. 1939;127:387–404. [Google Scholar]
- 25.Ferguson J., Pirie H. The toxicity of vapours to the grain weevil. Ann. Appl. Biol. 1948;35:532–550. [Google Scholar]
- 26.Janoff A.S., Pringle M.J., Miller K.W. Correlation of general anesthetic potency with solubility in membranes. Biochim. Biophys. Acta. 1981;649:125–128. doi: 10.1016/0005-2736(81)90017-1. [DOI] [PubMed] [Google Scholar]
- 27.Franks N.P., Lieb W.R. Mapping of general anaesthetic target sites provides a molecular basis for cutoff effects. Nature. 1985;316:349–351. doi: 10.1038/316349a0. [DOI] [PubMed] [Google Scholar]
- 28.Godden E.L., Harris R.A., Dunwiddie T.V. Correlation between molecular volume and effects of n-alcohols on human neuronal nicotinic acetylcholine receptors expressed in Xenopus oocytes. J. Pharmacol. Exp. Ther. 2001;296:716–722. [PubMed] [Google Scholar]
- 29.Kubo I., Muroi H., Kubo A. Structural functions of antimicrobial long-chain alcohols and phenols. Bioorg. Med. Chem. 1995;3:873–880. doi: 10.1016/0968-0896(95)00081-q. [DOI] [PubMed] [Google Scholar]
- 30.Eckenhoff R.G., Tanner J.W., Johansson J.S. Steric hindrance is not required for n-alkanol cutoff in soluble proteins. Mol. Pharmacol. 1999;56:414–418. doi: 10.1124/mol.56.2.414. [DOI] [PubMed] [Google Scholar]
- 31.Griepernau B., Leis S., Böckmann R.A. 1-Alkanols and membranes: a story of attraction. Biochim. Biophys. Acta. 2007;1768:2899–2913. doi: 10.1016/j.bbamem.2007.08.002. [DOI] [PubMed] [Google Scholar]
- 32.Dopico A.M., Lovinger D.M. Acute alcohol action and desensitization of ligand-gated ion channels. Pharmacol. Rev. 2009;61:98–114. doi: 10.1124/pr.108.000430. [DOI] [PMC free article] [PubMed] [Google Scholar]
- 33.Forman S.A., Zhou Q. Nicotinic receptor pore mutations create a sensitive inhibitory site for ethanol. Alcohol. Clin. Exp. Res. 2000;24:1363–1368. [PubMed] [Google Scholar]
- 34.Harris T., Graber A.R., Covarrubias M. Allosteric modulation of a neuronal K+ channel by 1-alkanols is linked to a key residue in the activation gate. Am. J. Physiol. Cell Physiol. 2003;285:C788–C796. doi: 10.1152/ajpcell.00113.2003. [DOI] [PubMed] [Google Scholar]
- 35.Bucci B.K., Kruse S.W., Jones D.N. Effect of n-alcohols on the structure and stability of the Drosophila odorant binding protein LUSH. Biochemistry. 2006;45:1693–1701. doi: 10.1021/bi0516576. [DOI] [PubMed] [Google Scholar]
- 36.Aryal P., Dvir H., Slesinger P.A. A discrete alcohol pocket involved in GIRK channel activation. Nat. Neurosci. 2009;12:988–995. doi: 10.1038/nn.2358. [DOI] [PMC free article] [PubMed] [Google Scholar]
- 37.Ingólfsson H.I., Andersen O.S. Screening for small molecules' bilayer-modifying potential using a gramicidin-based fluorescence assay. Assay Drug Dev. Technol. 2010;8:427–436. doi: 10.1089/adt.2009.0250. [DOI] [PMC free article] [PubMed] [Google Scholar]
- 38.Ingólfsson H.I., Sanford R.L., Kapoor R., Andersen O.S. Gramicidin-based fluorescence assay; for determining small molecules potential for modifying lipid bilayer properties. J. Vis. Exp. 2010;44 doi: 10.3791/2131. http://www.jove.com/details.php?id=2131 [DOI] [PMC free article] [PubMed] [Google Scholar]
- 39.O'Connell A.M., Koeppe R.E., 2nd, Andersen O.S. Kinetics of gramicidin channel formation in lipid bilayers: transmembrane monomer association. Science. 1990;250:1256–1259. doi: 10.1126/science.1700867. [DOI] [PubMed] [Google Scholar]
- 40.Andersen O.S., Nielsen C., Koeppe R.E., 2nd Ion channels as tools to monitor lipid bilayer-membrane protein interactions: gramicidin channels as molecular force transducers. Methods Enzymol. 1999;294:208–224. doi: 10.1016/s0076-6879(99)94013-2. [DOI] [PubMed] [Google Scholar]
- 41.Harroun T.A., Heller W.T., Huang H.W. Experimental evidence for hydrophobic matching and membrane-mediated interactions in lipid bilayers containing gramicidin. Biophys. J. 1999;76:937–945. doi: 10.1016/S0006-3495(99)77257-7. [DOI] [PMC free article] [PubMed] [Google Scholar]
- 42.Andersen O.S., Bruno M.J., Koeppe R.E., 2nd Single-molecule methods for monitoring changes in bilayer elastic properties. Methods Mol. Biol. 2007;400:543–570. doi: 10.1007/978-1-59745-519-0_37. [DOI] [PubMed] [Google Scholar]
- 43.Lundbaek J.A., Koeppe R.E., 2nd, Andersen O.S. Amphiphile regulation of ion channel function by changes in the bilayer spring constant. Proc. Natl. Acad. Sci. USA. 2010;107:15427–15430. doi: 10.1073/pnas.1007455107. [DOI] [PMC free article] [PubMed] [Google Scholar]
- 44.Reference deleted in proof.
- 45.Lundbaek J.A., Collingwood S.A., Andersen O.S. Lipid bilayer regulation of membrane protein function: gramicidin channels as molecular force probes. J. R. Soc. Interface. 2010;7:373–395. doi: 10.1098/rsif.2009.0443. [DOI] [PMC free article] [PubMed] [Google Scholar]
- 46.Greathouse D.V., Koeppe R.E., 2nd, Andersen O.S. Design and characterization of gramicidin channels. Methods Enzymol. 1999;294:525–550. doi: 10.1016/s0076-6879(99)94031-4. [DOI] [PubMed] [Google Scholar]
- 47.Neher E. Ionic specificity of the gramicidin channel and the thallous ion. Biochim. Biophys. Acta. 1975;401:540–544. [Google Scholar]
- 48.Andersen O.S. Ion transport across simple membranes. In: Giebisch G.H., Purcell E., editors. Renal Function. Independent Publishers Group; Port Washington, NY: 1978. pp. 71–99. [Google Scholar]
- 49.Schneider H. The intramembrane location of alcohol anesthetics. Biochim. Biophys. Acta. 1968;163:451–458. doi: 10.1016/0005-2736(68)90074-6. [DOI] [PubMed] [Google Scholar]
- 50.Smith R., Tanford C. Hydrophobicity of long chain n-alkyl carboxylic acids, as measured by their distribution between heptane and aqueous solutions. Proc. Natl. Acad. Sci. USA. 1973;70:289–293. doi: 10.1073/pnas.70.2.289. [DOI] [PMC free article] [PubMed] [Google Scholar]
- 51.Jain M.K., Wu N.M. Effect of small molecules on the dipalmitoyl lecithin liposomal bilayer: III. Phase transition in lipid bilayer. J. Membr. Biol. 1977;34:157–201. [Google Scholar]
- 52.Kamaya H., Kaneshina S., Ueda I. Partition equilibrium of inhalation anesthetics and alcohols between water and membranes of phospholipids with varying acyl chain-lengths. Biochim. Biophys. Acta. 1981;646:135–142. doi: 10.1016/0005-2736(81)90280-7. [DOI] [PubMed] [Google Scholar]
- 53.Franks N.P., Lieb W.R. Partitioning of long-chain alcohols into lipid bilayers: implications for mechanisms of general anesthesia. Proc. Natl. Acad. Sci. USA. 1986;83:5116–5120. doi: 10.1073/pnas.83.14.5116. [DOI] [PMC free article] [PubMed] [Google Scholar]
- 54.Petrauskas A., Kolovanov E. ACD/Log P method description. Perspect. Drug Discov. Des. 2000;19:99–116. [Google Scholar]
- 55.Leo A., Hansch C., Elkins D. Partition coefficients and their uses. Chem. Rev. 1971;71:525–616. [Google Scholar]
- 56.McCreery M.J., Hunt W.A. Physico-chemical correlates of alcohol intoxication. Neuropharmacology. 1978;17:451–461. doi: 10.1016/0028-3908(78)90050-3. [DOI] [PubMed] [Google Scholar]
- 57.Abraham M.H., Chadha H.S., Mitchell R.C. Hydrogen bonding. 32. An analysis of water-octanol and water-alkane partitioning and the δ log P parameter of seiler. J. Pharm. Sci. 1994;83:1085–1100. doi: 10.1002/jps.2600830806. [DOI] [PubMed] [Google Scholar]
- 58.Seydel J.K. Octanol-water partitioning versus partitioning into membranes. In: Seydel J.K., Wiese M., editors. Drug-Membrane Interaction. Wiley-VCH; Darmstadt, Germany: 2002. pp. 39–50. [Google Scholar]
- 59.Kyoji K., Ishikawa H., Shinoda K. Solubility of alcohols in water determined the surface tension measurements. Bull. Chem. Soc. Jpn. 1958;31:1081–1082. [Google Scholar]
- 60.Barry J.A., Gawrisch K. Direct NMR evidence for ethanol binding to the lipid-water interface of phospholipid bilayers. Biochemistry. 1994;33:8082–8088. doi: 10.1021/bi00192a013. [DOI] [PubMed] [Google Scholar]
- 61.Pope C.G., Urban B.W., Haydon D.A. The influence of n-alkanols and cholesterol on the duration and conductance of gramicidin single channels in monoolein bilayers. Biochim. Biophys. Acta. 1982;688:279–283. doi: 10.1016/0005-2736(82)90605-8. [DOI] [PubMed] [Google Scholar]
- 62.Laskey A.D. Kalamazoo College; Kalamazoo, MI: 1995. Bridging Theories of General Anesthesia: Pentobarbital and n-Alcohols Alter the Kinetics of Gramicidin A Channel Formation in Planar Bilayers. 41. [Google Scholar]
- 63.Sawyer D.B., Koeppe R.E., 2nd, Andersen O.S. Gramicidin single-channel properties show no solvent-history dependence. Biophys. J. 1990;57:515–523. doi: 10.1016/S0006-3495(90)82567-4. [DOI] [PMC free article] [PubMed] [Google Scholar]
- 64.Yuan C., O'Connell R.J., Treistman S.N. Regulation of the gating of BKCa channel by lipid bilayer thickness. J. Biol. Chem. 2007;282:7276–7286. doi: 10.1074/jbc.M607593200. [DOI] [PubMed] [Google Scholar]
- 65.Horishita T., Harris R.A. n-Alcohols inhibit voltage-gated Na+ channels expressed in Xenopus oocytes. J. Pharmacol. Exp. Ther. 2008;326:270–277. doi: 10.1124/jpet.108.138370. [DOI] [PMC free article] [PubMed] [Google Scholar]
- 66.Lange Y., Ye J., Steck T.L. Activation of membrane cholesterol by 63 amphipaths. Biochemistry. 2009;48:8505–8515. doi: 10.1021/bi900951r. [DOI] [PMC free article] [PubMed] [Google Scholar]
- 67.Majchrowicz E. Induction of physical dependence upon ethanol and the associated behavioral changes in rats. Psychopharmacology (Berl.) 1975;43:245–254. doi: 10.1007/BF00429258. [DOI] [PubMed] [Google Scholar]
- 68.Alifimoff J.K., Firestone L.L., Miller K.W. Anaesthetic potencies of primary alkanols: implications for the molecular dimensions of the anaesthetic site. Br. J. Pharmacol. 1989;96:9–16. doi: 10.1111/j.1476-5381.1989.tb11777.x. [DOI] [PMC free article] [PubMed] [Google Scholar]
- 69.Haydon D.A., Urban B.W. The action of alcohols and other non-ionic surface active substances on the sodium current of the squid giant axon. J. Physiol. 1983;341:411–427. doi: 10.1113/jphysiol.1983.sp014813. [DOI] [PMC free article] [PubMed] [Google Scholar]
- 70.Peoples R.W., Weight F.F. Cutoff in potency implicates alcohol inhibition of N-methyl-D-aspartate receptors in alcohol intoxication. Proc. Natl. Acad. Sci. USA. 1995;92:2825–2829. doi: 10.1073/pnas.92.7.2825. [DOI] [PMC free article] [PubMed] [Google Scholar]
- 71.Peoples R.W., Weight F.F. Differential alcohol modulation of GABA(A) and NMDA receptors. Neuroreport. 1999;10:97–101. doi: 10.1097/00001756-199901180-00019. [DOI] [PubMed] [Google Scholar]
Associated Data
This section collects any data citations, data availability statements, or supplementary materials included in this article.