

Abstract
Apolipoprotein A-I plays a central role in the solution structure of high-density lipoproteins. Determining the stoichiometry of lipid-bound apo A-I in the hydrated state is therefore fundamental to understanding how high-density lipoproteins form and function. Here, we use the quantum optical phenomenon of photon antibunching to determine the number of apo A-I molecules bound to discoidal lipoproteins and compare this with values obtained by photon-counting histogram analysis. Both the photon antibunching and photon-counting analyses show that reconstituted high-density lipoprotein particles contain two apo A-I molecules, which is in agreement with the commonly accepted double-belt model.
Introduction
Apolipoprotein (apo) A-I is the major protein found in high-density lipoproteins (HDL) and plays a central role in the structure and metabolism of HDL particles. HDL (a.k.a. good cholesterol) protects against atherosclerosis by carrying out reverse cholesterol transport, which delivers cholesterol from tissues to the liver for excretion, and also through its antiinflammatory properties (1,2). One can reconstitute HDL in vitro with high reproducibility using a spontaneous reaction of apo A-I with lipids. Reconstituted HDL (rHDL), also commonly referred to as a lipid nanodisc, is a discoidal complex that has been shown to exist in different discrete sizes ranging from 7 to 15 nm. Because the lipid structure of rHDL consists of a lamellar bilayer, it essentially provides a platform that mimics a nanoscale, isolated patch of cell membrane (supported by the apolipoproteins). Such constructs have recently been used to reconstitute a variety of membrane proteins in a soluble colloidal particle, including cytochrome P450 and bacteriorhodopsin (3–5). These properties provide improved sample dispersion, characterization, and homogeneity, facilitating the biophysical and biochemical examination of isolated, functional membrane proteins (6,7). rHDL may also be a suitable alternative to liposomes as targeted drug transport vehicles (8,9). Due to the highly dynamic nature of the apolipoprotein-lipid interaction, many basic properties (e.g., their specific hydrated shape in solution and the precise conformation of the apolipoproteins surrounding the particles) are still uncertain. However, on the basis of multiple lines of evidence, it is widely assumed that a single rHDL particle contains two molecules of apo A-I that circumscribe the perimeter of a disk-shaped lipid bilayer in a belt-like conformation (10–14). Here, we utilize a quantum optical property of single fluorescent molecules to test the hypothesis that rHDL contains two apo A-I in the hydrated state, which is difficult to determine with (and might be masked by) bulk averaging analysis techniques.
Photon antibunching was first observed in the late 1970s from resonance fluorescence of sodium atoms in atomic beams (15). Shortly afterward, photon antibunching was revealed by single fluorescent dyes trapped in a solid at low temperature (16). Thanks to advances in laser technology and detectors, it is now possible to observe antibunching at room temperature from fluorescent dyes (17–19). Recently, it was shown that this phenomenon can also be used as an extremely powerful technique to count independent emitters in biomolecules. Fore et al. (20) demonstrated this by using antibunching to distinguish among singly, doubly, and triply fluorescently labeled DNA oligonucleotides, and Sýkora et al. (21) applied this approach to study protein conformation in ion channels. Here, we apply photon antibunching to determine the stoichiometry of lipid-bound apo A-I and count the number of proteins per HDL particle.
Materials and Methods
Methodology
Photon antibunching exploits the fact that a single fluorescent molecule can only emit one photon at a time. In a simplified two-level energy diagram, a molecule in an excited state requires a finite amount of time before it relaxes back to the ground state, with the temporal separation between adjacent photons being determined mostly by the excited-state lifetime. This effect is known as antibunching and represents the sub-Poissonian nature of the emitted light. Only two or more molecules can emit photons simultaneously. Photon antibunching is usually performed in a Hanbury Brown-Twiss interferometer setup that equally splits the photon flux with a 50/50 beam-splitter and sends them to two detectors attached to a coincidence counter (22). The photons detected are then cross correlated between the two channels in the picosecond/nanosecond regime, in which antibunching effects occur. Two detectors are absolutely required because there are no known detectors with zero dead time. The primary objective of the Hanbury Brown-Twiss setup is to measure the coincidence of photon counts at very short time delays. Two photons detected by the two detectors, respectively, within the fluorescence lifetime of the fluorescent molecules under study are considered a coincident photon pair. By measuring the probability of detecting photon pairs as a function of time delay t between the individual photons, Ppair(t), we find that for emission from a single quantum system at time zero, Ppair(0) = 0 (e.g., a single molecule cannot emit two photons at the same time). However, at time delays greater than zero, there is a finite probability of detecting photon pairs because the same molecule is subjected to multiple excitation-emission cycles. Experimentally, this is equivalent to the measurement of the normalized second-order autocorrelation function:
| (1) |
which is defined as the probability of detecting a photon at time t given that one has already been detected at time t0. A plot of the autocorrelation function at short timescales (∼ns) gives rise to a dip at time zero, reflecting the fact that the probability for detecting a second photon within a very short time after the first one has been detected is very low (Fig. 1 A).
Figure 1.
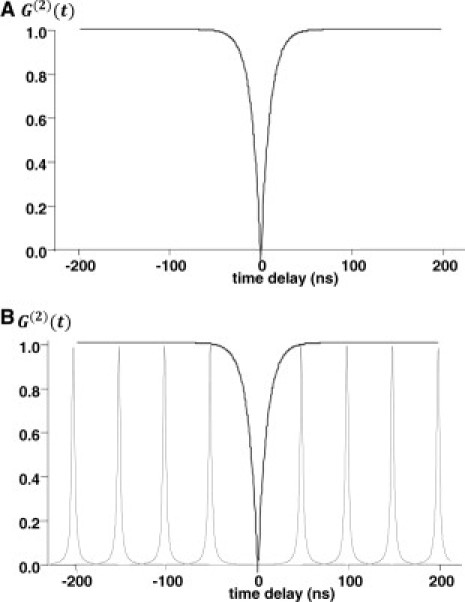
(A) Dip in the second-order autocorrelation function is from photon antibunching. Using CW excitation, the probability of detecting photon pairs lies on the curve. (B) Using a pulsed laser source, the probability of detecting photon pairs resides on the lateral peaks, with the peaks separated by 50 ns, determined by the laser repetition rate set at 20 Mhz.
Kitson et al. (23) provided a mathematical analysis of G(2)(τ) for dye molecules in solution using a semiclassical approach and taking into account the excited-state lifetime, triplet-state effects, and diffusion dynamics. However, because antibunching occurs at the nanosecond timescale, which is much shorter than the effects of molecular diffusion and triplet state shelving, this simplifies the autocorrelation function to:
| (2) |
where τ = 1/(kexc + kem) is the excited-state lifetime, with kexc being the effective excitation pump rate and kem the rate of spontaneous emission. Measurement of the autocorrelation function allows us to obtain excited-state lifetime information and determine the number of molecules that are present in a given complex.
Traditionally, photon antibunching measurements were performed with a continuous wave (CW) excitation source, but this method is not very efficient because the molecules are randomly excited and there is no control over when photon emission will occur. Because all detectors have a dead time (APD ∼50 ns; Perkin Elmer), photons that fall within this time window are lost. This drawback is mitigated by switching to a pulsed laser source.
If a laser with pulse width much less than the excited-state lifetime (typically <100 ps) is used as excitation, the probability that a single molecule will emit a photon and then immediately be reexcited by the same laser pulse is very low. Thus, if we excite all molecules within the laser focus at predefined points in time, we know exactly when to expect fluorescence photons from these molecules.
In experiments using pulsed sources, the probability of detecting photon pairs is no longer restricted to events on the curve shown in Fig. 1 A (CW excitation); rather, it resides on the lateral peaks that represent subsequent excitation cycles (Fig. 1 B). Because all coincident photon events must occur within a few nanoseconds of the laser excitation, this implies that the separation between photon peaks must be equal to the laser repetition rate, which is set at 20 Mhz. Using pulsed laser excitation, Tinnefeld et al. (19) and Sýkora et al. (21) demonstrated that photon antibunching can be used to count the number of fluorescent molecules N, using the formula
| (3) |
and measuring the area of a central photon count peak Mc, representing zero coincidence time, with respect to the area of all other lateral peaks in a photon coincidence diagram. The ratio is a measure of the probability of detecting photon pairs per laser pulse. For a single molecule, the central peak will have an area of zero (i.e., no peak), whereas a dimer will give rise to a peak of half the amplitude of the lateral peaks, a trimer will have two-thirds the amplitude of the lateral peaks, and so on.
Materials
We synthesize rHDL using a spontaneous reconstitution of apo A-I and lipid vesicles that are mixed in a 100:1 DMPC/apoA-I molar ratio as described previously (24). Before reconstitution is performed, site-specific mutagenesis is used to express a clone of apo A-I containing a single cysteine at position 55. Of importance, we have shown that this Ser55->Cys substitution does not affect the folding or lipid-binding properties of the modified apoA-I relative to the native protein (25). This apo A-I clone is then reacted with Alexa647-maleimide derivatives via sulfhydryl-maleimide chemistry and subsequent purification in a separation column to result in fluorescently labeled apo A-I, each molecule of which carries just a single fluorophore. For accurate stoichiometry measurements, we further purify the rHDL complex using HPLC to eliminate unbound proteins and lipids, and to select a fraction that corresponds to 150 kDa, which represents the typical molecular mass of rHDL.
Instrumentation
We conduct our experiments with a MicroTime 200 confocal fluorescence spectroscopy system (PicoQuant GmbH, Berlin, Germany) equipped with a pulsed diode laser (640 nm wavelength, 80 ps pulse width, 20 Mhz repetition rate). The laser is focused through an Olympus 1.45 NA 100× oil objective to a diffraction-limited spot of ∼250 nm diameter at a height of 5 μm above a glass coverslip surface. The laser power is 30 μw at the sample. The emission is split by a 50/50 beam-splitter and directed to two avalanche photodiode detectors (SPCM-AQR-14; PerkinElmer, Waltham, MA). Photoelectron pulses from the detectors are used as start-stop signals for time-correlated single-photon counting (TCSPC) electronics (Picoharp 300, PicoQuant GmbH, Berlin, Germany). The PicoHarp 300 records the photon arrival time from the last excitation pulse (microtime) with 50 ps time resolution, and the arrival time from the start of the experiment (macrotime) with 50 ns time resolution.
Results and Discussion
To ensure the acquisition of single-molecule statistics, the concentration of lipid-bound apo A-I is diluted to a final concentration below 1 nM. This low concentration ensures a high probability that only one particle will be present in the detection volume at any given point in time. To verify this, we measured freely diffusing particles in phosphate-buffered saline using fluorescence correlation spectroscopy (FCS). The amplitude of the autocorrelation curve G(0) is inversely proportional to the average number of particles, n, in the laser excitation volume. Using G(0) ≈ 13, we calculated a value n ≈ 1/G(0) ≈ 0.08 (Fig. 2 A), indicating that on average there was only one particle present within the detection volume. Using FCS, we measured an average diffusion time of 600 ± 25 μs over multiple measurements, corresponding to a diffusion coefficient of 26 ± 1 μm2/s. The hydrodynamic radius of the rHDL is calculated to be 9.3 ± 0.4 nm via the Stokes-Einstein equation, D = KT/(6πnRH), but one should keep in mind that the shape of these particles is likely not spherical, as is assumed for this model.
Figure 2.
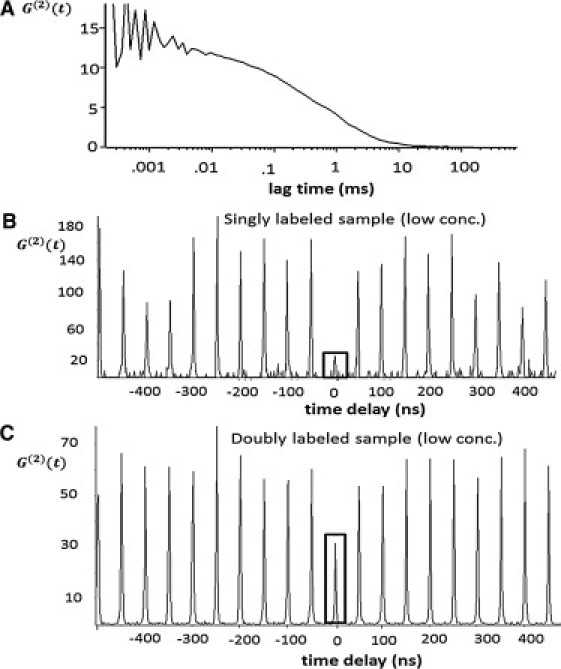
Photon antibunching histograms of lipid-bound apoA-I at low concentration (<1 nM). The central peak is highlighted by a box. (A) FCS autocorrelation with G(0) ≈ 13, which gives N = 1/G(0) ≈ 0.08, indicating a low probability of detecting more than one particle in the laser excitation volume. (B) The singly labeled (control) sample shows a very small central peak due to single-molecule emission. (C) The doubly labeled sample (of interest) has a central peak with approximately half the area of the lateral peaks, which is indicative of two protein molecules being present in the sample at any time.
For the photon antibunching analysis, we performed a total of eight measurements (10 min each) for lipid-bound apoA-I in phosphate-buffered saline diffusing through the laser excitation volume. We obtained a control sample using a 10:1 (unlabeled/labeled) apo A-I ratio. The apo A-I was then reconstituted with lipid vesicles to form discs that contained mostly unlabeled lipid-bound apo A-I. A small fraction contained one label. This control sample is referred to as singly labeled. In principle, the singly labeled control sample is equivalent to a single quantum emitter and should register no antibunching peak at time zero. However, even with a 10:1 unlabeled/labeled ratio, there is a finite chance of having two labeled apoA-I proteins on the same disc. If the chance of a protein being labeled is p = 1/11, the fraction of discs with two labeled proteins is p/{2(1 − p)} = 0.05.
The fraction of the singly labeled sample that contains two labeled proteins leads to a finite, nonzero antibunching peak at time zero. If there are two species in the solution with concentrations n1 and n2, molecular brightness values of ε1 and ε2, and one-molecule correlation functions f1(t) and f2(t), the total correlation function is given by (21):
| (4) |
For our case, with n2 = 0.05n1, and ε2 = 2ε1, the contribution of f2(t) will be 20% of the correlation amplitude. The peak at time zero has 50% of the amplitude of the other peaks for f2(t), and 0% for f1(t). For the mixture, the peak at time zero is predicted to have 10% of the amplitude of the other peaks. This corresponds to a predicted value of N = 1.1 for the measurement. Hence, for the singly labeled sample, we expect a value of 1.1.
In our experiment, the central peak is initially offset by 100 ns, which is a result of an electrical cable delay between the two channel inputs of the PicoHarp. This offset was compensated for in the histograms in Fig. 2, where the central peak is now located at time zero.
For the singly labeled control sample, we determined a value of , which gives N = 1.19 ± 0.10 (Fig. 2 B). This value deviates from a true single-molecule value of one due to background contributions from scattering and the finite probability of detecting more than one HDL particle in the excitation volume. In contrast, for the actual sample of interest, which we will call doubly labeled, we determined a value of , which gives N = 2.10 ± 0.19 for rHDL. This is in excellent agreement with the value of two apoA-I, assuming that two proteins are bound to the lipids in the commonly accepted double-belt conformation (Fig. 2 C). These values are summarized in Table 1.
Table 1.
Low-concentration sample
| Low-concentration sample | Mc | N | ||||
|---|---|---|---|---|---|---|
| Singly labeled | 34.17 | 210.13 | 0.15 | 1.19 ± 0.10 | ||
| Doubly labeled | 71.90 | 135.30 | 0.52 | 2.10 ± 0.19 |
Number of molecules N in a low-concentration sample is determined by calculating the ratio . The values given are arbitrary units averaged over eight measurements.
Photon antibunching spectroscopy is usually performed with very-low-concentration samples, such that the probability of detecting a particle in the excitation volume is less than one. If the excitation volume contains more than one particle, and each particle is labeled with more than one fluorophore, one can still extract the absolute number of fluorophores per particle. This requires subtraction of the correlation values at very long lag times, Minfinity, which we obtain by calculating the correlations with fine spacing at 50 ms lag time using the algorithm described by Laurence et al. (26). Taking this into account, the number of fluorophores in a complex can be extracted by:
| (5) |
This formula is a restatement of Eq. 3 of Tinnefeld et al. (19) and Sýkora et al. (21). Instead of fitting a functional form, we integrate over the entire correlation peaks. We demonstrate this by repeating the above experiments using a high-concentration sample in which the probability of detecting more than one particle per excitation volume is greater than one. We determine this by analyzing the amplitude of the autocorrelation G(0) = 1/n from FCS measurements. The antibunching peaks for the high-concentration sample are shown in Fig. 3. For the singly and doubly labeled samples, we determine values of N = 1.26 ± 0.15 and N = 1.92 ± 0.12, respectively, over eight separate measurements of 10 min each. These values are summarized in Table 2.
Figure 3.
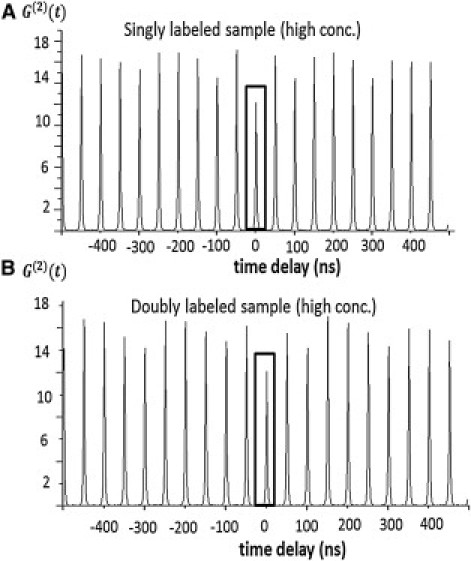
Photon antibunching histograms of lipid-bound apoA-I at high concentration from singly labeled (A) and doubly labeled (B) samples. The central peak is highlighted by a box.
Table 2.
High-concentration sample
| High-concentration sample | Mc | Minfinity | N | ||||
|---|---|---|---|---|---|---|---|
| Singly labeled | 17.5 | 21.2 | 14.06 | 0.48 | 1.26 ± 0.15 | ||
| Doubly labeled | 15.2 | 20.8 | 13.4 | 0.19 | 1.92 ± 0.12 |
Number of molecules N is determined by using a modified ratio of , which accounts for the correlation at long lag times, Minfinity.
Our finding that there are two apo A-I molecules in rHDL in solution is an important confirmation of previous results obtained from protein cross-linking experiments (27). However, cross-linking experiments require the introduction of covalent interactions that can alter the inherent dynamic properties of the protein. In addition, the use of cross-linkers may lead one to select interactions based on local reactivity, and therefore to trap interactions that may not be the most prevalent under physiological conditions. Although our results show that there are two apo A-I molecules per particle, this does not prove that the two monomers are bound together to form a dimer, nor do they provide information about the conformational state of apo A-I. However, they do lend support to the double-belt model for nascent HDL.
Using these measurements, we were able to determine that the sample was homogeneous, i.e., that most or nearly all of the rHDL particles contained two apo A-I proteins. From a technological point of view, the ability to directly verify the stoichiometry and homogeneity of rHDL particles in solution will enable quantitative assessment of rHDL, which is increasingly being exploited for diverse biomedical applications.
Comparison with PCH
Here we compare photon antibunching spectroscopy with the photon-counting histogram (PCH) method as an alternative way to count the number of apoA-I molecules on the disc. Other, related methods, including fluorescence-intensity distribution analysis (28) and photon arrival-time interval distribution (29), may also be used for similar analysis; however, the PCH methodology was the simplest to implement. PCH distinguishes different species based on the amplitude fluctuations of the photons and not their temporal behavior as in the photon antibunching analysis. The most important parameter in PCH is the molecular brightness (photons/s/molecule). Because the time-tagged time-resolved data format in the PicoHarp 300 stores the microtime and macrotime, we also used photons recorded for antibunching histogram for the PCH analysis on the singly labeled (control) and doubly labeled samples. In principle, the doubly labeled sample should give twice the molecular brightness compared with the singly labeled case if the laser power is kept constant. We fit the photon probability distribution to a model as described by Chen et al. (30) using a 3D Gaussian point-spread function. The two parameters in the fit were the number of molecules N and the molecular brightness ε. Our data show a ratio of for the low concentration and for the high concentration (Table 3). These values are consistent with our prior photon antibunching analysis, and provide additional evidence that the lipoprotein particles contain two apoA-I molecules on the disc.
Table 3.
Molecular brightness ε determined by fitting the PCH distribution
| Sample | ε (photons/s/molecule)low concentration | ε (photons/s/molecule)high concentration |
|---|---|---|
| Singly labeled | 7407 ± 2291 | 8017 ± 1329 |
| Doubly labeled | 13,511 ± 324 | 15,979 ± 771 |
One might ask which methodology—PCH or photon antibunching—is best for determining the number of emitters on a biological molecule. The main advantage of the photon antibunching methodology is that the singly labeled control sample is not needed to quantitatively determine the number of emitters. Correlations at time zero are used to determine the absolute number of fluorophores on each biomolecule. In contrast, for PCH, the singly labeled sample is required as a reference for all other measurements. Furthermore, comparing peaks at time zero and at long lag times also allows for triplet-state effects to be quantified (21,26).
The cost of the experimental setup is frequently cited as a drawback of photon antibunching. However, the optical setup for photon antibunching is not significantly more complicated to implement than PCH. For our particular system, we use a picosecond pulsed laser (LDH 635-B; PicoQuant GmbH) for excitation and a PicoHarp 300 to record the photon arrival times. A significant portion of the cost is incurred by the PicoHarp 300, but as relatively inexpensive replacement one can use a counter-timer board (such as the PCI-6602; National Instruments, Austin, TX) as a histogrammer (26). Data stored in the counter-timer card permit a dual analysis of antibunching and PCH in one single measurement.
Another strength of the photon antibunching approach is that data analysis is simpler. The peaks on the antibunching histogram can be fitted to the area under the curve (e.g., by counting all photon pair events) and does not require complicated fitting models involving idealized detection volumes as in PCH, fluorescence-intensity distribution analysis, or photon arrival-time interval distribution. Because photon antibunching is relatively novel in terms of particle counting, determining the limit on the number of molecules that can be counted has not been well investigated. It is useful to determine singly, doubly, or triply labeled molecules, which suits our rHDL studies well because these particles are hypothesized to contain two apoA-I molecules per disc. However, the zero peak becomes more difficult to discern as the number of fluorophores, N, increases. When N > 10, the amplitude of the zero peak is almost equivalent to all lateral peaks. In this case, methods based on molecular brightness will likely perform better.
Another potential issue in photon antibunching experiments is that, at the peak at zero time difference, detecting the photons requires two labels to be excited simultaneously. If the labels are in close proximity, singlet-singlet annihilation may skew the antibunching results (21,31).
Because photon antibunching measurements depend on the second-order correlation function, the measurements are sensitive to minor, brighter species. For example, in our singly labeled sample, even though we estimated that only 5% of the labeled species contained two labels, they contributed ∼20% of the correlation signal. If bright spikes are present, it may be necessary to use techniques such as purified FCS (32) or modulation filtering (33) to remove signals from aggregates or bright species.
Conclusion
By applying the quantum optical technique of photon antibunching in this work, we were able to show that rHDL contains two molecules of apo A-I in the hydrated state. This method may be particularly valuable for elucidating the dynamic and distribution properties of apoA-I on HDL because it facilitates real-time observations of both stoichiometry and particle size. Such information is difficult to obtain directly by biochemical means. Our results provide an important verification of the generally accepted model for HDL structure in a more natural, solution environment.
Acknowledgments
We thank Dr. Nicholas Fischer, Lawrence Livermore National Laboratory (LLNL), for his help with the size exclusion chromatography.
S.L. received a Lawrence Scholarship from the Lawrence Scholarship Program of LLNL. Parts of this work were performed under the auspices of the U.S. Department of Energy through the LLNL under DE-AC52-07NA27344.
References
- 1.Lund-Katz S., Phillips M.C. High density lipoprotein structure-function and role in reverse cholesterol transport. Subcell. Biochem. 2010;51:183–227. doi: 10.1007/978-90-481-8622-8_7. [DOI] [PMC free article] [PubMed] [Google Scholar]
- 2.Murphy A.J., Chin-Dusting J.P.F., Woollard K.J., Sviridov D. The anti inflammatory effects of high density lipoproteins. Curr. Med. Chem. 2009;16:667–675. doi: 10.2174/092986709787458425. [DOI] [PubMed] [Google Scholar]
- 3.Nath A., Grinkova Y.V., Atkins W.M. Ligand binding to cytochrome P450 3A4 in phospholipid bilayer nanodiscs: the effect of model membranes. J. Biol. Chem. 2007;282:28309–28320. doi: 10.1074/jbc.M703568200. [DOI] [PubMed] [Google Scholar]
- 4.Bayburt T.H., Grinkova Y.V., Sligar S.G. Assembly of single bacteriorhodopsin trimers in bilayer nanodiscs. Arch. Biochem. Biophys. 2006;450:215–222. doi: 10.1016/j.abb.2006.03.013. [DOI] [PubMed] [Google Scholar]
- 5.Gao T., Blanchette C.D., Coleman M.A. Characterizing diffusion dynamics of a membrane protein associated with nanolipoproteins using fluorescence correlation spectroscopy. Protein Sci. 2011;20:437–447. doi: 10.1002/pro.577. [DOI] [PMC free article] [PubMed] [Google Scholar]
- 6.Zou P., McHaourab H.S. Increased sensitivity and extended range of distance measurements in spin-labeled membrane proteins: Q-band double electron-electron resonance and nanoscale bilayers. Biophys. J. 2010;98:L18–L20. doi: 10.1016/j.bpj.2009.12.4193. [DOI] [PMC free article] [PubMed] [Google Scholar]
- 7.Blanchette C.D., Segelke B.W., Sulchek T.A. Characterization and purification of polydisperse reconstituted lipoproteins and nanolipoprotein particles. Int. J. Mol. Sci. 2009;10:2958–2971. doi: 10.3390/ijms10072958. [DOI] [PMC free article] [PubMed] [Google Scholar]
- 8.Rensen P.C., de Vrueh R.L., van Berkel T.J. Recombinant lipoproteins: lipoprotein-like lipid particles for drug targeting. Adv. Drug Deliv. Rev. 2001;47:251–276. doi: 10.1016/s0169-409x(01)00109-0. [DOI] [PubMed] [Google Scholar]
- 9.Ryan R.O. Nanodisks: hydrophobic drug delivery vehicles. Expert Opin. Drug Deliv. 2008;5:343–351. doi: 10.1517/17425247.5.3.343. [DOI] [PubMed] [Google Scholar]
- 10.Segrest J.P., Jones M.K., Harvey S.C. A detailed molecular belt model for apolipoprotein A-I in discoidal high density lipoprotein. J. Biol. Chem. 1999;274:31755–31758. doi: 10.1074/jbc.274.45.31755. [DOI] [PubMed] [Google Scholar]
- 11.Tricerri M.A., Behling Agree A.K., Jonas A. Arrangement of apolipoprotein A-I in reconstituted high-density lipoprotein disks: an alternative model based on fluorescence resonance energy transfer experiments. Biochemistry. 2001;40:5065–5074. doi: 10.1021/bi002815q. [DOI] [PubMed] [Google Scholar]
- 12.Davidson W.S., Silva R.A. Apolipoprotein structural organization in high density lipoproteins: belts, bundles, hinges and hairpins. Curr. Opin. Lipidol. 2005;16:295–300. doi: 10.1097/01.mol.0000169349.38321.ad. [DOI] [PubMed] [Google Scholar]
- 13.Martin D.D.O., Budamagunta M.S., Oda M.N. Apolipoprotein A-I assumes a “looped belt” conformation on reconstituted high density lipoprotein. J. Biol. Chem. 2006;281:20418–20426. doi: 10.1074/jbc.M602077200. [DOI] [PubMed] [Google Scholar]
- 14.Koppaka V., Silvestro L., Axelsen P.H. The structure of human lipoprotein A-I. Evidence for the “belt” model. J. Biol. Chem. 1999;274:14541–14544. doi: 10.1074/jbc.274.21.14541. [DOI] [PubMed] [Google Scholar]
- 15.Kimble H.J., Dagenais M., Mandel L. Photon antibunching in resonance fluorescence. Phys. Rev. Lett. 1977;39:691. [Google Scholar]
- 16.Basché T., Moerner W.E., Orrit M., Talon H. Photon antibunching in the fluorescence of a single dye molecule trapped in a solid. Phys. Rev. Lett. 1992;69:1516–1519. doi: 10.1103/PhysRevLett.69.1516. [DOI] [PubMed] [Google Scholar]
- 17.Mets U., Widengren J., Rigler R. Application of the antibunching in dye fluorescence: measuring excitation rates in solution. Chem. Phys. 1997;218:191–198. [Google Scholar]
- 18.Patrick Ambrose W., Goodwin P.M., Keller R.A. Fluorescence photon antibunching from single molecules on a surface. Chem. Phys. Lett. 1997;269:365–370. [Google Scholar]
- 19.Tinnefeld P., Müller C., Sauer M. Time-varying photon probability distribution of individual molecules at room temperature. Chem. Phys. Lett. 2001;345:252–258. [Google Scholar]
- 20.Fore S., Laurence T.A., Hollars C., Huser T. Counting constituents in molecular complexes by fluorescence photon antibunching. IEEE J. Sel. Top. Quantum Electron. 2007;13:996–1005. [Google Scholar]
- 21.Sýkora J., Kaiser K., Enderlein J. Exploring fluorescence antibunching in solution to determine the stoichiometry of molecular complexes. Anal. Chem. 2007;79:4040–4049. doi: 10.1021/ac062024f. [DOI] [PubMed] [Google Scholar]
- 22.Hanbury Brown R., Twiss R.Q. Correlation between photons in two coherent beams of light. Nature. 1956;177 27–20. [Google Scholar]
- 23.Kitson S.C., Jonsson P., Tapster P.R. Intensity fluctuation spectroscopy of small numbers of dye molecules in a microcavity. Phys. Rev. A. 1998;58:620. [Google Scholar]
- 24.Lagerstedt J.O., Budamagunta M.S., Voss J.C. Electron paramagnetic resonance spectroscopy of site-directed spin labels reveals the structural heterogeneity in the N-terminal domain of apoA-I in solution. J. Biol. Chem. 2007;282:9143–9149. doi: 10.1074/jbc.M608717200. [DOI] [PubMed] [Google Scholar]
- 25.Sriram R., Lagerstedt J.O., Jue T. Imaging apolipoprotein AI in vivo. NMR Biomed. 2011 doi: 10.1002/nbm.1650. [DOI] [PMC free article] [PubMed] [Google Scholar]
- 26.Laurence T.A., Fore S., Huser T. Fast, flexible algorithm for calculating photon correlations. Opt. Lett. 2006;31:829–831. doi: 10.1364/ol.31.000829. [DOI] [PubMed] [Google Scholar]
- 27.Silva R.A.G.D., Hilliard G.M., Davidson W.S. A mass spectrometric determination of the conformation of dimeric apolipoprotein A-I in discoidal high density lipoproteins. Biochemistry. 2005;44:8600–8607. doi: 10.1021/bi050421z. [DOI] [PubMed] [Google Scholar]
- 28.Kask P., Palo K., Gall K. Fluorescence-intensity distribution analysis and its application in biomolecular detection technology. Proc. Natl. Acad. Sci. USA. 1999;96:13756–13761. doi: 10.1073/pnas.96.24.13756. [DOI] [PMC free article] [PubMed] [Google Scholar]
- 29.Laurence T.A., Kapanidis A.N., Weiss S. Photon arrival-time interval distribution (PAID): a novel tool for analyzing molecular interactions. J. Phys. Chem. B. 2004;108:3051–3067. [Google Scholar]
- 30.Chen Y., Müller J.D., Gratton E. The photon counting histogram in fluorescence fluctuation spectroscopy. Biophys. J. 1999;77:553–567. doi: 10.1016/S0006-3495(99)76912-2. [DOI] [PMC free article] [PubMed] [Google Scholar]
- 31.Hofkens J., Cotlet M., De Schryver F. Revealing competitive Forster-type resonance energy-transfer pathways in single bichromophoric molecules. Proc. Natl. Acad. Sci. USA. 2003;100:13146–13151. doi: 10.1073/pnas.2235805100. [DOI] [PMC free article] [PubMed] [Google Scholar]
- 32.Laurence T.A., Kwon Y., Barsky D. Correlation spectroscopy of minor fluorescent species: signal purification and distribution analysis. Biophys. J. 2007;92:2184–2198. doi: 10.1529/biophysj.106.093591. [DOI] [PMC free article] [PubMed] [Google Scholar]
- 33.Persson G., Thyberg P., Widengren J. Modulation filtering enables removal of spikes in fluorescence correlation spectroscopy measurements without affecting the temporal information. J. Phys. Chem. B. 2009;113:8752–8757. doi: 10.1021/jp902538b. [DOI] [PubMed] [Google Scholar]