

Abstract
We compared psychophysical and functional magnetic resonance imaging (fMRI) responses within areas V1-V3 and MT+ during both a speed and a contrast discrimination task. We found that fMRI responses did not depend significantly on task in any of these areas. Moreover, responses in V1-V3 were larger than those in MT+ for both the speed and the contrast discrimination tasks across a wide range of contrasts. This pattern of results demonstrates that localizing function based on finding those regions of cortex that show greater activity to a given task-stimulus combination than to other tasks and stimuli may, under certain conditions, be misleading. However, a simple ideal observer model assuming that perceptual thresholds are dependent on neuronal population responses does successfully show that V1 has neuronal properties consistent with our subjects' contrast discrimination performance, and that MT+ has neuronal properties consistent with subjects' performance on a speed discrimination task.
Keywords: attention, contrast, speed, motion, fMRI, task
Introduction
Many functional magnetic resonance imaging (fMRI) studies localize brain areas associated with a task by finding the cortical region that shows most activity to a given task-stimulus combination (Corbetta et al., 1990, 1991; Beauchamp et al., 1997; O'Craven et al., 1997; Chawla et al., 1999; Huk and Heeger, 2000). This assumes activity is larger in a cortical area when subjects are performing a task relevant to that area, and several studies have indeed found that responses in a given area depend on the task that observers are performing. For example, Huk and Heeger (2000) found larger responses in MT+ when observers performed speed discrimination compared with contrast discrimination.
However, even when the physical stimulus is kept constant, if a change in the task results in a change in the spatial extent or location of spatial attention, there is likely to be modulation in fMRI responses as a result of spatial attention that mimics task-specific attention effects (Gandhi et al., 1999; Martinez et al., 1999; Somers et al., 1999). Carefully controlling for spatial attention, we compared psychophysical and fMRI responses to moving sinusoidal gratings while subjects performed speed and contrast discrimination tasks.
Psychophysically, we replicated the established result (Legge and Foley, 1980) in which contrast discrimination thresholds increase with baseline contrast. We also found that speed discrimination thresholds do not increase with contrast. fMRI responses were consistent with previous fMRI and electrophysiology results; responses increased monotonically with contrast in areas V1, V2, and V3 but were flat in area MT+ across all of the contrasts that we tested (Sclar et al., 1990; Thiele et al., 2000).
To our surprise, we did not find any evidence that responses in a given cortical area depended on whether observers were performing a speed or contrast discrimination task. We did not find significant task-based modulation for any visual area or for any contrast. Consequently, responses in areas V1, V2, and V3 were larger than those in MT+, regardless of which task observers were performing.
These results suggest that localizing function based on which area shows that the maximal response to a given task may, under certain conditions, be misleading. How, then, should the cortical area mediating a given task be identified? We used a simple ideal observer model that assumes that perceptual thresholds are dependent on neuronal population responses. This simple model successfully identifies V1 (or possibly V2) as the site with neuronal properties consistent with contrast discrimination and MT+ as the site with neuronal properties consistent with speed discrimination.
Our failure to find modulations in neuronal response is surprising given the previous literature. One possibility is that featural attention may not simply depend on how closely the attended feature matches the selectivity of a neuron (Treue and Martinez Trujillo, 1999) but also on whether distracters are present and how closely these distracters match the target stimulus.
Materials and Methods
Subjects. Two male and two female subjects (all right-handed; mean age, 30 years) participated in the study. All subjects had normal or corrected-to-normal visual acuity. All subjects indicated informed written consent in accordance with The Salk Institute Human Subjects Review Board guidelines. All psychophysical and fMRI procedures were approved by The Salk Institute Institutional Review Board.
Stimulus presentation apparatus. Stimuli were generated on an Apple PowerMac G3 laptop computer during both psychophysical threshold measurements in the laboratory and fMRI scanning, using Matlab and the Psychophysics Toolbox (Brainard, 1997; Pelli, 1997). Images were then projected onto a back-projection screen using an NEC Solutions (Itasca, IL) LT157 liquid crystal display projector. For psychophysical measurements, subjects viewed stimuli on a back-projection screen using a chin rest while sitting in an upright position in the laboratory. The viewing distance was 60 cm. During fMRI data acquisition, subjects viewed stimuli using the same computer, projector model, back-projection screen material, and viewing distance as used for the psychophysical measurements. A zoom lens (806MCZ123; focal length, 187-312 mm; Buhl Optical, Rochester, NY) fitted on the projector ensured that the scale of the projected image was identical to that used in the laboratory. The only difference was that subjects lay on their backs in the bore of the MRI scanner and viewed the image on a screen near the subject's chest through a mirror mounted to the MRI table above the subject's eyes. The projector was gamma-corrected to yield the same range of luminance as in the laboratory. A bite-bar stabilized the subject's head. Subjects responded to visual stimuli using a response box (LUMITouch fiber-optical MRI-compatible system; Photon Control, Burnaby, British Columbia, Canada).
Stimuli and psychophysical tasks. The stimulus for both the contrast and speed discrimination tasks was a moving sinusoidal grating of the same mean luminance as the background. The mean luminance was chosen to activate only the photopic system (∼800 cd/m2). The 0.5 cycle/° sinusoidal grating was windowed by a circular aperture of 6° diameter and centered 8° down from the horizontal meridian and 8° laterally (left or right) from the vertical meridian. The grating moved at a baseline speed of 10°/s in the direction of 45° toward the top left when presented within the lower left visual quadrant and toward the top right when presented in the lower right quadrant. Five baseline contrast levels were used (6.25, 12.5, 25, 50, and 75%).
For both discrimination tasks, we used a two-interval forced-choice paradigm. Each trial lasted 3000 ms and consisted of two 1000 ms stimulus presentation intervals separated by a 200 ms blank interval, 300 ms response period, 300 ms feedback period, and 200 ms intertrial interval (Fig. 1). In every trial, both contrast and speed were independently varied between the first and second stimulus presentation by a small increment. During the speed discrimination task, subjects indicated which of the two presentation intervals contained the fastest moving grating by pressing one of two buttons during the response interval that followed stimulus presentation. During the contrast discrimination task, subjects indicated which of the two intervals contained the stimulus of higher contrast by, again, pressing one of the two response keys. The response interval was followed by a 300 ms feedback interval in which the outline of the fixation spot turned red for incorrect responses, green for correct responses, and yellow if no response was entered before the end of the response interval.
Figure 1.

The psychophysical task. The stimulus consisted of a sinusoidal grating presented in either the lower left or right visual field. ISI,Interstimulus interval; ITI, intertrial interval.
For gratings, physical speed is temporal frequency divided by spatial frequency, and the spatial frequency of our stimulus was not varied throughout the experiment. As a result, speed and temporal frequency were perfectly confounded, and in theory, our subjects might have been performing a temporal frequency discrimination mediated by (for example) V1. We could have varied the spatial frequency of the stimulus between the two presentation intervals (McKee and Welch, 1989). However, perceived speed and temporal frequency may be only partially separable (Smith and Edgar, 1991), and changes in the spatial frequency of the stimulus alter the distribution of active neurons in area MT (Priebe et al., 2003, 2004). This failure of “speed constancy” indicates that even genuine judgments of perceived speed may not be independent of the spatial and temporal frequency of the stimulus. However, although speed discrimination performance may have been influenced by temporal frequency, performance did not increase with contrast, as would be expected if mediated by V1-V3. Moreover, in an analogous experiment using moving limited-lifetime dots of varying density as our stimulus (so temporal frequency was no longer a cue), and dot density/speed discrimination as the tasks, we found an identical pattern of results: no difference in V1 and MT+ responses between the two tasks and V1 responses increasing with dot density, whereas MT+ responses remained flat. Similarly, subjects could have performed the task by counting the number of cycles that appeared within each presentation interval. However, pilot data showed that subjects had extreme difficulty determining the number of cycles in a given duration, and thresholds were not affected by small variations in the duration of the presentation interval.
The size of the speed and contrast increments depended on the experimental condition. Before scanning, psychophysical thresholds were measured in the laboratory for each subject and condition using a standard one-up three-down double-interleaved staircase procedure (70 trials for each staircase run). Both speed and contrast discrimination thresholds were measured for every baseline contrast. Weibull functions were fit to the psychometric data using a maximum likelihood procedure to estimate the speed or contrast increment that would produce 79% correct performance. We observed that throughout the first psychophysical session, discrimination thresholds tended to decrease as a result of practice. We therefore excluded from analysis threshold data collected during the initial two psychophysical 1 h sessions (∼24 staircases) to minimize learning effects. Occasional staircase runs that resulted in failure to fit the Weibull function were repeated (one to three per subject). Staircase runs were counterbalanced for baseline contrast level (using an m-sequence) and stimulus presentation side. The discrimination task alternated between speed and contrast every four staircase runs. Threshold measurements (staircases) were repeated six times for each contrast level and discrimination task and were averaged across both the lower left and lower right visual quadrants.
For the task in the MRI scanner, speed and contrast increments were set to the threshold values obtained in the laboratory. These threshold increments were held constant throughout every scan to maintain constant task difficulty at ∼79% correct for both tasks. In the main fMRI experiment, each scan consisted of eight-trial blocks (3 s each) with the task and stimulus alternating from the lower left to lower right on each block. Each scan contained 11 blocks, lasting a total of 264 s. Using this design, each hemisphere received an alternation between the stimulus for 24 s and a blank period for 24 s during which the stimulus was presented in the contralateral hemisphere. This method produces fMRI signal modulation in the contralateral hemisphere to the stimulus that mimics an on/off block design while keeping the subjects' vigilance levels constant throughout the scan. The order of the two tasks was counterbalanced across scanning sessions for each subject. In a second experiment designed to directly examine the effect of switching between contrast and speed discrimination, the stimulus was presented continuously in one of the two visual fields, and subjects were directed to alternate between performing the speed and the contrast discrimination task by a small cue at fixation. Each scan again contained 11 blocks and lasted a total of 264 s. This variant was repeated at 6.25 and 50% contrast for two subjects.
fMRI data acquisition. fMRI data were acquired using a Varian (Palo Alto, CA) Unity-Inova 3T scanner at the Center for Functional MRI (University of California, San Diego) using a custom-made volume coil (diameter, 23 cm) and a low-bandwidth echo-planar imaging sequence (125 kHz). During each scan, 132 temporal frames were acquired over 264 s (repetition time, 2 s; flip angle, 90°; 24 interleaved slices of 3 mm thickness and 3 × 3 mm resolution; field of view, 192 mm). fMRI data from the first block (24 s) was discarded to avoid the effects of magnetic saturation and visual adaptation. This long-duration 48 s period block design minimizes nonlinearities caused by interactions between contrast and stimulus presentation duration (Boynton et al., 1999). Ten experimental scans were acquired from each subject, consisting of five contrast levels by two discrimination tasks. Retinotopic reference scans designed to identify V1, V2, V3, and an MT+ reference scan were obtained in a separate session. Each scanning session ended with an anatomical scan (magnetization-prepared rapid gradient echo, 1 × 1 × 3 mm resolution) using a standard T1-weighted gradient echo pulse sequence. Anatomical scans were used to align functional data across multiple scanning sessions to a subject's reference volume.
Region of interest selection. Occipital visual cortical areas V1, V2, V3, and MT+ were defined using standard retinotopy mapping and cortical-flattening techniques as described previously (Engel et al., 1994; Sereno et al., 1995; Boynton et al., 1999). Regions of interest (ROIs) within these predefined areas were selected by means of reference scans that were run at the beginning of each session. Subregions within areas V1-V3 were selected based on the response to a high-contrast flickering checkerboard pattern subtending the same region of the visual field as the stimuli used in the main experiments (counterphase-modulated checkerboard flickered at 8 Hz). The flickering checkerboard was presented on one side of fixation at a time and alternated hemifields every 24 s, producing five full cycles over the 240 s scanning period (after discarding the initial 24 s of data). For subsequent analysis, we chose voxels that correlated (r > 0.3) with a five-cycle sinusoid (using a fast Fourier transform) and had a temporal phase lag with respect to stimulus no larger than ∼11 s. This procedure resulted in selecting well-localized foci of activation within V1-V3 (the stimulus was presented in the lower visual field). Area MT+ was identified using standard techniques (Engel et al., 1994; Sereno et al., 1995) by measuring fMRI responses to high-contrast dot patterns (white dots on a black background) that alternated between moving (radially inward and outward) and stationary. Area MT+ was selected as a contiguous group of voxels lateral to the parietal-occipital sulcus and beyond V1-V3, with a time series that correlated (r > 0.3 within a <11 s lag time) with the temporal alternation (moving vs stationary) of the stimulus.
fMRI data analysis. For the speed and contrast discrimination tasks, a sinusoid (five-cycle/scan, 48 s period) was fit to the time series of voxel responses averaged across a given ROI. The fMRI response was defined as the projection of the phase and amplitude of the sinusoid onto a unit vector with a delay of 45° in the left hemisphere and 225° in the right hemisphere, consistent with a 3 s hemodynamic response latency (Boynton et al., 1996, 1999). These projected amplitudes were measured in occipital visual areas V1, dorsal V2, dorsal V3, and MT+. Responses were analyzed in dorsal visual areas, which represent the lower visual quadrants (where the stimulus was presented).
Because the discrimination tasks were performed continuously throughout the scan while stimuli alternated between the two visual hemifields, only retinotopically localized fMRI responses were evoked. We detected a total of six activation foci in each subject, all constrained within occipital poles of each cerebral hemisphere. However, we only found reliable responses in four areas: V1, V2, V3, and MT+. Areas V3A and V4V were not consistently localized for all subjects, and results in these areas are not shown. Therefore, we focused our analysis within the occipital cortex, which was computationally flattened (Engel et al., 1997), and functional activation maps were projected onto flattened surfaces.
Results
Psychophysics
The left column in Figure 2 shows contrast discrimination thresholds as a function of baseline contrast for all four observers (S1-S4). Error bars represent SEM. As expected, contrast discrimination thresholds increase with increasing baseline contrast (Legge and Foley, 1980; Boynton et al., 1999). The continuous lines are predictions from the best fit of the population-based model (see below, The model) to these psychophysical thresholds.
Figure 2.
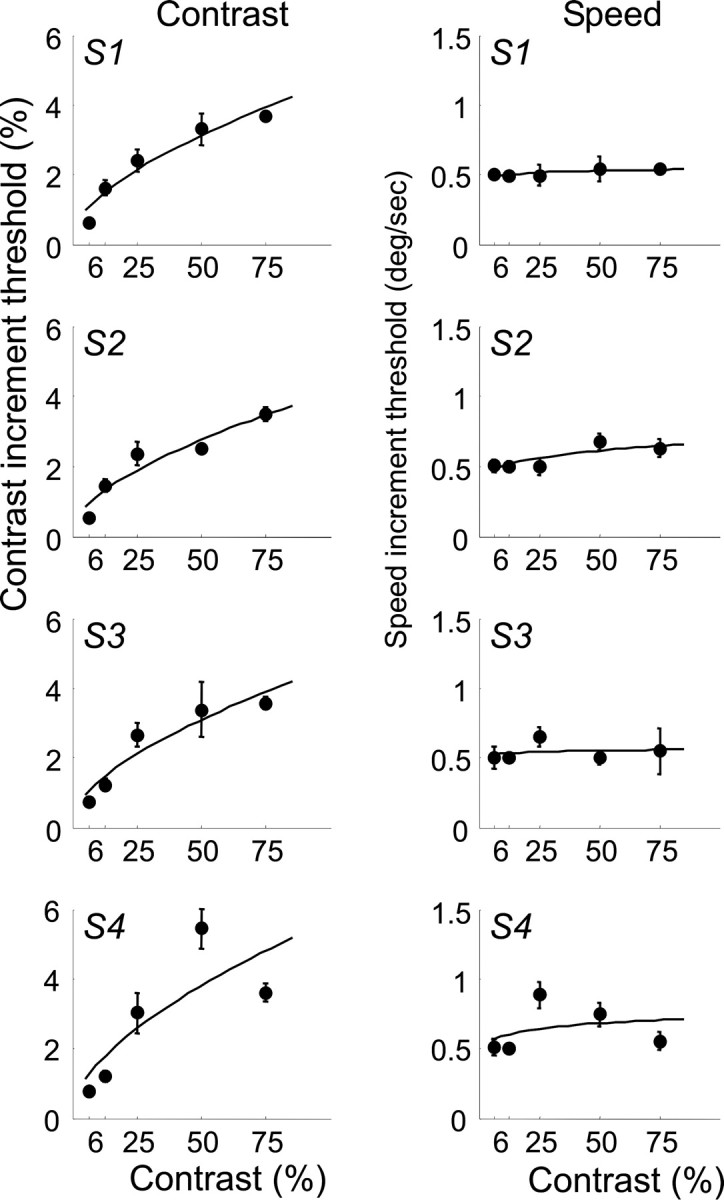
Psychophysical contrast and speed discrimination thresholds as a function of contrast for the four subjects (S1-S4). The error bars represent SEM. The continuous lines represent the best fit of the model.
The right column in Figure 2 shows speed discrimination thresholds as a function of baseline contrast for each of the four observers. The continuous lines are predictions from the model. Interestingly, speed discrimination is approximately invariant for the contrasts that we tested; if anything, speed discrimination becomes slightly harder with increasing stimulus contrast.
fMRI responses
fMRI responses were collected from subjects performing either the speed or the contrast discrimination task at threshold. Figure 3 shows average fMRI response amplitudes while subjects alternated between performing the task in the left and the right visual field in the four visual cortical areas V1, V2, V3, and MT+ for each of the four subjects. There was no difference in responsivity between the two hemispheres, and therefore data have been averaged across both hemispheres. Open squares in Figure 3 represent the fMRI responses acquired while subjects performed the contrast discrimination task, and filled circles represent the speed discrimination task. The error bars indicate SEM (n = 4). An ANOVA shows that there was only one area in one subject that showed fMRI responses that were significantly different for the two tasks (uncorrected, p < 0.05), but given that there were 25 comparisons, there was a 63% probability of obtaining such as result by chance. No area showed significant task-dependent modulation after Bonferroni's correction. At low contrasts, responses in V1 were only slightly larger than those in MT+, regardless of whether observers were performing the contrast or the speed discrimination task. At high contrasts, responses in V1 were larger than those in MT+ for both tasks. Responses in all areas but MT+ increase monotonically with contrast. In area MT+, responses decrease slightly with contrast for all subjects. Although linear regression slopes failed to reach significance, in MT+, they were negative for all four subjects.
Figure 3.

Contrast response functions measured by BOLD fMRI in areas V1, V2, V3, and MT+ (columns) for each of the four subjects (S1-S4). Open symbols represent fMRI responses during the contrast discrimination task, and the filled symbols represent fMRI responses during the speed discrimination task. Error bars represent SEM. Asterisks represent conditions in which modulation was significantly different from 0 (**p < 0.01) and conditions in which modulation was significant (*p < 0.05).
This failure to find any systematic difference in response amplitudes between contrast and speed discrimination tasks was confirmed by a second experiment in which the stimulus was presented continuously in one of the two visual fields, and subjects were directed to alternate between performing the speed and the contrast discrimination task. Responses were analyzed once again within predetermined ROIs within each visual area. Figure 4 shows contralateral activity while subjects alternated between performing the speed and the contrast discrimination task, using the same y-axis as Figure 3. Note the change in scale along the y-axis: although modulations with task switching were significant in a few conditions, the effect of task switching is remarkably small across all visual areas that we examined.
Figure 4.

Responses measured by BOLD fMRI in areas V1, V2, V3, and MT+ as two subjects (S2, gray; S3, black) switched between the speed and the contrast discrimination task. Positive responses represent larger activity when subjects performed the contrast discrimination task. Note the change of scale along the y-axis. Two contrasts are shown. Error bars represent SEM.
The model
A wide collection of evidence, including animal (Newsome et al., 1985), human lesion (Zeki et al., 1991), electrophysiological, and microstimulation (Salzman et al., 1990, 1992) findings, implicates MT+ as playing an important role in motion perception, including speed discrimination. Yet, our data show not only that responses in MT+ do not differ depending on whether subjects are performing a speed or contrast discrimination task but also that fMRI responses in MT+ are smaller than those in V1-V3 for almost all contrasts, regardless of the task. These results show how simply choosing the visual area that responds maximally to a task can lead to misleading conclusions about which brain areas mediate a given perceptual decision. We believe that linking neuronal responses to task performance may provide a more reliable way of associating brain regions with behavior.
A previous study describes how contrast discrimination thresholds, like those measured here, can be predicted from fMRI responses in area V1 and V2 (Boynton et al., 1999; Zenger-Landolt and Heeger, 2003), and similar ideal observer models have also been successfully used to link perceptual decisions to the responses of single sensory neurons in the macaque (Newsome et al., 1989; Britten et al., 1992, 1996; Parker and Newsome, 1998). Here, we use an ideal observer model to show how such population models can be used to reliably disambiguate which brain regions might mediate performance on a given task. Here, we assume that the fMRI blood oxygenation level-dependent (BOLD) response is approximately linearly related to the overall neuronal population response (Logothetis et al., 2001).
Predicting fMRI responses
The model begins with a simple power function to describe the shape of the fMRI contrast response function: R = aCp, where R is the fMRI response, C is the stimulus contrast, a is a scale factor, and p is the exponent describing the shape of the curve. Figure 3 shows how fMRI contrast-response functions in V1 and other early visual areas increase monotonically, but all begin to saturate at higher contrasts. This is consistent with a power function having an exponent <1 (but >0). The left column in Figure 5 shows fMRI contrast-response functions, averaged across the two tasks, for each of the four subjects in area V1. The smooth curve is the best fitting power function to the data. Exponents (p) for the best fitting curve for each of the four subjects are 0.22, 0.35, 0.17, and 0.28. A bootstrapping technique was used to estimate the variability in these parameter estimates by repeatedly fitting the power functions to resampled fMRI data (with replacement). All four exponents are significantly >0 (p < 0.01; two-tailed).
Figure 5.
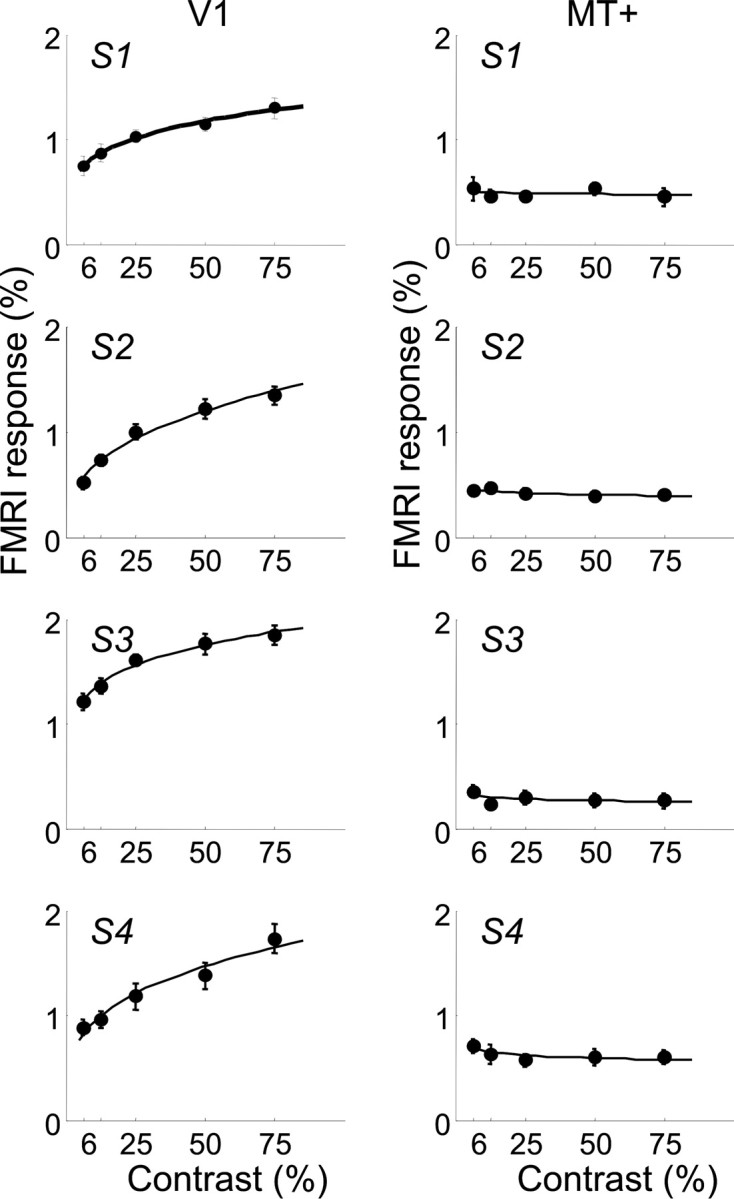
Contrast response functions measured by BOLD fMRI in areas V1 and MT+ (columns) for each of the four subjects (S1-S4). Responses during the contrast discrimination task and the speed discrimination task have been averaged. Error bars represent SEM. The continuous lines represent the best fit of the model within each visual area.
Contrast-response functions for MT+, averaged across the two tasks, are shown in the right column in Figure 5. These curves are clearly more flat and even appear to decrease with contrast (along the measured range of contrasts). The best fitting power functions are again shown as smooth curves and have exponents (p) of -0.02, -0.06, -0.08, and -0.07 for each of the four subjects. These negative exponents indicate a decreasing function with contrast. All four exponents are significantly <0 (p < 0.05; two-tailed). Note that a negative exponent is not sensible for contrasts of ∼0. Thus, this description of the contrast-response function should be considered valid only for the range of contrasts that we tested.
Predicting contrast discrimination thresholds
Using the same logic as described previously (Boynton et al., 1999), we make the assumption that two contrasts are perceptually discriminable if their responses differ by a criterion amount. That is, given a stimulus of baseline contrast C, the increment in contrast, ΔC, is at threshold if: a(C +ΔC)p - aCp = k, where aCp is the population response to the stimulus of baseline contrast, a(C + ΔC)p is the response to the stimulus with a threshold increment in contrast, and k is the response increment leading to threshold discrimination. This equation can be solved for ΔC, yielding the following:
 |
The ratio
 |
can be collapsed into a single parameter, so contrast increment threshold functions can be described using two parameters. The best fitting predictions of our measured contrast increment threshold results are shown as the smooth curves in the left column of Figure 2. This model fits the data well, and the exponent parameters (p) from the best fits for each of the four subjects are 0.24, 0.25, 0.24, and 0.22. Note that the exponent values from the contrast discrimination behavioral results match closely with the exponent values from the fMRI contrast responses in area V1.
Predicting speed discrimination thresholds
Neurons in the visual system are selective to specific ranges of temporal frequencies, with a varied distribution of preferred frequencies within a given visual area (De Valois and De Valois, 1990; Kulikowski, 2003). The population response therefore does not vary much as a function of speed in the intermediate range used in these experiments. As the speed changes, the response of some neurons increases, whereas others decrease, depending on whether the change is toward or away from the preferred speed of a neuron. Thus, the model used above to predict contrast discrimination thresholds from the population response does not apply to predict speed discrimination thresholds.
Instead, we must consider the response of individual neurons. Consider a neuron that responds to a stimulus of contrast C and speed S by R = af(S) × Cp, where the parameters a and p are the same as described above, and the function f(S) describes the speed (in the case of MT) or temporal frequency (in the case of V1-V3) tuning function of the neuron. This assumes that the response of the neuron is a separable function of contrast and temporal frequency tuning (Heeger, 1993; Heeger et al., 1996).
In fact, this is an oversimplification (see Discussion). Not all neurons in MT+ show pure speed tuning, because both individual and population responses vary with contrast and spatial frequency. However, psychophysical estimates of speed are robust to variations in spatial frequency (McKee et al., 1986; Smith and Edgar, 1991). Because we limited our stimulus to a single spatial frequency, interactions of perceived speed with spatial frequency can be ignored.
Psychophysical estimates of speed are also robust to variations in contrast within the range of contrasts that we tested. The shape of neuronal speed-tuning functions does not seem to change with contrast, although in the macaque, the responses in MT for an 8% contrast stimulus are approximately half that of a 32% contrast stimulus (Priebe et al., 2003, 2004). However, the pooled estimate of the neuronal contrast response function from 80 neurons in MT (Sclar et al., 1990; Thiele et al., 2000) defines a contrast-response function for which significant saturation has occurred by 5-6% contrast. We do not see reduction in absolute neural response for lower contrasts in our fMRI data.
Any reduction in neuronal response at low contrasts may lead to a slight decrease in perceived speed. Estimates from Priebe and Lisberger (2003, 2004) suggest that, for our stimulus, an increase in contrast between 8 and 32% results in approximately a doubling of the neural response but only 1°/s increase in perceived speed. In any case, our data and those of others (McKee et al., 1986; Smith and Edgar, 1991) suggest that such a small change in perceived speed caused by variations in contrast should have little or no effect on speed discrimination thresholds.
Now suppose that a change in speed is detectable if the change in response (either increase or decrease) exceeds a criterion amount. That is, an increment of ΔS on a stimulus of speed S is detectable at threshold if |af (S +ΔS) × Cp - af(S) × Cp| = k. This equation cannot be solved for ΔS explicitly without making an assumption about the temporal frequency tuning function, f(S). Fortunately, an estimate of the speed increment threshold, ΔS, can be estimated using the first-order Taylor series expansion f(S +ΔS) ≈ f(S) +ΔS × f′(S), which, when combined with the above equation, yields the following:
 |
That is, for a given neuron, the speed discrimination threshold behaves like a power function of contrast with exponent -p.
Note that this does not involve making explicit assumptions about the shape of speed or temporal frequency tuning functions. The threshold is inversely proportional to the absolute value of the slope of the speed-tuning function. This makes intuitive sense; the neuron is more sensitive to a change in speed when the slope of the temporal frequency tuning function is steep. However, it does not matter whether the tuning function as a whole is bandpass, low-pass, high-pass, or “band-rejected” (strong responses for low and high speeds but lower responses for intermediate speeds) (Liu and Newsome, 2003). Importantly, the response of the neuron changes with speed.
If we assume that each neuron within a given visual area contributes to the overall speed discrimination threshold, speed discrimination thresholds based on the population response should behave approximately as a power function with exponent -p. Power function fits to the speed discrimination data are shown as smooth curves in the right column in Figure 2. The best fitting exponents for all four subjects are >0, meaning that the contrast-response function that predicts these threshold data are power functions with negative exponents. These exponents for each of the four subjects are -0.04, -0.13, -0.03, and -0.09. These exponents predicting the speed discrimination values are very similar to the exponents predicting the contrast response functions in area MT+. The shallowness of the slope can be explained by the fact that contrast-response functions for neurons in MT+ saturate at relatively low contrasts, and as a result, the contrast-response function within MT+ is likely to be relatively flat across the range of contrasts that we tested.
Figure 6 shows a comparison of the best fitting exponent parameters for the two tasks and for the fMRI contrast-response functions in areas V1, V2, V3, and MT+. The top two rows show results from each of the four subjects. Error bars for the individual subjects were estimated using the bootstrapping method described above, and indicate one SEM. Note that the exponents decrease along the hierarchy of visual areas from V1 to MT+, which illustrates how the fMRI contrast-response functions become more and more flat and invariant with contrast (Tootell et al., 1995). For each of the subjects, the exponents from the contrast discrimination task are most consistent with the fMRI contrast-response functions in either V1 or V2, which is consistent with previous studies (Boynton et al., 1999; Zenger-Landolt and Heeger, 2003).
Figure 6.

Comparison of model estimates of p (the exponent of the contrast response function) across psychophysical and fMRI data. The top row shows results for all four subjects individually, and the bottom shows results collapsed across subjects. In each graph, the light gray bars represent estimates of p for the contrast and speed discrimination tasks. The dark gray bars represent estimates of p for V1, V2, V3, and MT+.
The exponents from the contrast-response functions in MT+ are consistent with the exponents derived from the speed discrimination task. A recent study (Priebe et al., 2004) applied a population-based model to predict psychophysical estimates of perceived speed based on their recordings of MT responses in the macaque (Priebe et al., 2003). Vector averaging across population responses successfully predicted how perceived speed was affected by changes in both spatial frequency and contrast. Their model predicts that in the range of contrasts in which MT responses are saturated, estimated speed should remain constant. It follows that any simple extension of their model would, like ours, predict that speed discrimination thresholds would also remain approximately constant as a function of contrast.
The bottom panel in Figure 6 shows the exponents averaged across the four observers. The error bars indicate SEM. The average exponents show that V1 is the area most consistent with contrast discrimination thresholds, and MT+ is most consistent with speed discrimination thresholds.
Discussion
Neuronal selectivity and featural attention
Huk and Heeger (2000) found that cortical activity in early visual areas depends not only on which stimulus is being presented but also on which task the subject is performing. Numerous studies have demonstrated feature-specific effects whereby responses within a given area are selectively enhanced depending on the feature attended to (Corbetta et al., 1990, 1991; Beauchamp et al., 1997; O'Craven et al., 1997; Chawla et al., 1999; Treue and Martinez Trujillo, 1999; Huk and Heeger, 2000; Saenz et al., 2002).
Why do we not find feature-specific attentional effects? One difference between our study and others is that we switched between speed and contrast discrimination, compared with switching between speed and color discrimination (Beauchamp et al., 1997; Chawla et al., 1999). It seems initially plausible that attention to contrast might operate differently from attention to color or speed and might show an invariance that spreads attention more broadly across all features of the attended object. This lack of selectivity might result in speed and contrast discrimination, enhancing the same population of neurons (those tuned for the speed and direction of motion being attended to). We would then expect to see a similar lack of response modulation if subjects alternated between color and contrast discrimination. But if neither speed nor color versus contrast modulate neural responses, one would not expect to see response modulation if subjects alternated directly between color and speed discrimination.
A second difference is that other studies (Beauchamp et al., 1997; Chawla et al., 1999) typically used stimuli-containing distracters. Given that one role of featural attention is presumably to exclude distracting stimuli, it seems reasonable that featural attention may depend not only on how closely the attended feature matches the selectivity of a neuron (Treue and Martinez Trujillo, 1999) but also whether distracters are present and how closely they match the target stimulus. Single-unit electrophysiology studies have established that attentional effects are much larger when multiple stimuli are placed within the receptive field of a neuron (Desimone and Duncan, 1995; Seidemann and Newsome, 1999). Where there are no distracters, as in our study, featural attention may spread more broadly across features in the attended object.
One previous study (Huk and Heeger, 2000) did find larger responses for speed discrimination than for contrast discrimination in MT+ (but not V1 or V3A). Why did we not replicate their positive finding? One possibility is that adaptation might have reduced the difference in the fMRI response to below statistical significance. Our gratings always moved in the same direction, although in the main experiment, the stimulus was only present during one-third of each scan (two-thirds of the time in the ON block, none of the time in the OFF block). In the experiment in which subjects alternated directly between the two tasks, the stimulus was present two-thirds of the time. However, performance remained constant both within each scan and throughout each scanning session. Also, we see no consistent trend in BOLD response favoring either of the two tasks in any subject, in any area, for any contrast, including the experiment in which we compare the two conditions directly. Nor do we believe that our results can be explained by differing amounts of adaptation between the two tasks. The increased amount of adaptation for the speed task would have to perfectly cancel out any increased response for that task across all contrasts levels.
A second possibility is that the lack of a difference in the overall fMRI response masks differences in underlying population responses between the two tasks. Suppose in a given area (such as MT+), the responses of all neurons are increased a small amount when attention is directed using contrast discrimination task, whereas attention directed via a speed discrimination task only increases the responses of neurons tuned for the appropriate direction and speed but by a larger amount. In theory, these two effects could result in population responses of exactly the same magnitude. However, it seems unlikely that these effects would cancel out so perfectly across all visual areas and all contrasts.
A more plausible explanation is that where large stimuli are used, the size of the “spotlight” of spatial attention may change with task. Huk and Heeger (2000) (like many other studies) used a large annular stimulus covering most of the visual field, whereas our visual stimulus was relatively small (a 6° diameter patch in the peripheral visual field). We believe this meant that in our task, spatial attention remained distributed across the entire stimulus, regardless of task. Huk and Heeger (2000) did explicitly test to determine whether their results could be attributed to shifts in spatial attention. They defined central and peripheral subregions of each subject's V1, compared modulations within these subregions, and did not observe opposite patterns of modulation between central and peripheral V1. However, if the main result of spatial attention was to simply increase responses over a larger region of the visual field during the speed discrimination task than in the contrast discrimination task, one would not necessarily predict an increase in response within areas representing central regions of the visual field during the contrast discrimination task. Nonetheless, one might still expect that Huk and Heeger (2000) would have seen modulation within areas of V1 representing peripheral regions.
Finally, it is possible that task-dependent modulation occurs in early visual areas, but that these effects are extremely small. Huk and Heeger (2000) found that switching directly between speed and contrast discrimination resulted in ∼0.1% modulation in MT+ compared with ∼0.5% modulation when subjects alternated between attending to a task and passive viewing and ∼1-1.5% modulation when subjects alternated between attending to a task and a blank field. In our second experiment in which subjects alternated between the speed and contrast discrimination tasks, we did find a trend for larger responses to the contrast discrimination task in areas V1-V3, but these effects were very small (and not significant): 0.1% modulation compared with ∼2% modulation when subjects alternated between performing a task and a blank interval.
Linking behavioral responses with fMRI responses
We found that neuronal responses increase with contrast in V1-V3 and are constant with contrast in MT+. Moreover, we see no effect of task, and at all contrasts, responses are larger in V1-V3 than in MT+. As a thought experiment, imagine that instead of examining speed and contrast discrimination within early visual areas, we were interpreting results of areas and tasks that were less well understood. What would be the natural conclusions drawn from our pattern of results? First, neural responses are smaller in MT+ for both tasks and show no increase with contrast. (In a different, higher-level task, task difficulty might be manipulated instead of contrast.) It might therefore be concluded that MT+ had no involvement in either task. This observation highlights another potential pitfall in comparing fMRI responses across different cortical regions. The amplitude of the BOLD signal depends on a variety of factors that may vary across different brain regions, including the sensitivity of the head coil, magnetic field inhomogeneities, and baseline cerebral blood flow (Buxton, 2002). Moreover, responses in V1 are relatively large for both tasks and show the same monotonic increase in response with contrast (or task difficulty) for both the speed and the contrast discrimination task. It might therefore be suggested that V1 plays a role in mediating both tasks, and it might also be plausibly suggested that the two tasks share some common substrate within V1.
Thus, localizing function based on finding the region of cortex that shows maximal fMRI activity to a given task, or even activity that increases systematically with contrast (or task difficulty), may, under certain conditions, be misleading. Instead we should, when possible, examine how well a neuronal response matches relevant behavioral performance before confidently identifying a given area as implicated in a particular task.
We found that fMRI and psychophysical results can be quantitatively linked using a simple neuronal population model in which the response within any given area is independent of the task that observer is performing, and perceptual thresholds are dependent on the neuronal population mediating that particular task. Because the contrast response function of each visual area differs, it is possible to identify which visual area shows responses consistent with observers' performances as a function of contrast on each of the two tasks. Specifically, we found that speed discrimination thresholds were consistent with the flat contrast-response functions of neurons in area MT+, whereas contrast discrimination thresholds were consistent with the saturating contrast response functions of neurons in V1-V2. Indeed, we found that of the four visual areas that we identified, area V1, and to a lesser degree area V2, showed contrast dependency consistent with psychophysical performance on the contrast discrimination task, and only area MT+ showed contrast dependency consistent with how speed discrimination varies with contrast.
Footnotes
This work was supported by National Institutes of Health Grant EY12925 and by the Drown Foundation. We are grateful to Robert Duncan and Melissa Saenz for comments on this manuscript.
Correspondence should be addressed to Giedrius Buracas, SNL-B, The Salk Institute, 10010 North Torrey Pines Road, La Jolla, CA 92037. E-mail: giedrius@salk.edu.
Copyright © 2005 Society for Neuroscience 0270-6474/05/253023-•$15.00/0
References
- Beauchamp MS, Cox RW, DeYoe EA (1997) Graded effects of spatial and featural attention on human area MT and associated motion processing areas. J Neurophysiol 78: 516-520. [DOI] [PubMed] [Google Scholar]
- Boynton GM, Engel SA, Glover GH, Heeger DJ (1996) Linear systems analysis of functional magnetic resonance imaging in human V1. J Neurosci 16: 4207-4221. [DOI] [PMC free article] [PubMed] [Google Scholar]
- Boynton GM, Demb JB, Glover GH, Heeger DJ (1999) Neuronal basis of contrast discrimination. Vision Res 39: 257-269. [DOI] [PubMed] [Google Scholar]
- Brainard DH (1997) The psychophysics toolbox. Spat Vis 10: 433-436. [PubMed] [Google Scholar]
- Britten KH, Shadlen MN, Newsome WT, Movshon JA (1992) The analysis of visual motion: a comparison of neuronal and psychophysical performance. J Neurosci 12: 4745-4765. [DOI] [PMC free article] [PubMed] [Google Scholar]
- Britten KH, Newsome WT, Shadlen MN, Celebrini S, Movshon JA (1996) A relationship between behavioral choice and the visual responses of neurons in macaque MT. Vis Neurosci 13: 87-100. [DOI] [PubMed] [Google Scholar]
- Buxton RB (2002) Introduction to functional magnetic resonance imaging: principles and techniques, pp 417-444. Cambridge, UK: Cambridge UP.
- Chawla D, Rees G, Friston KJ (1999) The physiological basis of attentional modulation in extrastriate visual areas. Nat Neurosci 2: 671-676. [DOI] [PubMed] [Google Scholar]
- Corbetta M, Miezin FM, Dobmeyer S, Shulman GL, Petersen SE (1990) Attentional modulation of neural processing of shape, color, and velocity in humans. Science 248: 1556-1559. [DOI] [PubMed] [Google Scholar]
- Corbetta M, Miezin FM, Dobmeyer S, Shulman GL, Petersen SE (1991) Selective and divided attention during visual discriminations of shape, color, and speed: functional anatomy by positron emission tomography. J Neurosci 11: 2383-2402. [DOI] [PMC free article] [PubMed] [Google Scholar]
- Desimone R, Duncan J (1995) Neural mechanisms of selective visual attention. Annu Rev Neurosci 18: 193-222. [DOI] [PubMed] [Google Scholar]
- De Valois RL, De Valois K (1990) Spatial vision, Vol 14, pp 112-114. Oxford: Oxford UP. [Google Scholar]
- Engel SA, Rumelhart DE, Wandell BA, Lee AT, Glover GH, Chichilnisky EJ, Shadlen MN (1994) fMRI of human visual cortex. Nature 369: 525. [DOI] [PubMed] [Google Scholar]
- Engel SA, Glover GH, Wandell BA (1997) Retinotopic organization in human visual cortex and the spatial precision of functional MRI. Cereb Cortex 7: 181-192. [DOI] [PubMed] [Google Scholar]
- Gandhi SP, Heeger DJ, Boynton GM (1999) Spatial attention affects brain activity in human primary visual cortex. Proc Natl Acad Sci USA 96: 3314-3319. [DOI] [PMC free article] [PubMed] [Google Scholar]
- Heeger DJ (1993) Modeling simple-cell direction selectivity with normalized, half-squared, linear operators. J Neurophysiol 70: 1885-1898. [DOI] [PubMed] [Google Scholar]
- Heeger DJ, Simoncelli EP, Movshon JA (1996) Computational models of cortical visual processing. Proc Natl Acad Sci USA 93: 623-627. [DOI] [PMC free article] [PubMed] [Google Scholar]
- Huk AC, Heeger DJ (2000) Task-related modulation of visual cortex. J Neurophysiol 83: 3525-3536. [DOI] [PubMed] [Google Scholar]
- Kulikowski JJ (2003) Neural basis of fundamental filters. In: Modulation of neuronal responses: implications for active vision (Buracas GT, Ruksenas O, Boynton GM, Albright TD, eds), pp 3-68. Amsterdam: IOS.
- Legge GE, Foley JM (1980) Contrast masking in human vision. J Opt Soc Am 70: 1458-1471. [DOI] [PubMed] [Google Scholar]
- Liu J, Newsome WT (2003) Functional organization of speed tuned neurons in visual area MT. J Neurophysiol 89: 246-256. [DOI] [PubMed] [Google Scholar]
- Logothetis NK, Pauls J, Augath M, Trinath T, Oeltermann A (2001) Neurophysiological investigation of the basis of the fMRI signal. Nature 412: 150-157. [DOI] [PubMed] [Google Scholar]
- Martinez A, Anllo-Vento L, Sereno MI, Frank LR, Buxton RB, Dubowitz DJ, Wong EC, Hinrichs H, Heinze HJ, Hillyard SA (1999) Involvement of striate and extrastriate visual cortical areas in spatial attention. Nat Neurosci 2: 364-369. [DOI] [PubMed] [Google Scholar]
- McKee SP, Welch L (1989) Is there a constancy for velocity? Vision Res 29: 553-561. [DOI] [PubMed] [Google Scholar]
- McKee SP, Silverman GH, Nakayama K (1986) Precise velocity discrimination despite random variations in temporal frequency and contrast. Vision Res 26: 609-619. [DOI] [PubMed] [Google Scholar]
- Newsome WT, Wurtz RH, Dursteler MR, Mikami A (1985) Deficits in visual motion processing following ibotenic acid lesions of the middle temporal visual area of the macaque monkey. J Neurosci 5: 825-840. [DOI] [PMC free article] [PubMed] [Google Scholar]
- Newsome WT, Britten KH, Movshon JA (1989) Neuronal correlates of a perceptual decision. Nature 341: 52-54. [DOI] [PubMed] [Google Scholar]
- O'Craven KM, Rosen BR, Kwong KK, Treisman A, Savoy RL (1997) Voluntary attention modulates fMRI activity in human MT-MST. Neuron 18: 591-598. [DOI] [PubMed] [Google Scholar]
- Parker AJ, Newsome WT (1998) Sense and the single neuron: probing the physiology of perception. Annu Rev Neurosci 21: 227-277. [DOI] [PubMed] [Google Scholar]
- Pelli DG (1997) The VideoToolbox software for visual psychophysics: transforming numbers into movies. Spat Vis 10: 437-442. [PubMed] [Google Scholar]
- Priebe NJ, Cassanello CR, Lisberger SG (2003) The neural representation of speed in macaque area MT/V5. J Neurosci 23: 5650-5661. [DOI] [PMC free article] [PubMed] [Google Scholar]
- Priebe NJ, Cassanello CR, Lisberger SG (2004) Estimating target speed from the population response in visual area MT. J Neurosci 24: 1907-1916. [DOI] [PMC free article] [PubMed] [Google Scholar]
- Saenz M, Buracas GT, Boynton GM (2002) Global effects of feature-based attention in human visual cortex. Nat Neurosci 5: 631-632. [DOI] [PubMed] [Google Scholar]
- Salzman CD, Britten KH, Newsome WT (1990) Cortical microstimulation influences perceptual judgements of motion direction. Nature 346: 174-177. [DOI] [PubMed] [Google Scholar]
- Salzman CD, Murasugi CM, Britten KH, Newsome WT (1992) Microstimulation in visual area MT: effects on direction discrimination performance. J Neurosci 12: 2331-2355. [DOI] [PMC free article] [PubMed] [Google Scholar]
- Sclar G, Maunsell JH, Lennie P (1990) Coding of image contrast in central visual pathways of the macaque monkey. Vision Res 30: 1-10. [DOI] [PubMed] [Google Scholar]
- Seidemann E, Newsome WT (1999) Effect of spatial attention on the responses of area MT neurons. J Neurophysiol 81: 1783-1794. [DOI] [PubMed] [Google Scholar]
- Sereno MI, Dale AM, Reppas JB, Kwong KK, Belliveau JW, Brady TJ, Rosen BR, Tootell RB (1995) Borders of multiple visual areas in humans revealed by functional magnetic resonance imaging. Science 268: 889-893. [DOI] [PubMed] [Google Scholar]
- Smith AT, Edgar GK (1991) The separability of temporal frequency and velocity. Vision Res 31: 321-326. [DOI] [PubMed] [Google Scholar]
- Somers DC, Dale AM, Seiffert AE, Tootell RB (1999) Functional MRI reveals spatially specific attentional modulation in human primary visual cortex. Proc Natl Acad Sci USA 96: 1663-1668. [DOI] [PMC free article] [PubMed] [Google Scholar]
- Thiele A, Dobkins KR, Albright TD (2000) Neural correlates of contrast detection at threshold. Neuron 26: 715-724. [DOI] [PubMed] [Google Scholar]
- Tootell RB, Reppas JB, Kwong KK, Malach R, Born RT, Brady TJ, Rosen BR, Belliveau JW (1995) Functional analysis of human MT and related visual cortical areas using magnetic resonance imaging. J Neurosci 15: 3215-3230. [DOI] [PMC free article] [PubMed] [Google Scholar]
- Treue S, Martinez Trujillo JC (1999) Feature-based attention influences motion processing gain in macaque visual cortex. Nature 399: 575-579. [DOI] [PubMed] [Google Scholar]
- Zeki S, Watson JD, Lueck CJ, Friston KJ, Kennard C, Frackowiak RS (1991) A direct demonstration of functional specialization in human visual cortex. J Neurosci 11: 641-649. [DOI] [PMC free article] [PubMed] [Google Scholar]
- Zenger-Landolt B, Heeger DJ (2003) Response suppression in v1 agrees with psychophysics of surround masking. J Neurosci 23: 6884-6893. [DOI] [PMC free article] [PubMed] [Google Scholar]