

Abstract
Amyloid-β protein (Aβ) is thought to play a central pathogenic role in Alzheimer’s disease. Aβ can impair synaptic transmission, but little is known about the effects of Aβ on intrinsic cellular properties. Here we compared the cellular properties of CA1 hippocampal pyramidal neurons in acute slices from pre-plaque transgenic (Tg+) CRND8 mice and wild-type (Tg−) littermates.
CA1 pyramidal neurons from Tg+ mice had narrower action potentials with faster decays than neurons from Tg− littermates. Action potential-evoked intracellular Ca2+ transients in the apical dendrite were smaller in Tg+ than Tg− neurons. Resting calcium concentration was higher in Tg+ than Tg− neurons. The difference in action potential waveform was eliminated by low concentrations of tetraethylammonium ions and of 4-aminopyridine, implicating a fast delayed-rectifier potassium current. Consistent with this suggestion, there was a small increase in immunoreactivity for Kv3.1b in stratum radiatum in Tg+ mice.
These changes in intrinsic properties may affect information flow through the hippocampus and contribute to the behavioral deficits observed in mouse models and patients with early-stage Alzheimer’s disease.
1. INTRODUCTION
The brains of patients with Alzheimer’s disease (AD) contain elevated levels of β-amyloid protein (Aβ; Masters et al., 1985). Aβ is a peptide of 38-43 amino acids, which is liberated by sequential cleavage of amyloid precursor protein (APP). Aβ peptides can be neuropathogenic and aggregate to form senile plaques, a hallmark of postmortem AD brains (Hardy, 2006). The discovery that Aβ can be neurotoxic led to the amyloid hypothesis, which proposes that Aβ-induced cellular dysfunction and, eventually, cell death is central to AD (Hardy & Selkoe, 2002).
An improved understanding of the effects of Aβ has followed the development of transgenic mouse lines over-expressing human APP genes with mutations identified from patients with familial AD. In many of these mouse lines, Aβ accumulation causes synaptic dysfunction, learning deficits and plaque deposition. This progression mirrors AD in humans, where the early stages are often termed ‘mild cognitive impairment’ and are characterized by subtle cognitive dysfunction in the absence of neuronal loss. Hence APP over-expressing mice are a good model in which to investigate the early effects of chronic Aβ exposure in which a functional deficit, rather than a loss of neurons, underlies cognitive dysfunction.
As in AD, one of the first regions of the brain to show elevated levels of Aβ in many of these mouse lines is the hippocampus, which is central to memory formation and essential for many forms of learning. Within hippocampus the principal excitatory cell-type is the pyramidal neuron and synaptic transmission between pyramidal neurons in CA3 and CA1 regions of the hippocampus has been extensively studied in APP over-expressing mice (Small et al., 2001; Palop & Mucke, 2010). Many authors have reported deficits in long-term potentiation (LTP) and long-term depression (LTD) in the CA3-CA1 pathway in APP overexpressing mice (e.g. Chapman et al., 1999; Jolas et al., 2002; Brown et al., 2005; Jacobsen et al., 2006; Dewachter et al., 2007; Knobloch et al., 2007). Long-term potentiation (LTP) and depression (LTD) are changes in the strength of synaptic connections that are often considered to be electrophysiological correlates of learning and memory. Many of these effects occur before plaque formation (e.g. Hsia et al., 1999; Larson et al., 1999; Jolas et al., 2002). Aβ can also exert rapid effects on synaptic plasticity when applied to tissue from wild-type mice (Kim et al., 2001; Walsh et al., 2002; Wang et al., 2002; Wang et al., 2004; Nomura et al., 2005; Townsend et al., 2006; Shankar et al., 2008; Li et al., 2009; although see Raymond et al., 2003). Hence recent research has emphasized the adverse effects of Aβ on synapses, rather than direct effects on the intrinsic properties of neurons: their ion channels and membrane physiology.
Here we describe the changes in the intrinsic cellular function of CA1 pyramidal neurons in the CRND8 mouse model of APP overexpression. CRND8 mice carry a double human APP mutation (KM670/671NL “Swedish” and V717F “Indiana”) and overexpress APP, resulting in Aβ accumulation (Chishti et al., 2001). Plaque deposition first occurs at 2-3 months of age in CRND8 mice, becomes pronounced only after ~6 months of age and plaque load increases rapidly thereafter (Chishti et al., 2001; Jolas et al., 2002; Hyde et al., 2005). CRND8 mice demonstrate cognitive impairments that initially precede plaque deposition (e.g. Ambrée et al., 2006) and progress with age. Changes in synaptic transmission also begin in CRND8 mice before plaque formation, with basal synaptic transmission being depressed at 6-9 weeks of age (Ye et al., 2010) and LTP being enhanced in both pre- and post-plaque mice (Jolas et al., 2002). To identify the earliest, pre-plaque effects of Aβ, we therefore studied CA1 pyramidal neurons in acute slices from 1 week- to 4 month-old CRND8 mice.
We measured a large number of intrinsic cellular parameters in CA1 hippocampal pyramidal neurons, using electrophysiological and imaging techniques and comparing the properties of young adult Tg+ mice and age-matched wild-type littermates. We found changes in intrinsic cellular properties that precede synaptic dysfunction. Our results suggest that Aβ affects both intrinsic cellular properties and, subsequently, synaptic dysfunction and that these effects combine to shape the network and behavioral deficits observed in CRND8 mice and perhaps in AD.
2. MATERIALS AND METHODS
All experiments and procedures were approved by the Northwestern University Institutional Animal Care and Use Committee (IACUC).
2.1 CRND8 mice
A colony of CRND8 mice was established from founders provided by the University of Toronto. Mice were bred and genotyped as in previous publications (Chishti et al., 2001; Jolas et al., 2002; Chauhan, Siegel & Lichtor, 2004; Hyde et al., 2005; Ambrée et al., 2006), crossing heterozygous male CRND8 mice with wildtype B6C3H females, which yields F1 mice with the transgene and wild-type littermates. The presence or absence of the transgene was determined by PCR analysis of genomic DNA from tail clips, using primers for the APP Swedish (K670M/N671L) and Indiana (V717F) transgenes. All recordings were from male mice. Where possible, recordings were obtained from Tg+ and Tg− littermates and recording and analysis were performed blind to the genotype of the animal.
2.2 Acute slice preparation
Mice were deeply anesthetized with ketamine/xylazine (i.p) and transcardially perfused with cold (4°C) modified artificial cerebro-spinal fluid (ACSF) containing high sucrose and low sodium (in mM): 85 NaCl, 2.5 KCl, 1.25 NaH2PO4, 20 NaHCO3, 10 HEPES, 25 Glucose, 75 Sucrose, 0.5 CaCl2, 4 MgCl2, pH 7.3, oxygenated with 95% O2/5% CO2. The mouse was then decapitated and the brain rapidly removed into cold sucrose-ACSF. Horizontal hippocampal slices 300 μm thick were prepared using a vibrating slicer (Vibratome, St. Louis, MO) and transferred to a holding chamber containing modified ACSF at 35°C. After 20 minutes slices were transferred to a holding chamber containing ACSF at room temperature (in mM): 125 NaCl, 2.5 KCl, 1.25 NaH2PO4, 20 NaHCO3, 5 HEPES, 25 Glucose, 2 CaCl2, 1MgCl2, pH 7.3, oxygenated with 95% O2/5% CO2. Slices were used for recordings 0.5-4 hours after preparation. For recording, slices were transferred to the stage of an upright microscope (Olympus BX51W) and constantly perfused with ACSF at 36 ± 1°C. Where appropriate, synaptic transmission was blocked by adding 10 μM NBQX (2,3-dihydroxy-6-nitro-7-sulfamoyl-benzo[f]quinoxaline-2,3-dione), 50 μM AP5 (DL-2-amino-5-phosphonopentanoic acid) and 10 μM gabazine (6-imino-3-[4-methoxyphenyl]-1[6H]-pyridazinebutanoic acid hydrobromide) to the ACSF. After recording and imaging, slices were fixed for histological processing. Slices were fixed overnight in 4% (w/v) paraformaldehyde in phosphate-buffer (PB; 75 mM Na2HPO4, 25 mM NaH2PO4, pH 7.4).
2.3 Electrophysiology
Somatic whole-cell recordings were obtained under visual control using infra-red difference interference contrast optics (IR-DIC). Pipettes were 3-6 MΩ when filled with intracellular solution. Current-clamp recordings were obtained with an Axoclamp-2A amplifier and the following intracellular solution (in mM): 135 K-gluconate, 4 KCl, 10 HEPES, 4 Mg-ATP, 0.3 Na-GTP, 10 Na2-phosphocreatine, 0.2% (w/v) biocytin (pH 7.3, 291-293 mOsm). Voltage-clamp recordings were obtained with an Axopatch-200B amplifier and the following intracellular solution (in mM): 110 Cs-methanesulphonate, 10 HEPES, 10 EGTA, 2 Mg-ATP, 0.3 Na-GTP, 10 Na2-phosphocreatine, 10 lidocaine N-ethyl bromide (QX-314), 5 tetraethylammonium (TEA) chloride, 5 4-aminopyridine (4-AP), 0.2% (w/v) biocytin (pH 7.3 with CsOH). For voltage-clamp recordings 10 μM gabazine (SR-95531) was added to the ACSF.
Recordings were obtained from pyramidal neurons in the CA1 region of hippocampus. Pyramidal neurons were identified by the location of their somata in stratum pyramidale, by their apical dendrites (visible with IR-DIC optics and by fluorescence after obtaining a recording) and by their characteristic spiking patterns.
EPSCs were evoked with a 3-5 MΩ glass pipette, filled with ACSF and placed in stratum radiatum ~200 μm from the neuron. For paired-pulse stimulation, the neuron was held at −70 mV. For miniature EPSCs (mEPSCs), 1 μM tetrodotoxin was added to the ACSF. mEPSCs were recorded for 10 minutes at a holding potential of −70 mV. In all voltage-clamp experiments series compensation (~60%) was employed and recordings were discarded if series resistance was greater than 30 MΩ or changed by more than 20% during the recording.
Electrophysiological results were acquired at 20-50 kHz using National Instruments A-to-D boards and software custom-written in Labview by JW.
2.4 Analysis of electrophysiological results
Electrophysiological results were analyzed offline in IgorPro (Wavemetrics, Lake Oswego, OR) using routines written by JW. Statistical comparisons were made with Graphpad Instat, using the Mann-Whitney test unless otherwise stated.
Electrophysiological parameters were defined and measured as follows:
-
○
resting input resistance. To measure resistance at the resting membrane potential, we injected 300 ms hyperpolarizing and depolarizing current steps and plot the steady-state voltage change as a function of injected current (V-I relationship). The resting input resistance is the slope of the quadratic fit at zero current (Waters & Helmchen, 2006).
-
○
input resistances at −90,−80,−70 & −60mV: slopes of the fits to the V-I relationship at each membrane potential.
-
○
membrane rectification: We describe rectification using the anomalous rectification coefficient (CAR), derived from the quadratic fit to the V-I relationship, as defined in Waters & Helmchen (2006).
-
○
membrane sag: In CA1 hippocampal pyramidal neurons subthreshold currents, particularly Ih, produce a characteristic time-dependent change in membrane voltage (‘sag’) during hyperpolarizing current injections. We measured sag with 300 ms, 500 pA hyperpolarizing current injections, defining the amount of sag as a steady state/peak voltage ratio: (steady-state Vm − Vrest) / (peak Vm − Vrest).
-
○
fAHP: the amplitude of the fast spike after-hyperpolarization (AHP), defined as the difference in voltage between AP threshold and the most hyperpolarized value within 20 ms after the downstroke of the AP crosses the threshold voltage.
-
○
ADP: the fAHP is often followed by an after-spike depolarization (ADP). We measured the peak amplitude of the ADP (Vm at peak − Vrest), the latency (time of peak − time that AP crossed threshold) and the rate of decay of the ADP (exponential time constant of decay; exponential fit from peak of ADP).
-
○
medium/slow AHP: the period of prolonged hyperpolarization after the ADP. We measured the latency (time from crossing threshold to peak), peak amplitude (relative to AP threshold), the amplitudes 1 and 3 seconds after AP threshold and 90% decay time (time from the peak of the AHP to the voltage corresponding to Vrest − 10% of the amplitude of the medium/slow AHP).
-
○
rheobase: minimum current required to evoke one or more APs during a 300 ms-long depolarizing current step
-
○
current threshold for 10 APs: the minimum current required to evoke ten APs during a 300 ms-long depolarizing current step
-
○
AP threshold: voltage at which the first temporal derivative of the membrane potential exceeded 40 V/s
-
○
AP amplitude: peak voltage − threshold voltage
-
○
AP half width: width of AP at half-height
-
○
AP rise time: time to rise from 10% to 90% of AP amplitude
-
○
AP decay time: time to decay from 90% to 10% of AP amplitude
-
○
paired-pulse ratio: ratio of peak amplitudes of two EPSCs (amplitude of second EPSC / amplitude of first EPSC). Mean paired-pulse ratios were calculated in each neuron from at least 20 trials at each inter-pulse interval.
-
○
AMPA/NMDA ratio: ratio of the peak EPSC amplitude at holding potentials of −70 mV to the EPSC amplitude 60 ms post-stimulus at +40 mV. The mean AMPA/NMDA ratio was calculated for each neuron from EPSCs evoked alternatively at −70 and +40 mV for 20-50 trials.
-
○
mEPSC analysis: mEPSCs were detected using routine written in Igor by JW, based on the template-matching approach of Clements & Bekkers (1997). A biexponential template with a rise-time constant of 1.5-2.5 ms and a decay time constant of 6-12 ms was employed, determined for each neuron by fitting the mean of ~20 manually-selected EPSCs. We employed a detection threshold of −4. We calculated the mEPSC frequency and median amplitude from a minimum of 10 minutes of continuous recording.
2.5 Calcium imaging
Intracellular calcium measurements were made using a 2-photon microscope built by JW on an Olympus BX51 frame. The specimen was illuminated with 840 nm light from a Ti:sapphire laser (Chameleon Ultra, Coherent, 80 MHz repetition rate; 100-150 fs pulse width). Excitation light was focused onto the specimen using a 40x, NA 0.8 water-immersion objective (Olympus). Emitted light was be collected in the epifluorescence configuration through a 680 nm dichroic reflector and an infrared-blocking emission filter (ET700sp-2p, Chroma Technology) and split into red and green channels using a second dichroic mirror (T580lpxr, Chroma Technology). Emission filters were a 490-560 bandpass filter and a 590-650 bandpass filter (Chroma Technology). Fluorescence was detected using photomultiplier tubes (R6357, Hamamatsu). Scanning and image acquisition was controlled using custom software written in Labview by JW.
Neurons were filled via the recording pipette with the high-affinity calcium indicator Oregon green BAPTA 488-1 (OGB-1; 100 μM) and the calcium-insensitive indicator Alexa 594 (10 μM). Imaging data were collected only after the amplitude of the calcium signal was constant during repeated trials, indicating that the dyes had reached steady-state concentrations (>40 minutes after breaking whole-cell). Calcium transients were monitored with 500 Hz line-scans through the apical dendrite and the location of each line scan (relative to the soma) was determined with a calibrated x-y stage. Image analysis was performed using routines written by JW in Igor Pro (Wavemetrics). The fluorescence of each indicator was averaged over the width of the dendrite and background (from a region of the line not containing any stained structure) was subtracted.
Intracellular calcium concentration was expressed as a G/R ratio: the relative fluorescence of OGB-1 (green green) and Alexa 594 (red indicator; Oertner et al., 2002; Sabatini et al., 2002). This approach has several advantages over other methods of quantifying calcium concentration, principally that any change in the resting intracellular calcium concentration is readily apparent as a change in the resting G/R ratio. In addition, a change in intracellular calcium concentration will not directly affect measurement of the AP-evoked calcium transient.
2.6 Thioflavin staining and 6E10 immunohistochemistry
Mice were transcardially perfused with ~30 ml of 0.1M phosphate-buffered saline at pH 7.3 (PBS) containing 0.7% (w/v) heparin, followed by 30 ml of 4% (w/v) paraformaldehyde in PBS (PFA). Brains were removed and stored overnight in 4% PFA at 4°C. 75 μm coronal sections were cut on a Vibratome and washed three times in PBS. For thioflavin-S staining, sections were incubated overnight in 1ug/ml thioflavin-S (Sigma, St. Louis MO) and washed before mounting. For 6e10 immunohistochemistry, washed sections were placed in 1% (v/v) Triton TX-100 (in PBS) for 45 min, then 1% (w/v) bovine serum albumin (BSA) and 1% Triton TX-100 (in PBS) for 45 min and incubated overnight in 6E10 antibody (1:400). 6E10 immunofluorescence was visualized with a goat anti-mouse FITC secondary antibody. Thioflavin and 6E10-stained sections were mounted in mowiol 4-88 (Sigma, St. Louis MO) and fluorescence images were acquired by widefield microscopy.
To quantify thioflavin-S staining, images were thresholded at twice the median intensity to create discrete fluorescent puncta. The number of puncta and summed surface area of puncta were calculated in ImageJ (http://rsb.info.nih.gov/ij).
2.7 Channel immunohistochemistry
Mice were transcardially perfused as described above. Brains were placed in PFA at 4°C for 1-2 hours, transferred to 10% (w/v) sucrose in PBS (pH 7.35) for 1 hr and allowed to sink in 30% sucrose in PBS (pH 7.35). 50 μm-thick coronal sections were cut on a freezing microtome. Sections were rinsed three times in PBS, placed in 1% Triton TX-100 and 1% BSA in PBS for 1-2 hours and incubated overnight in primary antibody in 1% Triton TX-100 and 1% BSA in PBS. Antibodies were obtained from the UC Davis/NIH NeuroMab Facility. After three rinses in PBS, sections were incubated for 2 hours in rabbit anti-mouse secondary antibodies conjugated to Alexa 594 (Invitrogen, Carlsbad CA), rinsed and mounted in mowiol. Fluorescence images were acquired by widefield microscopy.
The relative intensities of fluorescence staining in stratum pyramidale, stratum radiatum and stratum oriens were expressed as a ‘fluorescence distribution ratio’. For each section a region of interest was defined that included stratum pyramidale in CA1. The intensity in this region was measured, as were the intensities in two neighbouring regions of identical size and shape in stratum radiatum and stratum oriens. From these raw intensities we subtracted background fluorescence, measured from sections processed with no primary antibody. We then divided the background-subtracted intensity in stratum pyramidale by the mean of the background-subtracted intensities of stratum radiatum and stratum oriens to yield the fluorescence distribution ratio. For each mouse, intensities and distribution ratios were measured for 3-6 sections and averaged.
3. RESULTS
3.1 Time course of APP expression and plaque deposition in CRND8 mice
Our aim was to determine the earliest changes in CA1 pyramidal neurons in CRND8 mice. Therefore we first determined the time course of APP expression and plaque formation in CRND8 mice. Aβ expression in CRND8 mice was detected using a monoclonal 6E10 antibody, which binds to human APP and to residues 1-16 of Aβ, including oligomeric and deposited forms of Aβ (Kim et al., 1998; Kim et al., 1990). Mean fluorescence in hippocampus was greater in Tg+ than in Tg− mice at all ages examined and increased with age (1-6 months; figure 1A and B). In Tg+ mice, fluorescence was particularly intense in stratum pyramidale, where 6E10 appeared to stain the cytoplasm in pyramidal neurons (figure 1A-D). To visualize plaques we used thioflavin-S, which binds to amyloid fibrils but not monomers and gives a distinct spectral shift upon binding (Guntern et al., 1992; LeVine, 1999). Thioflavin-S fluorescence was negligible before 2-3 months of age and increased rapidly after 4-5 months of age (figure 2, supplementary figure 1), consistent with previous reports (Chishti et al., 2001; Jolas et al., 2002; Hyde et al., 2005). We therefore focused our subsequent experiments on mice at 1-2 months of age, at which age APP is expressed in CRND8 mice, but there are no plaques.
Figure 1. 6E10 immunohistochemistry in CRND8 mice up to 6 months of age.

(A) Example widefield images of 6E10 immunohistochemistry in hippocampi from Tg+ and Tg− mice up to 6 months of age. 75 μm-thick fixed sections. (B) Hippocampal fluorescence (mean intensity of the entire image) as a function of age. Each data point is the mean ± SEM of 3 regions per section from 12 sections from 2 mice. (C) 2-photon images of stratum pyramidale in Tg+ and Tg− mice at 2 months of age, including control sections to which no primary (6E10) antibody was applied. (D) Ratio of fluorescence intensity in stratum pyramidale to that in stratum radiatum. Each data point is the mean ± SEM of 3 regions per section from 12 sections from 2 mice.
Figure 2. Plaque load quantified with thioflavin fluorescence.
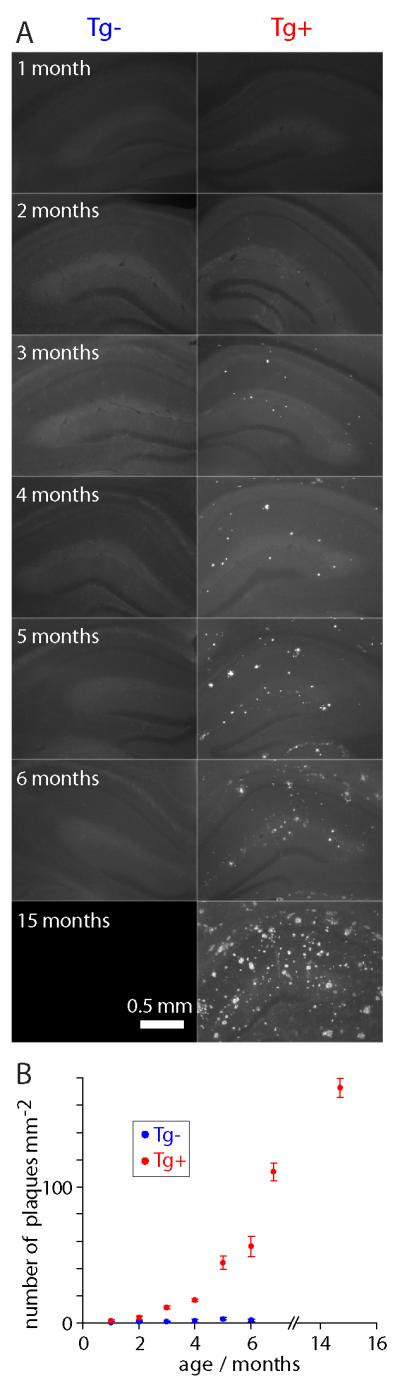
(A) Example widefield images of thioflavin staining showing hippocampi from Tg− and age-matched Tg+ CRND8 mice up to 15 months of age. 75 μm-thick fixed sections. (B) Plaque load as a function of age. Each data point is the mean (± SEM) of 4 sections from 2 mice.
3.2 Action potential waveform is narrower in Tg+ CRND8 mice from 1 month of age
We obtained whole-cell recordings from CA1 hippocampal pyramidal neurons in acute slices. We measured a large number of electrophysiological parameters, which together reflect the overall health of CA1 pyramidal neurons, comparing neurons in slices from CRND8 mice and wild-type littermates. By examining neurons in young animals, we aimed to identify which physiological parameters were the first to be affected in CRND8 mice.
Subthreshold parameters (such as resting membrane potential and input resistance) were similar in neurons from Tg+ and Tg− mice at 2 months of age (no significant differences in any parameters; table 1). However, APs were narrower in neurons from Tg+ than from Tg− mice: AP halfwidth and decay time were both ~10% shorter in Tg+ mice (figure 3). The spiking pattern, voltage threshold, AP amplitude and rise time were similar in Tg+ and Tg− mice (figure 3), suggesting that the difference in AP waveform is attributable to a change in one or more of the currents underlying membrane potential repolarization.
Table 1.
Electrophysiolgical characteristics of CA1 pyramidal neurons from 2 month-old CRND8 mice.
| Tg− | Tg+ | |
|---|---|---|
| Resting membrane potential (mV) | −63.8 ± 0.4 (n = 59) | −64.4 ± 0.4 (n = 49) |
| Resting input resistance (MΩ) | 124.8 ± 3.7 (n = 59) | 119.4 ± 3.0 (n = 49) |
| Input resistance at −90 mV (MΩ) | 92.4 ± 3.8 (n = 59) | 84.1 ± 2.9 (n = 49) |
| Input resistance at −80 mV (MΩ) | 103.9 ± 3.7 (n = 59) | 97.0 ± 3.0 (n = 49) |
| Input resistance at −70 mV (MΩ) | 120.0 ± 3.7 (n = 59) | 115.7 ± 3.3 (n = 49) |
| Input resistance at −60 mV (MΩ) | 143.1 ± 5.5 (n = 48) | 146.1 ± 5.8 (n = 44) |
| Anomalous rectification (MΩ/nA) | 64.3 ± 4.1 (n = 58) | 68.1 ± 3.8 (n = 49) |
| Sag (steady state/peak ratio) | 0.85 ± 0.007 (n = 33) | 0.84 ± 0.006 (n = 35) |
| Rheobase (pA) | 81.8 ± 4.9 (n = 59) | 82.4 ± 4.8 (n = 49) |
| Current threshold for 10 APs (pA) | 180.5 ± 8.7 (n = 59) | 168.2 ± 6.9 (n = 49) |
| fAHP amplitude (mV) | 7.3 ± 0.92 (n = 59) | 5.7 ± 1.1 (n = 48) |
| ADP amplitude (mV) | 11.8 ± 0.66 (n = 21) | 11.4 ± 0.65 (n = 20) |
| ADP latency (ms) | 2.8 ± 0.1 (n = 21) | 3.0 ± 0.1 (n = 20) |
| ADP decay time (ms) | 19.8 ± 1.3 (n = 21) | 16.6 ± 0.9 (n = 20) |
| Body weight (g) | 28.3 ± 0.8 (n = 20) | 24.7 ± 0.8 (n = 19) |
There was no significant difference in any of the above parameters (Mann Whitney test, P > 0.05), except for body weight, which was significantly smaller for Tg+ than for Tg− mice (P = 0.006).
Figure 3. Altered action potential waveforms in CA1 pyramidal neurons from young Tg+ CRND8 mice.

(A) Example of a train of ten action potentials evoked by 300 ms current injection (200pA) from a CA1 pyramidal neuron, 2 month-old mouse. (B) Examples of action potentials from trains of ten APs, overlaid to allow comparison of AP waveforms of 2 month-old Tg+ (red) and Tg− (blue) mice. Dashed lines denote −40 mV. (C) Mean (± SEM) inter-spike interval, AP threshold, AP amplitude, AP half width, 10-90% rise time and 10-90% decay time during trains of 10 APs in 2 month-old Tg+ (red) and Tg− (blue) mice. n = 54 Tg− mice and 46 Tg+ mice. (D) 10-90% decay times of APs during trains in CA1 pyramidal neurons from 1 month- and 1 week-old mice. n = 14 Tg− and 16 Tg+ mice at 1 month of age; 9 Tg− and 10 Tg+ mice at 1 week of age.
Post-spike potentials were unaffected (table 1) and the difference in AP waveform was preserved during a train of 10 APs. The difference in AP waveform was also observed in 1 month-old mice, but not in 1 week-old mice (figure 3, tables S1 and S2), indicating that this effect developed between 1 week and 1 month of age. Hence in CA1 pyramidal neurons from CRDN8 mice there is a selective narrowing of the AP waveform before changes in other electrophysiolgical parameters and several weeks or perhaps months before the first plaques form.
3.3 Intracellular calcium signaling in 2 month-old CRND8 mice
It is now widely accepted that Aβ causes dysfunction of synaptic transmission and particularly in synaptic plasticity (Small et al., 2001). Propagation of APs into the dendritic tree and the resulting wave of calcium influx are essential in the induction of some forms of synaptic plasticity (Waters et al., 2008). A narrower AP would be expected to propagate a shorter distance into the dendritic tree and evoke less calcium influx and might therefore contribute to the deficit in synaptic plasticity in CRND8 mice.
We therefore measured AP-evoked intracellular calcium signals in CA1 pyramidal neurons, filling neurons with a calcium indicator (100 μM OGB-1) and the calcium-insensitive fluorophore Alexa 594 via the whole-cell recording pipette and imaging the neuron with 2-photon microscopy (figure 1). In awake mice, CA1 pyramidal neurons often fire in high-frequency bursts of several APs at ~ 100 Hz (e.g. Ranck, 1973). We therefore evoked 1-4 APs at 100 Hz by somatic current injection and monitored the resulting calcium transients with line scans across the apical dendrite 50, 100, 125, 150, 175 and 200 μm from the soma.
The resting fluorescence of OGB-1 was ~25% higher in neurons from 2 month-old Tg+ mice, relative to neurons from Tg− littermates. OGB-1 fluorescence was elevated throughout the apical dendrite (figure 4D). Hence the resting intracellular calcium concentration was higher in the apical dendrites of neurons from Tg+ than Tg− mice.
Figure 4. Altered calcium metabolism in the apical dendrites of 2 month-old Tg+ mice.

(A) Maximum intensity projection of the apical dendritic arbor of a CA1 pyramidal neuron filled with OGB-1 and Alexa 594. Dashed line: locations at which calcium transients were measured (50, 100, 150 and 200 μm from the soma). The soma and somatic recording pipette are on the left of the image. (B) Example calcium transients evoked by a single action potential in the neuron in A. The left-most panel shows raw OGB-1 (green) and Alexa 594 (red) signals from a single trial, measured 50 μm from the soma. Fluorescence is shown on an arbitrary fluorescence scale, with a zero fluorescence baseline. (C) Examples of AP-evoked fluorescence transients in the neuron in A. Transients were evoked by a single AP. Measurements 50, 100, 150 μm from the soma are single trials. The 200 μm measurement is the average of 13 trials. (D) Mean (± SEM) resting G/R ratios from Tg+ and Tg− mice, measured in the apical dendrite 50 to 200 μm from the soma. n = 9 Tg− (blue) and 7 Tg+ (red) neurons. (E) Peak amplitudes and decay time constants for calcium transients evoked by 1-4 APs, measured 50 μm from the soma. n = 9 Tg− and 7 Tg+ neurons. (F) Peak amplitudes of calcium transients evoked by 1-4 APs, measured 175 μm from the soma. n = 8 Tg− and 6 Tg+ neurons. (G) Peak amplitudes of calcium transients evoked by single APs as a function of distance from the soma. n = 9 Tg− and 7 Tg+ neurons.
AP-evoked calcium transients measured in the proximal apical dendrite, 50 μm from the soma, were not different in neurons from Tg+ and Tg− mice (figure 4E). The calcium transients evoked by APs summed linearly during a burst of up to 4 APs (figure 4E), demonstrating that the indicator was not nearing saturation in either Tg+ or Tg− mice, even after 4APs.
In both Tg+ and Tg− mice, the amplitudes of calcium signals evoked by a single AP declined with distance into the apical dendrite, as described previously (Spruston et al., 1995; Waters et al., 2005). This decline results from the decrease in AP amplitude during propagation into the apical dendrite, which causes the opening of fewer calcium channels in the distal than in the proximal dendrite (Spruston et al., 1995; Waters et al., 2005). The decline in amplitude of the calcium transient was greater in neurons from Tg+ than from Tg− mice (figure 4G). For example, 175 μm from the soma calcium signals evoked by 1, 2, 3 and 4 APs were all of smaller amplitude in Tg+ than in Tg− mice (figure 4F). At this location, calcium signals in response to a single AP were detectable in Tg−, but not Tg+ mice. Hence AP-evoked dendritic calcium signals are impaired in CA1 pyramidal neurons from 2 month-old Tg+ mice. This is consistent with impaired propagation of the narrow AP into the apical dendrite in Tg+ mice and is likely to affect synaptic plasticity in these dendrites.
3.4 Cellular effects precede deficits in synaptic transmission
To determine whether these changes in the AP waveform and calcium metabolism precede or follow synaptic dysfunction in CRND8 mice, we characterized synaptic transmission onto CA1 pyramidal neurons. We examined three common measures of synaptic transmission: the paired-pulse ratio, the AMPA/NMDA ratio and miniature EPSPs.
We delivered paired stimuli at frequencies of 5-40 Hz (inter-stimulus intervals of 25-200 ms; figure 5A). As expected, we observed paired-pulse facilitation which increased with paired-pulse frequency. The degree of facilitation was no different in neurons from Tg+ and Tg− mice at 2, 4 or 6 months of age (figure 5B).
Figure 5. Synaptic transmission in young Tg+ and Tg− mice.

(A) Four overlaid traces showing EPSCs recorded from a 2 month-old Tg− mouse. Paired-pulse protocol with inter-pulse intervals of 25, 50, 100 and 200 ms. (B) Paired-pulse ratios at 2, 4 and 6 months of age. 2 months n = 6 Tg− and 5 Tg+ neurons; 4 months n = 11 Tg− and 13 Tg+ neurons; 6 months n = 8 Tg− and 8 Tg+ neurons. (C) Examples of EPSCs recorded from a 4 month-old Tg+ mouse at −60 and + 40 mV, from which AMPA/NMDA ratios were calculated. (D) AMPA/NMDA ratios in Tg+ and Tg− mice at 2 and 4 months of age. 2 months n = 4 Tg− and 3 Tg+ neurons; 4 months n = 5 Tg− and 6 Tg+ neurons. (E) Miniature EPSCs (mEPSCs) recorded from a 2 month-old Tg+ mouse. (F) mEPSC frequency and amplitude at 2, 3 and 4 months of age. 2 months n = 10 Tg− and 10 Tg+ neurons; 3 months n = 5 Tg− and 6 Tg+ neurons; 4 months n = 7 Tg− and 10 Tg+ neurons.
Next we measured the AMPA/NMDA ratio in 2 and 4 month-old mice. The AMPA/NMDA ratio is likely to change if Aβ has selective effects on synaptic AMPA or NMDA receptors, as has been suggested in other mouse models of APP overexpression and following application of Aβ oligomers (Snyder et al., 2005). We measured AMPA and NMDA receptor-mediated currents at −70 and +40 mV, respectively (figure 5C). The AMPA/NMDA ratio was similar in neurons from Tg+ and Tg− mice at 2 and 4 months of age.
Finally we monitored miniature EPSCs (mEPSCs) at −70mV in 1 μM tetrodotoxin (figure 5F). There was no difference in the frequency or amplitude of mEPSCs in neurons from Tg+ and Tg− mice at 2, 3 or 4 months of age (figure 5F).
Hence we observed no differences in synaptic transmission in mice up to 4 months old and conclude that the changes in AP waveform and calcium metabolism in CA1 pyramidal neurons precede dysfunction of synaptic transmission in the Schaeffer collateral pathway in CRND8 mice.
3.5 Pharmacological relief of the difference in action potential waveform
In CA1 pyramidal neurons, the AP waveform is determined principally by sodium and potassium currents (Bean, 2007). It is likely, therefore, that the difference in AP waveform between Tg+ and Tg− mice results from a difference in one or more sodium or potassium currents. There are at least four potassium currents that can affect AP waveform in CA1 pyramidal neurons, principally by increasing its rate of decay (Bean, 2007): an A-type current (IA; Martina et al., 1998; Kim et al., 2005), a D-type current (ID; Wu & Barish, 1992; Grissmer et al., 1994; Martina et al., 1998; Golding et al., 1999), a 4-aminopyridine (4-AP)-sensitive fast delayed rectifier current (IK,4-AP; Massengill et al., 1997; Martina et al., 1998) and a large-conductance calcium-activated current (IK,Ca; Shao et al., 1999). During a train of APs, the relative levels of activation of these potassium currents change as a result of their different activation and inactivation characteristics. IA and IK,Ca inactivate during a train of APs, resulting in progressive broadening of APs (Ma & Koester, 1995; Shao et al., 1999; Kim et al., 2005). Enhancing IA or IK,Ca therefore results in a narrow, rapidly decaying AP and enhanced broadening and slowing of AP decay during a train. If IA or IK,Ca were enhanced in Tg+ mice, this would therefore result in a convergence of AP half widths and decay times during trains in Tg+ and Tg− mice. In contrast ID and IK,4-AP display increasing activation during a train of APs (Ma & Koester, 1995; Golding et al., 1999), resulting in a narrow, rapidly decaying AP and decreased broadening during a train. The difference between AP width and decay time in Tg+ and Tg− mice increases during trains of APs (figure 3), suggesting the likely involvement of ID and/or IK,4-AP.
To determine which of these currents might be altered in CRND8 mice, we compared AP waveforms in neurons from Tg+ and Tg− mice in the presence of blockers of these currents. The difference in AP waveform between Tg+ and Tg− mice was eliminated by 300 μM tetraethylammonium ions (TEA), which block IK,4-AP and IK,Ca. The difference was also eliminated by 100 μM 4-AP, which blocks IK,4-AP and ID. 100 nM dendrotoxin, which blocks ID, failed to eliminate the difference in AP waveform. These results suggest that a fast delayed rectifier might be responsible for the difference in AP waveform between Tg+ an Tg− mice.
3.6 Expression pattern of Kv 3.1b may be altered in 2 month-old CRND8 mice
A narrowing in AP waveform via an effect on a fast delayed rectifier might result from a change in the properties or from increased expression of the current. Hence we next examined levels of expression of several sodium and potassium currents that might be involved in shaping the AP waveform in CA1 pyramidal neurons. We performed immunohistochemistry using primary antibodies against the main genes expressed in CA1 pyramidal neurons (table S3), corresponding to a slow delayed rectifier (IK; Kv 1.1 and Kv 1.2), IK,4-AP (Kv 3.1b), IA (Kv 4.2, Kv 4.3), IK,Ca (SLO1) and two sodium currents (Nav 1.1 and Nav 1.2).
For all of these antibodies, staining patterns for both Tg+ and Tg− mice were similar to published results (figure 7A). Overall immunofluorescence intensities were also similar in sections from Tg+ and Tg− mice for all 8 antibodies (figure 7B). However, there was a difference in the relative intensities of anti-Kv 3.1b immunofluorescence in stratum radiatum, oriens and pyramidale. For each section, we calculated a ‘fluorescence distribution ratio’ by dividing the immunofluorescence in stratum pyramidale by the mean fluorescence of stratum oriens and stratum radiatum. This ratio normalizes for any variation in staining between slices. We found that the fluorescence distribution ratio for Kv 3.1b was significantly greater in hippocampi from in Tg+ than Tg− mice, while the distribution ratios were not different for any of the other 8 channels. These results suggest that there is a change in expression or accumulation of Kv 3.1b in Tg+ mice. This change is selective in that no such changes occur for the other channels examined. Hence our immunohistochemistry results are consistent with a narrowing of AP waveform as a result of increased expression or redistribution of a Kv3-type fast delayed rectifier potassium current in CA1 hippocampal pyramidal neurons in Tg+ CRND8 mice.
Figure 7. Channel immunohistochemistry in 2 month-old CRND8 mice.

(A) Widefield images of hippocampi from 2 month-old Tg+ mice stained for several potassium and sodium channels. Intensities were inverted for display purposes. (B) Fluorescence intensities in CA1 (arbitrary intensity units). Intensities were averaged across stratum oriens, stratum pyramidale and stratum radiatum. There was no significant difference in intensity between 2 month-old Tg+ and Tg− mice immunostained with any of the anti-bodies tested. Each bar is the mean (+/− SEM) of 3-7 mice, with 3-6 sections from each mouse. (C) Immuofluorescence intensities in straum oriens and radiatum normalized to the intensity in stratum pyramidale in CA1. Fluorescence intensity differed between 2 month-old Tg+ and Tg− mice only for Kv3.1b (asterisk denotes P<0.05, unpaired t-test).
4. DISCUSSION
We have identified two intrinsic cellular properties of CA1 hippocampal pyramidal neurons that differ between Tg+ CRND8 mice and Tg− littermates: neurons from Tg+ mice have narrow action potentials, with a rapid decay, and an elevated resting intracellular calcium concentration. Both of these differences exist before plaque formation and before profound synaptic dysfunction. Of the many functional parameters studied, only these two differences were observed, suggesting that these two differences are probably the earliest functional changes in pyramidal neurons.
Accumulation of Aβ, following overexpression of human APP, is the principle distinctions between Tg+ and Tg− CRND8 mice. Hence it is likely that these differences in CA1 pyramidal neurons result from exposure to Aβ. Since these changes occur before plaque formation, the narrowing of the action potential and increase in resting intracellular calcium are likely to be effects of soluble forms of Aβ.
4.1 Mechanism underlying narrow APs in CRND8 mice
Our pharmacology experiments suggest that changes in a fast delayed rectifier current underlie the narrow action potential in Tg+ CRND8 mice. However, these pharmacology experiments do not conclusively identify the fast delayed rectifier as the responsible current. Although non-selective at high concentrations, TEA and 4-AP are selective blockers of IK,4-AP and IK,Ca and of IK,4-AP, IA and ID, respectively, in CA1 pyramidal neurons at the concentrations employed here (Rettig et al., 1992; Grissmer et al., 1994; Martina et al., 1998). However, blocking one ion channel can affect the roles of other ions channels involved in repolarization after the AP (e.g. Ma & Koester, 1995; Ma & Koester, 1996). Hence it is possible that the effects of TEA and 4-AP involve another ion current that participates in repolarization of the AP.
Our immunohistochemistry experiments support the suggestion that expression of a fast delayed rectifier is altered in Tg+ CRND8 mice. Firstly we found that the expression levels and patterns of many channels involved in repolarization of the AP are similar in Tg+ and Tg− mice. Immunohistochemistry is probably only sensitive enough to detect substantial changes in expression of these channels, and we cannot therefore exclude some changes in other channels. However, we found that the pattern of expression of only Kv3.1b was significantly altered in CRND8 mice. The Kv3 family is the principle family of fast delayed rectifier potassium channels expressed in hippocampus (Weiser et al., 1994). Kv3 channels are expressed in hippocampal pyramidal neurons, although the current density is lower than in interneurons, where Kv3-family currents contribute to rapid repolarization after the action potential (Weiser et al., 1994; Martina et al., 1998). Hence Kv3 expression was not limited to pyramidal neurons in our experiments and we were unable to determine whether the altered pattern of expression of Kv3.1b reflects expression by pyramidal neurons or other cells within the hippocampus.
Together, our pharmacology and immunohistochemistry results indicate that increased expression of Kv3 channels is the likely mechanism underlying the narrow AP in CA1 hippocampal pyramidal neurons in Tg+ CRND8 mice.
4.2 Effects of Aβ on ion channels
There are many reports of effects of Aβ on plasma membrane potassium channels. For example, Aβ can enhance IA (Plant et al., 2006; Kerrigan et al., 2008), suppress IA, (Good et al., 1996; Chen, 2005), enhance IK,Ca (Ye et al., 2010), suppress IK,Ca (Qi & Qiao, 2001; Coles et al., 2008) and enhance Kv3.4 currents (Angulo et al., 2004; Pannaccione et al., 2007). How these effects depend on the species and concentration of Aβ and the duration of exposure to Aβ are unclear, making it difficult to assess which ion channels are most sensitive to the various forms of Aβ and how these changes might relate to the different stages of AD. Here we have described changes in potassium channels in the hippocampus of an established mouse model of APP overexpression. Our results suggest that, in CA1 hippocampal pyramidal neurons, the Kv3 family of ion channels are the first to be affected by prolonged exposure to a mixture of Aβ species, as occurs in AD.
4.3 Effects of Aβ on calcium metabolism
The second difference we observed between Tg+ and Tg− CRND8 mice is elevated resting calcium in Tg+ mice. Aβ has long been associated with dysfunctional calcium metabolism (Bezprozvanny & Mattson, 2008; Green & LaFerla, 2008; Camandola & Mattson, 2010). Application of Aβ can elevate intracellular calcium concentration in neurons (Mattson et al., 1992) and resting intracellular calcium may be elevated close to plaques in APP overexpressing mice (Kuchibhotla et al., 2008). Presenilin mutations have also been linked with dysregulation of calcium homeostasis (Stutzmann, 2005).
CRND8 mice do not carry a presenilin mutation. Hence the elevation in resting intracellular calcium in CA1 pyramidal neurons in CNRD8 mice, observed here, probably results from Aβ overexpression. Furthermore, in our experiments resting calcium was elevated in young mice, before plaque formation, implicating soluble Aβ species in calcium dysregulation.
The signalling pathways underlying Aβ-mediated calcium dysfunction are poorly understood but are thought to involve oxidative stress pathways (Camandola & Mattson, 2010) or aberrant ryanodine receptor function (Supnet et al., 2006). Aβ oligomers can also affect intracellular calcium concentrations by forming calcium permeable pores in the plasma membrane (Zhu et al., 2000) and by modulating influx through L-type calcium channels (Ueda et al., 1997; Ekinci et al., 1999). Ryanodine receptor function is known to be impaired in CRND8 mice (Supnet et al., 2006), but more research will be required to determine whether other mechanisms are also involved in elevating the resting intracellular calcium concentration in CRND8 mice.
Are the narrow AP and elevated resting calcium linked? We have demonstrated that one of the consequences of the narrow AP is a reduction in dendritic calcium influx during spiking. It is therefore tempting to speculate that the narrow AP is a homeostatic mechanism to reduce the calcium load, which occurs in response to the elevated resting calcium concentration.
4.4 Physiological and pathological consequences of the narrow AP
Whether or not the narrow AP is a compensatory mechanism, it is likely to have unfortunate consequences for the hippocampal network. Firstly a narrow AP might be prone to fail at branch points in the axonal tree (Goldstein & Rall, 1974) and when propagation occurs, a narrow AP may evoke relatively little calcium influx and transmitter release at presynaptic terminals. In CRND8 mice, the narrow AP might weaken signaling from CA1 pyramidal cells to their target neurons.
The narrow AP is also likely to affect dendritic function in CA1 pyramidal neurons. APs propagating into the apical dendritic tree, and the resulting calcium influx, play an important role in the induction of long-term synaptic plasticity, both long-term depression and long-term potentiation (Sjöström & Nelson, 2002; Waters et al., 2008). The suppression of AP-evoked dendritic calcium influx, as shown here, may contribute to the changes in long-term potentiation and depression in CA1 pyramidal neurons, described in CRND8 mice and many other APP-overexpressing mouse lines (Chapman et al., 1999; Jolas et al., 2002; Brown et al., 2005; Jacobsen et al., 2006; Dewachter et al., 2007; Knobloch et al., 2007). Long-term potentiation and depression are thought to be cellular substrates of learning and memory and the hippocampus is intimately associated with learning and memory and one of the early sites of degeneration in AD. The narrow AP in CA1 pyramidal neurons and resulting dysfunctional synaptic plasticity in hippocampus may therefore contribute to the learning and memory deficits observed in APP-overexpressing mice and in AD patients.
Here we have described changes in the intrinsic physiology of CA1 hippocampal pyramidal neurons in CRND8 mice. The changes we have described occur before plaque formation and before overt changes in synaptic function. Changes in synaptic function and the intrinsic properties of neurons will both influence information flow through the hippocampal network and our results therefore indicate that the effects of Aβ on CA1 pyramidal neurons are likely to combine with the well-known effects of Aβ on synaptic transmission to disrupt hippocampal network function. Indeed, since cellular changes precede synaptic dysfunction, the cellular effects may well be the primary basis of the earliest effects of Aβ on hippocampal networks.
Supplementary Material
Supplementary figure 1. Plaque count from thioflavin fluorescence (A) Example of a thioflavin-stained section from a 6 month-old Tg+ mouse. To count plaques, images were thresholded. Upper left: brightfield image. Upper right: widefield fluorescence image. Lower left: Intensity histogram for the fluorescence image, shown on both linear and log scales. Threshold is dashed vertical line. Suprathreshold values shown in red. Lower right: thresholded image, with suprathreshold pixels (plaques) in red. (B) Plaque load, expressed as % of pixels with intensities above the threshold value, as a function of age. Each data point is the mean (± SEM) of 4 sections from 2 mice.
Supplementary figure 2. AP waveforms in CA1 pyramidal neurons from 1 week- and 1 month-old CRND8 mice Mean (± SEM) inter-spike interval, AP threshold, AP amplitude, AP half width, 10-90% rise time and 10-90% decay time during trains of 10 APs in Tg+ (red) and Tg− (blue) mice.
Figure 6. Pharmacological blockade of difference in AP waveform.

(A-C) Effects of potassium channel blockers on the 90-10% decay times of action potentials in 2 month-old CRND8 mice. Decay times are reported for trains for 10 APs. Each symbol is the mean ± SEM for Tg− (blue) or Tg+ mice (red). In each recording decay times were measured first under control conditions (left) and the after application of blocker (right). (A) Effect of 300 μM tetraethylammonium chloride (TEA-Cl); n = 5 Tg− and 6 Tg+ neurons. Decay times were significantly different under control conditions (P<0.05) and this difference was eliminated by TEA (P>0.05). (B) Effect of 100 μM 4-aminopyridine (4-AP); n = 7 Tg− and 6 Tg+ neurons. Decay times were significantly different under control conditions (P<0.05) and this difference was eliminated by 4-AP (P>0.05). (C) No effect of 100 nM dendrotoxin (DTX); n = 10 Tg− and 10 Tg+ neurons. Decay times were significantly different under control conditions (P<0.05) and in DTX (P<0.05).
ACKNOWLEDGEMENTS
We thank Becky Imhoff for technical assistance and Pavel Osten, Bob Vassar, Marco Martina, Murali Prakriya and Anis Contractor for discussions. The project was supported by NIRG-06-25509 from the Alzheimer’s Association and 5R21AG029282-02 from the National Institute on Aging.
Footnotes
Publisher's Disclaimer: This is a PDF file of an unedited manuscript that has been accepted for publication. As a service to our customers we are providing this early version of the manuscript. The manuscript will undergo copyediting, typesetting, and review of the resulting proof before it is published in its final citable form. Please note that during the production process errors may be discovered which could affect the content, and all legal disclaimers that apply to the journal pertain.
DISCLOSURE STATEMENT
There are no actual or potential conflict of interest including any financial, personal or other relationships with other people or organizations within three years of beginning the work submitted that could inappropriately influence (bias) this work. All experiments and procedures were approved by the Northwestern University Institutional Animal Care and Use Committee (IACUC).
REFERENCES
- Ambrée O, Touma C, Görtz N, Keyvani K, Paulus W, Palme R, Sachser N. Activity changes and marked stereotypic behavior precede Aβ pathology in TgCRND8 Alzheimer mice. Neurobiol Aging. 2006;27:955–964. doi: 10.1016/j.neurobiolaging.2005.05.009. [DOI] [PubMed] [Google Scholar]
- Angulo E, Noé V, Casadó V, Mallol J, Gomez-Isla T, Lluis C, Ferrer I, Ciudad CJ, Franco R. Up-regulation of the Kv3.4 potassium channel subunit in early stages of Alzheimer’s disease. J Neurochem. 2004;10:547–557. doi: 10.1111/j.1471-4159.2004.02771.x. [DOI] [PubMed] [Google Scholar]
- Arispe N, Rojas E, Pollard HB. Alzheimer disease amyloid beta protein forms calcium channels in bilayer membranes: blockade by tromethamine and aluminum. PNAS. 1993;90:567–571. doi: 10.1073/pnas.90.2.567. [DOI] [PMC free article] [PubMed] [Google Scholar]
- Bean BP. The action potential in mammalian central neurons. Nat Rev Neurosci. 2007;8:451–465. doi: 10.1038/nrn2148. [DOI] [PubMed] [Google Scholar]
- Bezprozvanny I, Mattson MP. Neuronal calcium mishandling and the pathogenesis of Alzheimer’s disease. Trends Neurosci. 2008;31:454–463. doi: 10.1016/j.tins.2008.06.005. [DOI] [PMC free article] [PubMed] [Google Scholar]
- Brown JT, Richardson JC, Collingridge GL, Randall AD, Davies CH. Synaptic transmission and synchronous activity is disrupted in hippocampal slices taken from aged TAS10 mice. Hippocampus. 2005;15(1):110–7. doi: 10.1002/hipo.20036. [DOI] [PubMed] [Google Scholar]
- Camandola S, Mattson MP. Aberrant subcellular neuronal calcium regulation in aging and Alzheimer’s disease. Biochim Biophys Acta. 2010 doi: 10.1016/j.bbamcr.2010.10.005. in press. [DOI] [PMC free article] [PubMed] [Google Scholar]
- Chauhan NB, Siegel GJ, Lichtor T. Effect of age on the duration and extent of amyloid plaque reduction and microglial activation after injection of anti-Abeta antibody into the third ventricle of TgCRND8 mice. J Neurosci Res. 2004;78(5):732–41. doi: 10.1002/jnr.20298. [DOI] [PubMed] [Google Scholar]
- Chapman PF, White GL, Jones MW, Cooper-Blacketer D, Marshall VJ, Irizarry M, Younkin L, Good MA, Bliss TV, Hyman BT, Younkin SG, Hsiao KK. Impaired synaptic plasticity and learning in aged amyloid precursor protein transgenic mice. Nat Neurosci. 1999;(3):271–6. doi: 10.1038/6374. [DOI] [PubMed] [Google Scholar]
- Chen C. β-Amyloid increases dendritic Ca2+ influx by inhibiting the A-type K+ current in hippocampal CA1 pyramidal neurons. Biochem Biophys Res Commun. 2005;338:1913–1919. doi: 10.1016/j.bbrc.2005.10.169. [DOI] [PubMed] [Google Scholar]
- Chishti MA, Yang D-S, Janus C, Phinney AL, Horne P, Pearson J, Strome R, Zuker N, Loukides J, French J, Turner S, Lozza G, Grilli M, Kunicki S, Morissette C, Paquette J, Gervais F, Bergeron C, Fraser PE, Carlson GA, St. George-Hyslop P, Westaway D. Early-onset amyloid deposition and cognitive deficits in transgenic mice expressing a double mutant form of amyloid precursor protein 695. J Biol Chem. 2001;276:21562–21570. doi: 10.1074/jbc.M100710200. [DOI] [PubMed] [Google Scholar]
- Clements JD, Bekkers JM. Detection of spontaneous synaptic events with an optimally scaled template. Biophys J. 1997;73:220–9. doi: 10.1016/S0006-3495(97)78062-7. [DOI] [PMC free article] [PubMed] [Google Scholar]
- Coles B, Wilton LAK, Good M, Chapman PF, Wann KT. Potassium channels in hippocampal neurones are absent in a transgenic but not in a chemical model of Alzheimer’s disease. Brain Res. 2008;1190:1–14. doi: 10.1016/j.brainres.2007.10.071. [DOI] [PubMed] [Google Scholar]
- Dewachter I, Filipkowski RK, Priller C, Ris L, Neyton J, Croes S, Terwel D, Gysemans M, Devijver H, Borghgraef P, Godaux E, Kaczmarek L, Herms J, Van Leuven F. Deregulation of NMDA-receptor function and down-stream signaling in APP[V717I] transgenic mice. Neurobiol Aging. 2007;(2):241–56. doi: 10.1016/j.neurobiolaging.2007.06.011. [DOI] [PubMed] [Google Scholar]
- Ekinci FJ, Malik KU, Shea TB. Activation of the L voltage-sensitive calcium channel by mitogen-activated protein (MAP) kinase following exposure of neuronal cells to β-amyloid. J Biol Chem. 1999;274:30322–30327. doi: 10.1074/jbc.274.42.30322. [DOI] [PubMed] [Google Scholar]
- Golding NL, Jung H-Y, Mickus T, Spruston N. Dendritic calcium spike initiation and repolarization are controlled by distinct potassium channel subtypes in CA1 pyramidal neurons. J Neurosci. 1999;19:8789–8798. doi: 10.1523/JNEUROSCI.19-20-08789.1999. [DOI] [PMC free article] [PubMed] [Google Scholar]
- Goldstein SS, Rall W. Changes of action potential shape and velocity for changing core conductor geometry. Biophys J. 1974;14:731–757. doi: 10.1016/S0006-3495(74)85947-3. [DOI] [PMC free article] [PubMed] [Google Scholar]
- Good TA, Smith DO, Murphy RM. β-amyloid peptide blocks the fast-inactivating k+ current in rat hippocampal neurons. Biophys J. 1996;70:296–304. doi: 10.1016/S0006-3495(96)79570-X. [DOI] [PMC free article] [PubMed] [Google Scholar]
- Green KN, LaFerla FM. Linking calcium to Aβ and Alzheimer’s Disease. Neuron. 2008;59:190–194. doi: 10.1016/j.neuron.2008.07.013. [DOI] [PubMed] [Google Scholar]
- Grissmer S, Nguyen AN, Aiyar J, Hanson DC, Mather RJ, Gutman GA, Karmilowicz MJ, Auperin DD, Chandy KG. Pharmacological characterization of five cloned voltage-gated K+ channels, types Kv1.1, 1 .2, 1 .3, 1 .5, and 3.1, stably expressed in mammalian cell lines. Molecular Pharmacology. 1994;45:1227–1234. [PubMed] [Google Scholar]
- Guntern R, Bouras C, Hof PR, Vallet PG. An improved thioflavine S method for staining neurofibrillary tangles and senile plaques in Alzheimer’s disease. Experientia. 1992;48:8–10. doi: 10.1007/BF01923594. [DOI] [PubMed] [Google Scholar]
- Hardy J. A hundred years of Alzheimer’s disease research. Neuron. 2006;52:3–13. doi: 10.1016/j.neuron.2006.09.016. [DOI] [PubMed] [Google Scholar]
- Hardy J, Selkoe DJ. The amyloid hypothesis of Alzheimer’s disease: progress and problems on the road to therapeutics. Science. 2002;297:353–356. doi: 10.1126/science.1072994. [DOI] [PubMed] [Google Scholar]
- Hsia AY, Masliah E, McConlogue L, Yu G-Q, Tatsuno G, Hu K, Kholodenko D, Malenka RC, Nicoll RA, Mucke L. Plaque-independent disruption of neural circuits in Alzheimer’s disease mouse models. PNAS. 1999;96(6):3228–3233. doi: 10.1073/pnas.96.6.3228. [DOI] [PMC free article] [PubMed] [Google Scholar]
- Hyde LA, Kazdoba TM, Grilli M, Lozza G, Brussa R, Zhang Q, Wong GT, McCool MF, Zhang L, Parker EM, Higgins GA. Age-progressing cognitive impairments and neuropathology in transgenic CRND8 mice. Behavioural Brain Research. 2005;160:344–355. doi: 10.1016/j.bbr.2004.12.017. [DOI] [PubMed] [Google Scholar]
- Jacobsen JS, Wu CC, Redwine JM, Comery TA, Arias R, Bowlby M, Martone R, Morrison JH, Pangalos MN, Reinhart PH, Bloom FE. Early-onset behavioral and synaptic deficits in a mouse model of Alzheimer’s disease. PNAS. 2006;103(13):5161–6. doi: 10.1073/pnas.0600948103. [DOI] [PMC free article] [PubMed] [Google Scholar]
- Jolas T, Zhang X-S, Zhang Q, Wong G, Del Vecchio R, Gold L, Priestley T. Long-term potentiation is increased in the CA1 area of the hippocampus of APPswe/ind CRND8 mice. Neurobiol Disease. 2002;11:394–409. doi: 10.1006/nbdi.2002.0557. [DOI] [PubMed] [Google Scholar]
- Kerrigan TL, Atkinson L, Peers C, Pearson HA. Modulation of ‘A’-type K+ current by rodent and human forms of amyloid β protein. Neuroreport. 2008;19:839–843. doi: 10.1097/WNR.0b013e3282ff636b. [DOI] [PubMed] [Google Scholar]
- Kim JH, Anwyl R, Suh YH, Djamgoz MB, Rowan MJ. Use-dependent effects of amyloidogenic fragments of (beta)-amyloid precursor protein on synaptic plasticity in rat hippocampus in vivo. J Neurosci. 2001;21(4):1327–33. doi: 10.1523/JNEUROSCI.21-04-01327.2001. [DOI] [PMC free article] [PubMed] [Google Scholar]
- Kim J, Wei D-S, Hoffman DA. Kv4 potassium channel subunits control action potential repolarization and frequency-dependent broadening in rat hippocampal CA1 pyramidal neurons. JPhysiol. 2005;569.1:41–57. doi: 10.1113/jphysiol.2005.095042. [DOI] [PMC free article] [PubMed] [Google Scholar]
- Kim KS, Miller DL, Sapienza VJ, Chen C-MJ, Bai C, Grundke-Iqbal I, Currie JR, Wisniewski HM. Production and characterization of monoclonal antibodies reactive to synthetic cerebrovascular amyloid peptide. Neurosci Res Comm. 1988;2:121–130. [Google Scholar]
- Kim KS, Wen GY, Bancher C, Chen CMJ, Sapienza VJ, Hong H, Wisniewski HM. Detection and quantitation of amyloid β-peptide with 2 monoclonal antibodies. Neurosci Res Comm. 1990;7:113–122. [Google Scholar]
- Knobloch M, Farinelli M, Konietzko U, Nitsch RM, Mansuy IM. Abeta oligomer-mediated long-term potentiation impairment involves protein phosphatase 1-dependent mechanisms. J Neurosci. 2007;27(29):7648–53. doi: 10.1523/JNEUROSCI.0395-07.2007. [DOI] [PMC free article] [PubMed] [Google Scholar]
- Kuchibhotla KV, Goldman ST, Lattarulo CR, Wu H-Y, Hyman BT, Bacskai BJ. Aβ plaques lead to aberrant regulation of calcium homeostasis in vivo resulting in structural and functional disruption of neuronal networks. Neuron. 2008;59:214–225. doi: 10.1016/j.neuron.2008.06.008. [DOI] [PMC free article] [PubMed] [Google Scholar]
- Larson J, Lynch G, Games D, Seubert P. Alterations in synaptic transmission and long-term potentiation in hippocampal slices from young and aged PDAPP mice. Brain Res. 1999;840(1-2):23–35. doi: 10.1016/s0006-8993(99)01698-4. [DOI] [PubMed] [Google Scholar]
- LeVine H. Quantification of β-sheet amyloid fibril structures with thioflavin T. Methods Enzymol. 1999;309:274–284. doi: 10.1016/s0076-6879(99)09020-5. [DOI] [PubMed] [Google Scholar]
- Li S, Hong S, Shepardson NE, Walsh DM, Shankar GM, Selkoe D. Soluble oligomers of amyloid β protein facilitate hippocampal long-term depression by disrupting neuronal glutamate uptake. Neuron. 2009;62:788–801. doi: 10.1016/j.neuron.2009.05.012. [DOI] [PMC free article] [PubMed] [Google Scholar]
- Ma M, Koester J. Consequences and mechanisms of spike broadening of R20 cells in Aplysia californica. J Neurosci. 1995;15:6720–6734. doi: 10.1523/JNEUROSCI.15-10-06720.1995. [DOI] [PMC free article] [PubMed] [Google Scholar]
- Ma M, Koester J. The role of K+ currents in frequency-dependent spike broadening in Aplysia R20 neurons: a dynamic-clamp analysis. J Neurosci. 1996;16:4089–4101. doi: 10.1523/JNEUROSCI.16-13-04089.1996. [DOI] [PMC free article] [PubMed] [Google Scholar]
- Martina M, Schultz JH, Ehmke H, Monyer H, Jonas P. Functional and molecular differences between voltage-gated K+ channels of fast-spiking interneurons and pyramidal neurons of rat hippocampus. J Neurosci. 1998;18:8111–8125. doi: 10.1523/JNEUROSCI.18-20-08111.1998. [DOI] [PMC free article] [PubMed] [Google Scholar]
- Massengill J, Smith MA, Son DI, O’Dowd DK. Differential expression of K4-AP currents and Kv3.1 potassium channel transcripts in cortical neurons that develop distinct firing phenotypes. J Neurosci. 1997;17:3136–3147. doi: 10.1523/JNEUROSCI.17-09-03136.1997. [DOI] [PMC free article] [PubMed] [Google Scholar]
- Mattson MP, Cheng B, Davis D, Bryant K, Lieberburg I, Rydel RE. β-amyloid peptides destabilize calcium homeostasis and render human cortical neurons vulnerable to excitotoxicity. J Neurosci. 1992;12:376–389. doi: 10.1523/JNEUROSCI.12-02-00376.1992. [DOI] [PMC free article] [PubMed] [Google Scholar]
- Nomura I, Kato N, Kita T, Takechi H. Mechanism of impairment of long-term potentiation by amyloid beta is independent of NMDA receptors or voltage-dependent calcium channels in hippocampal CA1 pyramidal neurons. Neurosci Lett. 2005;391(1-2):1–6. doi: 10.1016/j.neulet.2005.08.024. [DOI] [PubMed] [Google Scholar]
- Oertner TG, Sabatini BL, Nimchinsky EA, Svoboda K. Facilitation at single synapses probed with optical quantal analysis. Nat Neurosci. 2002;5:657–664. doi: 10.1038/nn867. [DOI] [PubMed] [Google Scholar]
- Palop JJ, Mucke L. Amyloid-β-induced neuronal dysfunction in Alzheimer’s disease: from synapses toward neural networks. Nat Neurosci. 2010;13:812–818. doi: 10.1038/nn.2583. [DOI] [PMC free article] [PubMed] [Google Scholar]
- Pannaccione A, Boscia F, Scorziello A, Adornetto A, Castaldo P, Sirabella R, Taglialatela M, Di Renzo GF, Annunziato L. Up-regulation and increased activity of Kv3.4 channels and their accessory subunit MinK-related peptide 2 induced by amyloid peptide are involved in apoptotic neuronal death. Mol Pharm. 2007;72:665–673. doi: 10.1124/mol.107.034868. [DOI] [PubMed] [Google Scholar]
- Plant LD, Webster NJ, Boyle JP, Ramsden M, Freir DB, Peers C, Pearson HA. Amyloid β peptide as a physiological modulator of neuronal ‘A’-type K+ current. Neurobiol Aging. 2006;27:1673–1683. doi: 10.1016/j.neurobiolaging.2005.09.038. [DOI] [PubMed] [Google Scholar]
- Qi JS, Qiao JT. Suppression of large conductance Ca2+-activated K+ channels by amyloid β-protein fragment 31-35 in membrane patches excised from hippocampal neurons. Acta Phys Sinica. 2001;53:198–204. [PubMed] [Google Scholar]
- Ranck JBJ. Studies on single neurons in dorsal hippocampal formation and septum in unrestrained rats. I. Behavioral correlates and firing repertoires. Exp Neurol. 1973;41:461–531. doi: 10.1016/0014-4886(73)90290-2. [DOI] [PubMed] [Google Scholar]
- Raymond CR, Ireland DR, Abraham WC. NMDA receptor regulation by amyloid-beta does not account for its inhibition of LTP in rat hippocampus. Brain Res. 2003;968(2):263–72. doi: 10.1016/s0006-8993(03)02269-8. [DOI] [PubMed] [Google Scholar]
- Rettig J, Wunder F, Stocker M, Lichtinghagen R, Mastiaux F, Beckh S, Kues W, Pedarzani P, Schröter KH, Ruppersberg JP, Veh R, Pongs O. Characterization of a Shaw-related potassium channel family in rat brain. EMBO J. 1992;11:2473–2486. doi: 10.1002/j.1460-2075.1992.tb05312.x. [DOI] [PMC free article] [PubMed] [Google Scholar]
- Sabatini BL, Oertner TG, Svoboda K. The life cycle of Ca2+ ions in dendritic spines. Neuron. 2002;33:439–452. doi: 10.1016/s0896-6273(02)00573-1. [DOI] [PubMed] [Google Scholar]
- Shankar GM, Li S, Mehta TH, Garcia-Munoz A, Shepardson N, Smith I, Brett FM, Farrell MA, Rowan MJ, Lemere CA, Regan CM, Walsh DM, Sabatini BL, Selkoe DJ. Soluble amyloid-β protein dimers isolated directly from Alzheimer disease patients potently impair synaptic plasticity and memory. Nat Med. 2008;14:837–842. doi: 10.1038/nm1782. [DOI] [PMC free article] [PubMed] [Google Scholar]
- Shao L-R, Halvorsrud R, Borg-Graham L, Storm JF. The role of BK-type Ca2+-dependent K+ channels in spike broadening during repetitive firing in rat hippocampal pyramidal cells. J Physiol. 1999;521.1:135–146. doi: 10.1111/j.1469-7793.1999.00135.x. [DOI] [PMC free article] [PubMed] [Google Scholar]
- Sjöström PJ, Nelson SB. Spike timing, calcium signals and synaptic plasticity. Curr Opin Neurobiol. 2002;12:305–314. doi: 10.1016/s0959-4388(02)00325-2. [DOI] [PubMed] [Google Scholar]
- Small DH, Mok SS, Bornstein JC. Alzheimer’s disease and Aβ toxicity: from top to bottom. Nat Rev Neurosci. 2001;2:595–598. doi: 10.1038/35086072. [DOI] [PubMed] [Google Scholar]
- Snyder EM, Nong Y, Almeida CG, Paul S, Moran T, Choi EY, Nairn AC, Salter MW, Lombroso PJ, Gouras GK, Greengard P. Regulation of NMDA receptor trafficking by amyloid-β. Nat Neurosci. 2005;8:1051–1058. doi: 10.1038/nn1503. [DOI] [PubMed] [Google Scholar]
- Spruston N, Schiller Y, Stuart G, Sakmann B. Activity-dependent action potential invasion and calcium influx into hippocampal CA1 dendrites. Science. 1995;268:297–300. doi: 10.1126/science.7716524. [DOI] [PubMed] [Google Scholar]
- Stutzmann GE. Calcium dysregulation, IP3 signaling, and Alzheimer’s Disease. Neuroscientist. 2005;11:110–115. doi: 10.1177/1073858404270899. 2005. [DOI] [PubMed] [Google Scholar]
- Supnet C, Grant J, Kong H, Westaway D, Mayne M. Amyoid-β-(1-42) increases ryanodine receptor-3 expression and function in neurons of TgCRND8 mice. J Biol Chem. 2006;281:38440–38447. doi: 10.1074/jbc.M606736200. [DOI] [PubMed] [Google Scholar]
- Townsend M, Shankar GM, Mehta T, Walsh DM, Selkoe DJ. Effects of secreted oligomers of amyloid β-protein on hippocampal synaptic plasticity: a potent role for trimers. J Physiol. 2006;572.2:477–492. doi: 10.1113/jphysiol.2005.103754. [DOI] [PMC free article] [PubMed] [Google Scholar]
- Ueda K, Shinohara S, Yagami T, Asakura K, Kawasaki K. Amyloid β protein potentiates Ca2+ influx through L-type voltage-sensitive Ca2+ channels: a possible involvement of free radicals. J Neurochem. 1997;68:265–271. doi: 10.1046/j.1471-4159.1997.68010265.x. [DOI] [PubMed] [Google Scholar]
- Walsh DM, Klyubin I, Fadeeva JV, Cullen WK, Anwyl R, Wolfe MS, Rowan MJ, Selkoe DJ. Naturally secreted oligomers of amyloid beta protein potently inhibit hippocampal long-term potentiation in vivo. Nature. 2002;416:535–539. doi: 10.1038/416535a. [DOI] [PubMed] [Google Scholar]
- Wang H-W, Pasternak JF, Kuo H, Ristic H, Lambert MP, Chromy B, Viola KL, Klein WL, Stine WB, Krafft GA, Trommer BL. Soluble oligomers of β amyloid (1-42) inhibit long-term potentiation but not long-term depression in rat dentate gyrus. Brain Res. 2002;924:133–140. doi: 10.1016/s0006-8993(01)03058-x. [DOI] [PubMed] [Google Scholar]
- Wang Q, Walsh DM, Rowan MJ, Selkoe DJ, Anwyl R. Block of long-term potentiation by naturally secreted and synthetic amyloid beta-peptide in hippocampal slices is mediated via activation of the kinases c-Jun N-terminal kinase, cyclin-dependent kinase 5, and p38 mitogen-activated protein kinase as well as metabotropic glutamate receptor type 5. J Neurosci. 2004;24(13):3370–8. doi: 10.1523/JNEUROSCI.1633-03.2004. [DOI] [PMC free article] [PubMed] [Google Scholar]
- Waters J, Helmchen F. Background synaptic activity is sparse in neocortex. J Neurosci. 2006;26:8267–8277. doi: 10.1523/JNEUROSCI.2152-06.2006. [DOI] [PMC free article] [PubMed] [Google Scholar]
- Waters J, Nevian T, Sakmann B, Helmchen F. Action potentials in dendrites and spike-timing-dependent plasticity. In: David Sweatt J, Byrne J, editors. Molecular Mechanisms of Memory. Vol. 4 of Learning and Memory: A Comprehensive Reference. Elsevier; Oxford: 2008. pp. 803–828. 4 vols. [Google Scholar]
- Waters J, Schaefer A, Sakmann B. Backpropagating action potentials in neurones: measurement, mechanisms and potential functions. Prog Biophys Mol Biol. 2005;87:145–70. doi: 10.1016/j.pbiomolbio.2004.06.009. [DOI] [PubMed] [Google Scholar]
- Weiser M, Vega-Saenz de Miera E, Kentros C, Moreno H, Franzen L, Hillman D, Baker H, Rudy B. Differential expression of Shaw related K+ channels in the rat central nervous system. J Neurosci. 1994;14:949–972. doi: 10.1523/JNEUROSCI.14-03-00949.1994. [DOI] [PMC free article] [PubMed] [Google Scholar]
- Wu R-L, Barish ME. Two pharmacologically and kinetically distinct transient potassium currents in cultured embryonic mouse hippocampal neurons. J Neurosci. 1992;12:2235–2246. doi: 10.1523/JNEUROSCI.12-06-02235.1992. [DOI] [PMC free article] [PubMed] [Google Scholar]
- Ye H, Jalini S, Mylvaganam S, Carlen P. Activation of large-conductance Ca2+-activated K+ channels depresses basal synaptic transmission in the hippocampal CA1 area in APP (swe/ind) TgCRND8 mice. Neurobiol Aging. 2010;31:591–604. doi: 10.1016/j.neurobiolaging.2008.05.012. [DOI] [PubMed] [Google Scholar]
Associated Data
This section collects any data citations, data availability statements, or supplementary materials included in this article.
Supplementary Materials
Supplementary figure 1. Plaque count from thioflavin fluorescence (A) Example of a thioflavin-stained section from a 6 month-old Tg+ mouse. To count plaques, images were thresholded. Upper left: brightfield image. Upper right: widefield fluorescence image. Lower left: Intensity histogram for the fluorescence image, shown on both linear and log scales. Threshold is dashed vertical line. Suprathreshold values shown in red. Lower right: thresholded image, with suprathreshold pixels (plaques) in red. (B) Plaque load, expressed as % of pixels with intensities above the threshold value, as a function of age. Each data point is the mean (± SEM) of 4 sections from 2 mice.
Supplementary figure 2. AP waveforms in CA1 pyramidal neurons from 1 week- and 1 month-old CRND8 mice Mean (± SEM) inter-spike interval, AP threshold, AP amplitude, AP half width, 10-90% rise time and 10-90% decay time during trains of 10 APs in Tg+ (red) and Tg− (blue) mice.