

Abstract
Loss of Xanthine oxidoreductase (XOR) has been linked to aggressive breast cancer (BC) in vivo and to BC cell aggressiveness in vitro. In the present study we hypothesized that the contribution of XOR to the development of the normal mammary gland may underlie its capacity to modulate BC. We contrasted in vitro and in vivo developmental systems by differentiation marker and microarray analyses. Human BC microarray was used for clinical outcome studies. The role of XOR in differentiation and proliferation was examined in human BC cells and in a mouse xenograft model. Our data show that XOR was required for functional differentiation of mammary epithelial cells both in vitro and in vivo. Poor XOR expression was observed in a mouse ErbB2 BC model, and pharmacologic inhibition of XOR increased BC tumor burden in mouse xenograft. MRNA microarray analysis of human BC revealed that low XOR expression was significantly associated with time to tumor relapse. The opposing expression of XOR and Id1 during HC11 differentiation and mammary gland development suggested a potential functional relationship. While overexpression of Id1 inhibited HC11 differentiation and XOR expression, XOR itself modulated expression of Id1 in differentiating HC11 cells. Overexpression of XOR both inhibited Id1 induced proliferation and stimulated differentiation of Heregulinβ1 treated human BC cells. These results demonstrate that XOR is an important functional component of differentiation whose diminished expression contributes to BC aggressiveness, and they support XOR as both a BC biomarker and a target for pharmacologic activation in therapeutic management of aggressive BC.
Keywords: Xanthine Oxidoreductase, Breast Cancer, Mammary Gland Development, Id1, MCF-7, MDA-MB-231, Differentiation Therapy, Microarray Analysis, Novel Targets in BC
Introduction
Xanthine oxidoreductase (XOR) appears to exert an important but poorly defined role in modulating the pathogenesis of breast cancer (BC). Loss of XOR activity has been linked to aggressive BC (1), and in both mouse models of mammary carcinogenesis and in human BC patients decreasing epithelial XOR was associated with and/or predictive of poor clinical outcome and the degree of BC aggressiveness (1–4). Patients without evident epithelial XOR expression had the most aggressive BC and had 2.5 fold increased risk of recurrence compared to patients expressing normal or modestly reduced XOR (1).
Consistent with these clinical observations, we observed that XOR expression was markedly reduced in highly invasive mammary tumor cells in culture compared to expression in normal mouse and human epithelial cells (5). The contribution of XOR to tumor cell aggressiveness in vitro was investigated using the basal BC cell line MDA-MB-231 and the luminal BC cell line MCF-7. We observed that over-expression of an XOR cDNA in MDA-MB-231 cells, possessing both weak XOR expression and high migratory capacity, inhibited migration and expression of genes that mediate BC invasiveness including COX-2, MMP-1, and MMP-3 in vitro. Conversely, pharmacological inhibition of XOR in MCF-7 cells possessing both intermediate XOR expression and weak migratory capacity, increased COX-2 expression and stimulated migration in vitro (5).
A mechanism by which XOR could suppress BC aggressiveness was suggested by its involvement in lactation. Although it is poorly expressed in virgin mammary glands (6), XOR is an abundant milk protein that is highly expressed in mammary tissue during pregnancy and lactation (7–9) where it plays an important functional role in the development of the lactating mammary gland and in cultured HC11 cells (6, 7, 9–13). XOR is induced in mammary gland epithelial cells late in pregnancy, further stimulated by lactation, and then precipitiously lost during involution (6, 10, 11). In cultured HC11 cells XOR can be induced by the lactogenic hormones (LH) Cortisol (or Dexamethasone), Insulin, and Prolactin (6, 10). The importance of XOR to lactation was corroborated by knockout genetics in mice. Although homozygous XOR knockout mice (XOR−/−) showed early neonatal lethality, heterozygous XOR knockout mice (XOR+/−) exhibited disrupted formation of the Milk Fat Globule (MFG) (14). Recent data demonstrated that XOR forms a sulphydryl-bond-dependent complex with butyrophilin (Btn) and adipophilin (ADPH) in the MFG membrane. This physical interaction between XOR, Btn, and ADPH appears to be essential for the formation of the MFG during lactation (9, 12).
XOR is a member of the molybdoflavo-proteins that catalyzes the formation of uric acid from xanthine and hypoxanthine. During purine oxidation XOR is a source of reactive oxygen species (ROS), reactive nitrogen species (RNS), and uric acid that could potentially regulate many aspects of epithelial cell function or signaling that are involved BC in pathogenesis, including regulation of cyclooxygenase-2 (COX-2) (5, 15, 16), MMP-1 (17), or other factors that contribute to tumor promotion or metastasis (18).
Data shown in the present investigation support the hypothesis that the contribution of XOR to development in vitro and in vivo (12, 14) mediates the suppressive effect of XOR on BC.
Materials and Methods
Reagents
Most reagents, buffers, substrates, PAGE supplies, EGF, Insulin, and Heregulin-β1 were purchased from Sigma-Aldrich (St Louis, MO, USA). Media for cell culture were obtained from Gibco/BRL (Bethesda, MD, USA). Fetal bovine serum was from Gemini Bioproducts (Woodland, CA, USA). The following primary antibodies were used: rabbit anti-β-actin (A-2066, Sigma), rabbit antibody to XOR (100–4183) was obtained from Rockland, Inc. (Gilbertsville, PA, USA), mouse and human reactive goat anti-β-casein (sc-17969), antibodies to Id proteins 1 (sc-488), 2 (sc-489), 3 (sc-490), and 4 (sc-491) were all purchased from Santa Cruz Biotechnology, Inc. (Santa Cruz, CA, USA). The following antibodies were used for fluorescent labeling: FITC conjugated Donkey anti-Rat IgG (712-095-150, Jackson ImmunoResearch (West Grove, PA, USA), FITC conjugated Donkey anti-Mouse IgG (715-095-150, Jackson ImmunoResearch). The following Horse Radish Peroxidase conjugated secondary antibodies: goat anti-rat IgG (sc-2006), Goat anti-mouse IgG (sc-2005), and Goat anti-rabbit IgG (sc-2004) were also purchased from Santa Cruz. Antibody used for the detection of XOR was previously described (12).
Cell culture, proliferation, and viability
Mouse and human cells were grown as previously described (5). MCF-7 and MDA-MB-231 human cancer cells were obtained from the ATCC (HTB-22, HTB-26). Cell number and viability were determined by Sulforhodamine-B (SRB) assay. Cells were plated in triplicate (10,000 cells/well) on 48-well transparent flat bottomed tissue culture plates. After the indicated treatments, cells were fixed in 10% TCA overnight. A solution of 0.4% SRB was added to each well, and plates were washed after 30 min of incubation at room temperature. SRB dye was solubilized on the plates in 10mM Tris, pH 7.5, and dye was quantitated on a TECAN Infinite M200 plate reader (Durham, NC, USA) at an absorbance of 465nm. Data were calculated as 465nm absorbance minus background absorbance obtained at 690nm, and figures show the mean and SD of at least three replicates.
Oil-Red-O staining and quantitation
Cells were cultured in 12 well trays on sterile glass slides, and after the indicated treatments slides were washed with PBS, fixed with 3.7% formaldehyde at room temperature, and washed again with PBS. Slides were then stained with 0.5% Oil-Red-O solution prepared in isopropanol. Slides were then rinsed with water, counter stained with hematoxylin, and treated with Crystal/Mount mounting media for preservation and photography. Oil-Red-O staining was quantitated by solubilizing the stain in each well with 2 ml of anhydrous isopropanol and determining absorbance at 550 nm using a TECAN Infinite M200 plate reader. All figures show the mean and SD of at least three replicates.
SDS-PAGE and western immunoblot analysis
Western immunoblots were run as previously described (13). Corroboration of the Id-1 protein detected at 17 KDa using the Santa Cruz antibody sc-488 was established using lysates of MCF-7 cells that had been transfected with pCMV6-Id1 which expresses the mature Id1 protein as described below. This clearly distinguished Id1 from higher molecular weight cross reactive material obtained with sc-488 antibody (19), and all gels shown here display the confirmed 17 KDa Id1 antigen. Antigen-antibody complexes were detected by reaction with an ECL Western blotting detection kit according to manufacturer’s instruction (Amersham Life Sciences, NJ, USA). Each experiment was run in duplicate or triplicate, and representative immunoblots are shown.
Thioglycolate elicited macrophages
Verification of the antibody used for XOR immunofluorescence analysis was obtained by generating thioglycolate elicited macrophages from XOR+/+ and XOR conditional knockout strains (manuscript in preparation). Briefly, CRE-LoxP technology was used to knockout XOR specifically in myeloid lineage cells in C57Black/6 mice. LoxP inserted XOR strains were bred to homozygosity for LoxP sites flanking critical exons in the XOR gene, generating XORfl/fl mice. These mice were bred to mice expressing the CRE Recombinase under the control of the myeloid specific gene promoter for LysM. The resulting progeny, XORfl/fl//LysMCRE were treated with thioglycolate by intraperitoneal injection and three days later leukocytes were harvested by peritoneal lavage. Western blots were run using 50 ug of whole cell extract.
Transfection and generation of stable cell lines
Several stably transfected cell lines were generated from wild type MCF-7 cells for this study. Prior to transfection, MCF-7 cells were genotyped at the UCD DNA sequence core to verify lineage. MCF7-Myc and MCF7-Myc-XOR were generated as previously described using G418 selection (5). MCF-7 cells were transfected with pCMV-Myc empty vector or with the XOR cDNA expression vector pCMV-Myc-XOR-1 in co-transfection reactions with pCI-NEO at a 1:0.1 mass ratio as described (5). This generated the cell lines MCF7-Myc and MCF7-Myc-XOR. HC11-pCMV6-Id1 and MCF7-pCMV6-Id1 was generated by co-transfection of wild type HC11 and MCF-7 with the Id1 expression vector pCMV6-Id1 (SC125462) and pCI-NEO. Id1 cDNA cloned into the pCMV6 expression vector was obtained from OriGene Technologies Inc. (Rockville, MD) and verified by restriction endonuclease cleavage analysis and western immunoblot. Stable transfectants of all cell lines were selected with G418 present at 600 ug/ml in rich growth medium and maintained at 200 ug/ml G418. All stable cell lines used in the present investigation were derived from pools of at least 300 single colonies.
Anti-XOR-SiRNA
SiRNA against mouse XOR was obtained from Dharmacon Inc. (Broomfield, CO). Initially, we tested the Dharmacon On-Target-Plus-Smart-PoolTM for inhibition of XOR activity in HC11 cells. This pool consisted of four optimized SiRNA duplexes. Knockdown of HC11 XOR activity was 95% in cells assayed three days after transfection. We used the On-Target-Plus-sicontrol (D-001810-10-05) as a scrambled SiRNA control that possessed no sequence homology with the mouse genome. Individual anti-XOR-SiRNAs from the original Smart Pool were then tested for XOR activity silencing. Transfection of SiRNA duplex-9 reduced XOR activity from 125 pMol U.A./min/mg in the Scrambled control to 7.5 pMol U.A./min/mg, approximately 94% knockdown of XOR activity. The anti-XOR-SiRNA-9 duplex has the following sequence: sense strand, 5’-CCAUAAGAAUCUCCGUACAUU-3’ and antisense strand, 5’-PUGUACGGAGAUUCUUAUGGUU-3’ corresponding to nucleotides 3573 through 3591 of the mouse mRNA sequence (20). Anti-mouse-XOR-SiRNA-9 was routinely transfected at a concentration of 100 nM using the DharmaFECT-1 (T-200-01-07-01) transfecting reagent as recommended by the supplier.
Histological and immunofluorescence analysis of mammary tissue
Paraffin embedded tissue sections were prepared from C57Bl/6 mouse mammary glands harvested at day 7 of pregnancy (P7) and lactation day 1 (L1). Sections were deparaffinized, rehydrated, and antigen-retrieval was performed with Vector Antigen Unmasking Solution (Vector Laboratories, H-3300). Slides were allowed to cool and were then permeabilized with 0.2% Triton X-100 for 5 min, and blocked with 10% Donkey serum in PBS. Primary antibody solutions were: 1:100 Rabbit anti-XOR (Abcam ab6194), Rabbit anti-ID1 (Santa Cruz, sc-488). The immunostain was visualized with a Donkey-anti-Rabbit IgG conjugated to DyLight 549 (Jackson ImmunoResearch, 711-506-152). Sections were co-stained with wheat germ agglutinin (Alexa488 conjugate, Invitrogen, W11261) to demonstrate tissue morphology. Slides were mounted with Prolong Gold + DAPI (Invitrogen, P36935), and images were captured in the CU Denver, Anschutz Medical Center Light Microscopy Core Facility utilizing the Olympus IX81 inverted microscope, 100 watt Hg lamp, Hamamatsu ORCA IIER CCD camera, using Slidebook Acquisition Software (Intelligent Imaging Innovations, Inc.)
Tumor Xenograft and animal treatment
MDA-MB-231 cells were verified by DNA profiling at the University of Colorado Cancer Center DNA Sequencing & Analysis Core. Cells were grown as above, harvested from subconfluent cultures and resuspended in 50% growth factor reduced matrigel (BD Biosciences 354230). Cells were tested for mycoplasma using the MycoAlert assay (Lonza LT07-218) prior to injection into 6 week old Athymic Nude (Nu/Nu) mice purchased from the National Cancer Institute, orthotopically, under the nipple of the inguinal mammary gland on one side (21, 22). Mice were given Allopurinol (25 mg/kg/day), Oxypurinol (25 mg/kg/day), or Y-700 (5 mg/kg/day) in drinking water (23, 24), refreshed twice per week. Current standard technique for volume determination of subcutaneously xenografted tumors in vivo was performed by external caliper where tumor volume is calculated by use of the modified ellipsoid formula 1/2(Length × Width2) (v = ½ xy2) as described (25). Tumors were allowed to grow for 12 weeks, mice were euthanized with CO2 and cervical dislocation and tumors were harvested for analysis. Mice were housed four per cage, fed ad libitum, with a 12-hour light-dark cycle, in the UCD, Anschutz Medical Campus Animal Care Facility. All procedures were approved by the Institutional Animal Care and Use Committee.
MRNA microarray data mining
Expression of XOR mRNA during mouse mammary gland development was analyzed using publicly shared microarray databases (26, 27). Data were normalized and displayed using Genespring GX 7.3.1 software (Agilent Technologies). Normalized mRNA expression for XOR and Id genes was obtained over the entire developmental time course comprising: [1] Virgin weeks 6, 10, and 12; [2] Pregnancy days 1, 3, 8.5, 14.5, 17, and 19; [3] Lactation days 1, 2, 3, 7, and 9; and [4] forced-weaning involution at days 1, 2, 3, 4, and 20.
XOR gene expression and clinical outcome data in human BC were obtained from the publicly available Wang dataset which comprises 286 lymph-node negative breast cancer patients (28). All tumor samples were mean-centered for XOR expression and divided into 2 groups: samples that express the gene above or below the mean (high XOR or low XOR, respectively). Kaplan-Meier survival curves were generated using WinStat for Excel (R. Fitch Software) where P values denote log rank analysis. Normalization was obtained from the NCBI GEO website (GSE2034).
Results
XOR mRNA and protein expression were closely linked to the differentiated state of the mammary gland in vivo
Expression of XOR throughout mouse mammary gland development in vivo was analyzed by mRNA microarray data mining. We observed an initial spike in XOR mRNA expression just before the onset of pregnancy that was followed by decline in XOR expression until mid-way through pregnancy. XOR expression then increased during the early stages of secretory differentiation during pregnancy but after the principal proliferative phase associated with ductal elongation and branching, peaked at full secretory activation of lactation, and fell again during mammary gland involution. Thus, XOR mRNA expression was closely linked to the differentiation of the mammary gland associated with lactation (Fig. 1A). Consistent with these observations, XOR protein antigen was nearly undetectable early in pregnancy but was highly expressed during lactation where it was associated with the lactating MFG (Fig. 1B). The validity of the antibody used for XOR IF analysis was established by western immunoblot of whole cell extracts derived from thioglycolate elicited macrophages from XOR+/+ and XOR−/− mice using an XORfl/fl//LysMCRE mouse strain (Fig. 1C).
Figure 1.
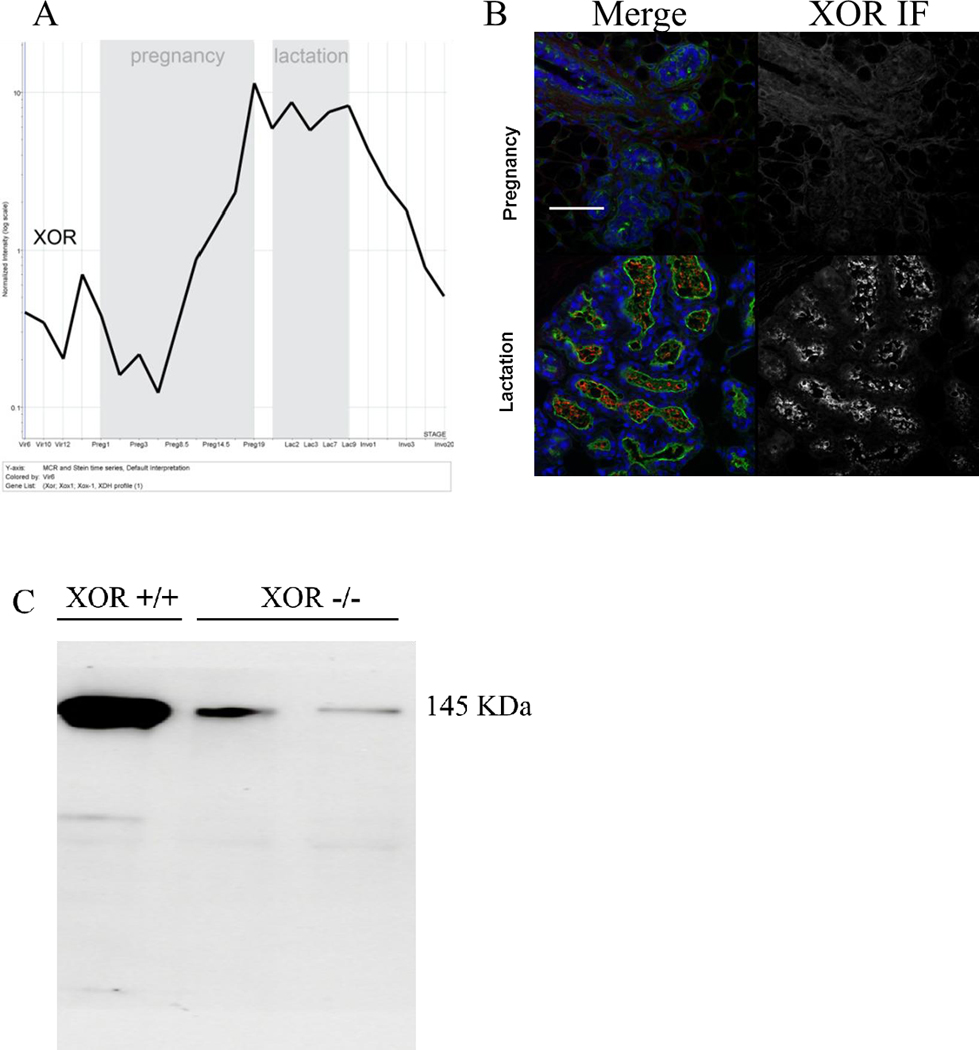
XOR expression during mouse mammary gland development. A, XOR mRNA was quantitated by microchip array analysis throughout mammary gland developmental from virgin, pregnancy, lactation, and involution. Shown is the Normalized Expression of the gene over the entire developmental time course: Virgin weeks 6, 10, and 12, Pregnancy days 1, 3, 8.5, 14.5, 17, and 19, Lactation days 1, 2, 3, 7, 9, and forced-weaning involution days 1, 2, 3, 4, and 20. B, Immunofluorescence analysis of XOR protein expression during pregnancy and lactation. Tissues that were fixed and mounted for histology were stained for both XOR antigen (XOR-Ab) by immunofluorescence (IF) and morphology using wheat germ agglutinin (Alexa488 conjugate Invitrogen W11261), DAPI nuclear stain (Merge). For contrast, tissues were obtained from mice at lactation day 1 where high XOR staining can be identified and at mid pregnancy. C, western immunoblot of XOR protein using whole cell lysates of thioglycolate elicited macrophages from XOR+/+ mice and from two independent experiments using XORfl/fl//LysMCRE strains.
XOR activity, β-casein, and neutral lipids were coordinately induced by differentiation of HC11 cells in vitro
Differentiation of HC11 cells with lactogenic hormones was achieved in several distinct steps (29). Cells were grown in rich culture medium in the presence of EGF and insulin. After reaching confluency they were shifted into starvation medium consisting of serum free growth medium supplemented with insulin but not EGF (29), and after 48 hrs of starvation were shifted into DIP medium consisting of serum free growth medium supplemented with Dexamethasone, Insulin, and Prolactin. Cells were commonly assayed one, two, or three days following the shift into DIP medium (Fig. 2A). We observed that Oxypurinol inhibitable XOR activity (Fig. 2B), β-casein (Fig. 2C), and vesicle neutral lipids (Fig. 2D) were coordinately induced by in vitro differentiation of HC11 cells.
Figure 2.
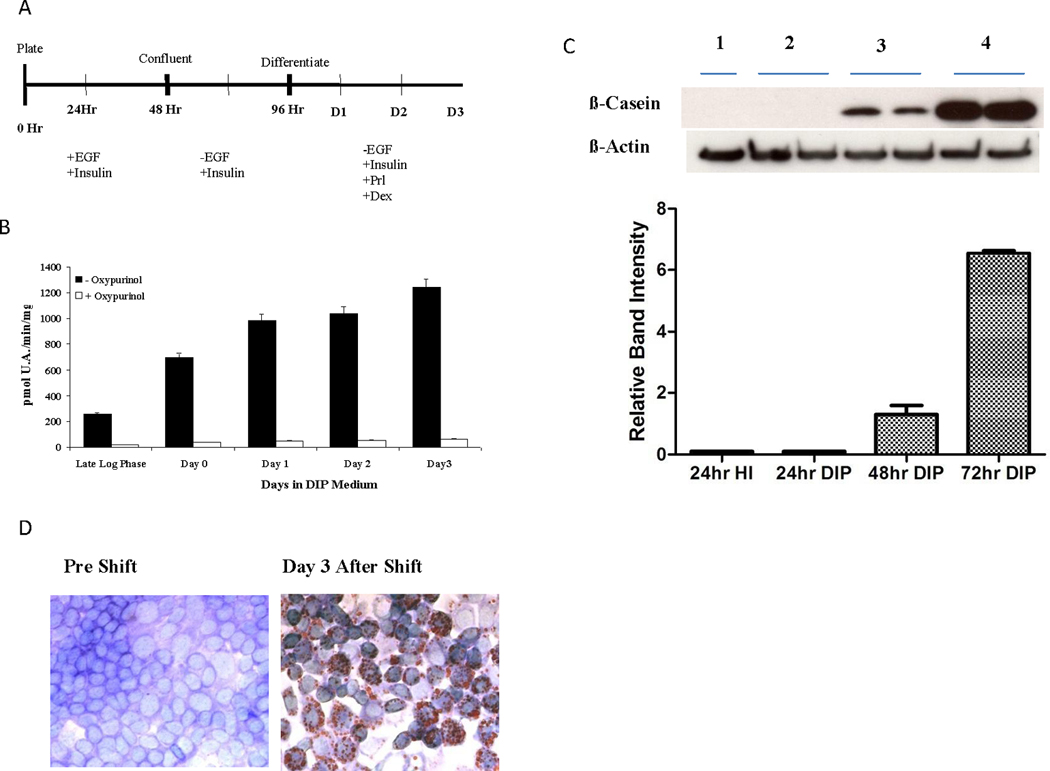
Expression of XOR activity during in vitro differentiation of HC11 cells. A, Differentiation time course: HC11 cells were grown to confluency in standard growth medium consisting of RPMI 1640, 10% FBS, Insulin 5 ug/ml, EGF 10 ng/ml, and 1X GIBCO antibiotic/antimycotic solution. After 48 hours, confluent cells were shifted into serum free medium without EGF but with insulin. After a further 48 hrs cells were shifted into DIP medium consisting of RPMI 1640, Insulin 5 ug/ml, Prolactin 10 ug/ml, Dexamethasone 10 M, and 1X antibiotic/antimycotic solution. B, XOR activity during HC11 differentiation. Cells were harvested in log phase while in rich growth medium, at Day 0 when cells were first shifted into starvation medium, and at Days 1, 2, and 3 following the shift into DIP medium. Cell lysates were prepared and total XOR activity was determined by spectroscopic assay of uric acid formation (13). Data are pMoles of uric acid/min/mg of protein. The mean and SD of six determinations (black bars) are shown. Oxypurinol was included in separate reactions at 150 uM to confirm specificity (open bars) of uric acid generation. C, β-casein was analyzed by western immunoblot (top) using the same cell lysates used in panel B. Band intensity was quantitated by scanning dosimetry, and data show the mean and SD of six determinations at each time point (bottom panel). D, Oil-Red-O staining in differentiated and undifferentiated HC11 cells. Cells were stained by Oil-Red-O at Day 0 before the shift into DIP medium and after three days of differentiation in DIP medium.
Inhibition of XOR blocked expression of β-casein protein and neutral lipid in differentiating HC11 cells
To determine if XOR activity was required for differentiation, HC11 cells were differentiated in vitro in the presence of three different pharmacological inhibitors of XOR: Allopurinol, Oxypurinol, or Y-700. Inhibitors applied immediately before the shift into DIP medium blocked β-casein accumulation compared to the uninhibited control (Fig. 3A). Allopurinol appeared to be slightly less efficient than Oxypurinol or Y-700. To corroborate the effect of pharmacological inhibitors we transfected HC11 cells immediately before the shift into DIP medium with either SiRNA against XOR or with a scrambled SiRNA showing no homology to XOR. We observed strong inhibition of β-casein induction by the anti-XOR-SiRNA but not with the scrambled SiRNA control (Fig. 3B). Anti-XOR-SiRNA but not the scrambled SiRNA control markedly reduced XOR activity at D3 following the shift into DIP medium (Fig. 3C). Inhibition of XOR using the same three pharmacological inhibitors also markedly depressed accumulation of vesicle neutral lipid (Fig. 3D, E). Again, and in keeping with the effect observed on β-casein, Allopurinol exerted a less pronounced effect on vesicle neutral lipid accumulation than did Oxypurinol or Y-700. Consistent with the role played by XOR in promoting HC11 differentiation, we observed that pharmacological inhibition of XOR increased growth rate of the cells. Although, again, Oxypurinol and Y-700 exerted a more pronounced effect on growth rate than did Allopurinol (Fig. 3F).
Figure 3.
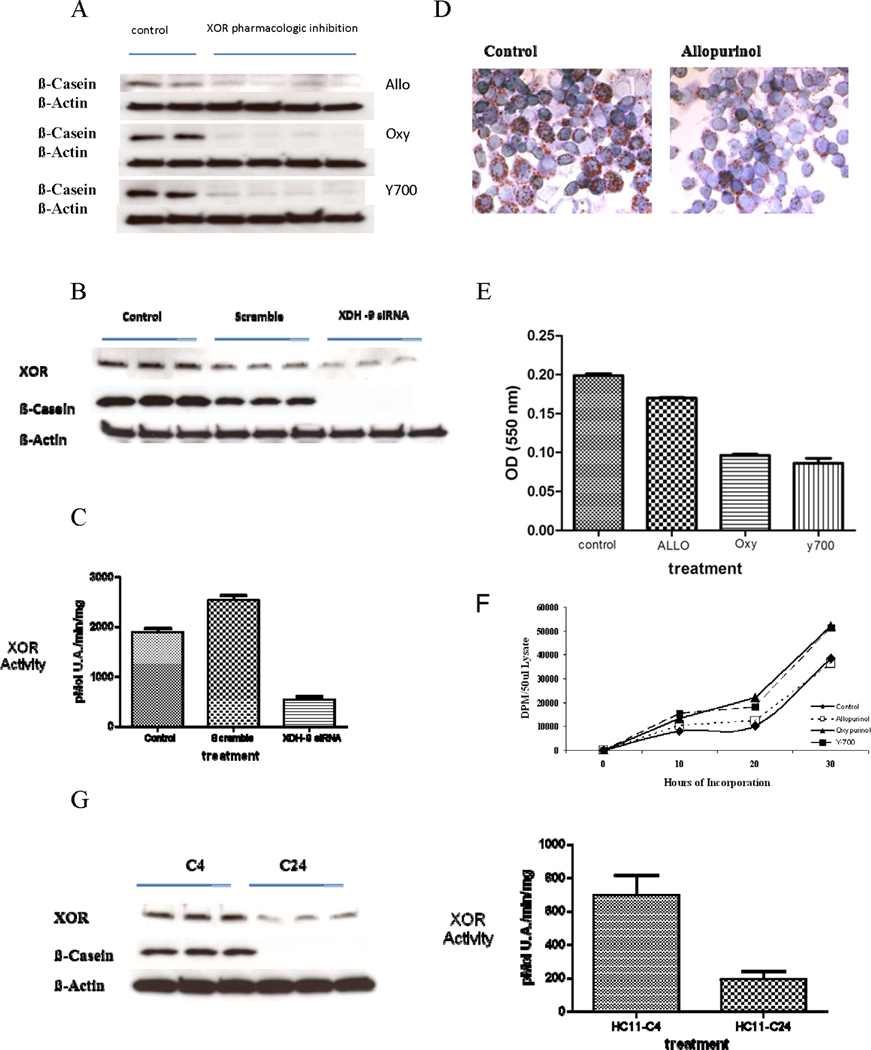
XOR activity is required for in vitro differentiation of HC11 cells. A, Pharmacological inhibition of XOR blocked expression of β-casein in differentiating HC11 cells. HC11 cells were grown and differentiated as described in Figure 1. At the end of starvation, cells were shifted into DIP medium in the presence of the XOR inhibitors Allopurinol (150 uM), Oxypurinol (150 uM), or Y-700 (1 uM). Control cells were shifted in to DIP without inhibitor. At day three following the shift cells were harvested, lysates prepared, and western blots performed against β-casein or β-Actin (loading control). Replicate samples from four separate experiments are shown. B, Anti-XOR-Si-RNA inhibited expression of β-casein in differentiating HC11 cells. HC11 cells were differentiated as in A and transfected with anti-XOR-SiRNA just prior to the shift into DIP medium. Western blots were run against XOR and β-casein from cells harvested on day three following the shift into DIP medium. C, XOR activity was reduced in parallel with XOR protein by transfection of anti-XOR-SiRNA. XOR activity was determined from the same lysates shown in B. D, XOR inhibition blocked lipid vesicle development in differentiating HC11 cells. HC11 cells were differentiated as in A and representative samples stained with Oil-Red-O at day three following the shift into DIP medium. E, Quantification of Oil-Red-O staining. Oil-Red-O staining was quantified at day 3 following the shift into DIP medium in the presence or absence of XOR inhibitors. Data show the mean and SD of four independent replicates. F, Pharmacological inhibition of XOR reduces HC11 proliferation rate. HC11 cells were plated in the presence or absence of XOR inhibitors as shown and incorporation of 3H-Thymidine was measured over the course of the subsequent 30 hrs. For Oxypurinol and Y-700 vs Control p<0.05 by ANOVA, for Allopurinol vs Control p was not significant. G, Low XOR expressing derivatives of HC11 cells fail to induce β-casein during in vitro differentiation. Clonally selected derivatives of HC11 cells, C4 and C24, were differentiated as in Figure 1 and western blots were run against XOR and β-casein from cells harvested at day three following the shift into DIP medium (left panel). XOR activity was measured in C4 and C24 cells differentiated as in A, three days after the shift into DIP medium. Data show the mean and SD of three independent replicates used for western blot (right panel).
HC11-C24 cells failed to induce β-casein during in vitro differentiation
We previously characterized clonally selected derivatives of HC11 cells that express XOR (HC11-C4) or express extremely low levels of XOR (HC11-C24) (5). We differentiated HC11-C4 and HC11-C24 cells in vitro, and three days following the shift into DIP medium we observed both poor expression of XOR protein level and activity in HC11-C24 cells compared to HC11-C4 cells. HC11-C24 cells, but not HC11-C4 cells, also failed to induce β-casein at D3 after the shift into DIP medium (Fig. 3G).
Microarray analysis reveals the predictive effect of XOR on both human mammary tumor ER status and time to tumor relapse
The impact of XOR expression on human BC was characterized using mRNA microarray analysis. Data were mined from the lymph-node negative breast cancer patients in the Wang mRNA microarray dataset (28). Covariance of XOR expression and ER status was performed by Spearman Rank Test of correlation. These data employed a binary score for both ER (+ or −) and XOR (High or Low). This produced a set of 286 valid cases (where data were generated in this binary fashion), with a correlation coefficient of 0.148529, and a one-sided p-value significance of 0.005954. This is a very strong correlation demonstrating that high XOR mRNA expression was associated with ERneg status and that low XOR mRNA expression was associated with ERpos status in this dataset. Further data mining of the Wang dataset for XOR expression and time to tumor relapse showed that XOR varied inversely with time to relapse with p=0.03 level of significance (Fig. 4A). These data show that high XOR score predicted a delayed time to relapse.
Figure 4.
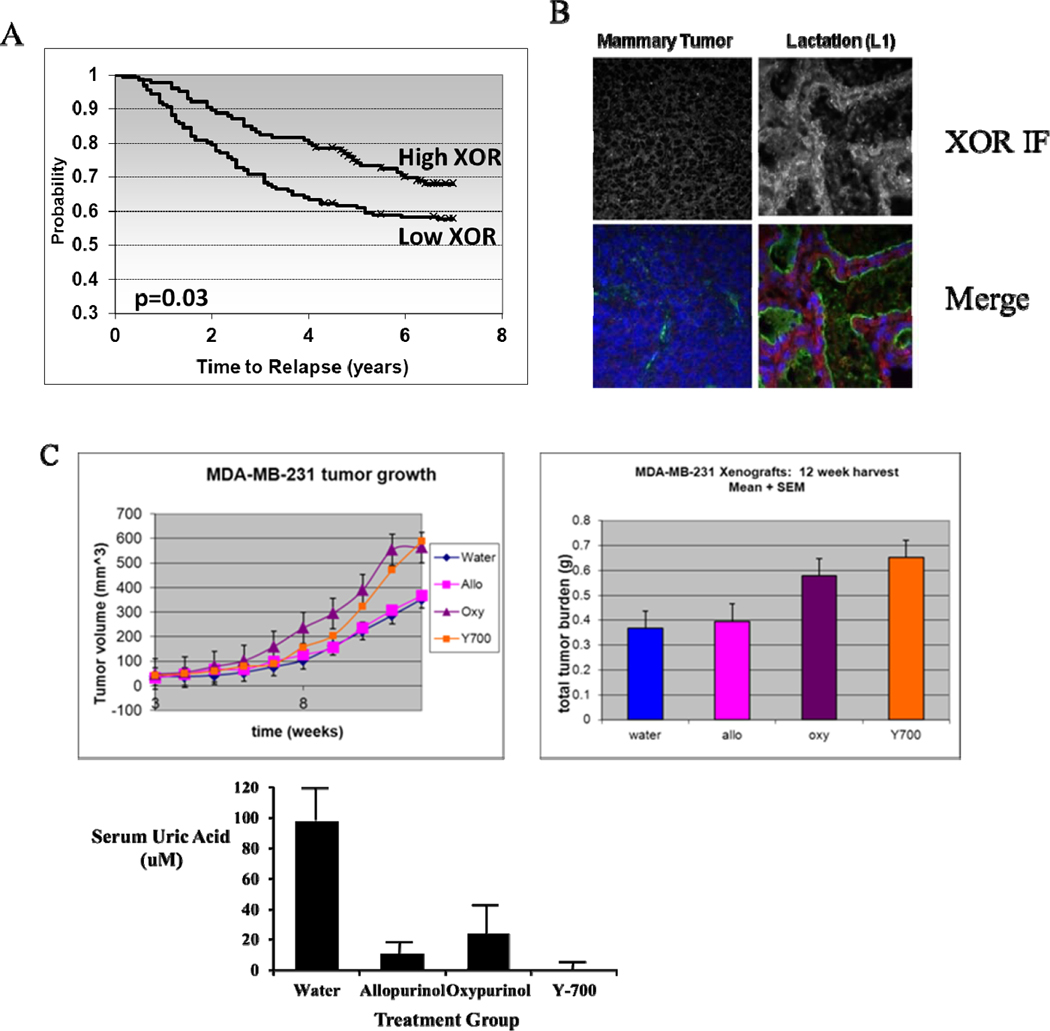
A, Data were mined from the Wang RNA microarray dataset which comprises 286 lymph-node negative breast cancer patients (28). XOR correlated inversely with time to relapse with p=0.03 level of significance. Kaplan-Meier analysis of time to relapse is illustrated for high and low XOR expression. These data show that high XOR score predicts a delayed time to relapse. B, Expression of XOR protein in mouse mammary tumors and during lactation in vivo. XOR immunofluorescence and tissue architecture were stained in whole mammary gland tissue as described in Figure 2. Tissues were stained at day 7 of pregnancy and at day 1 of lactation. A mouse mammary adenocarcinoma was also stained for XOR and tissue architecture. C, Xenograft tumors of MDA-MB-231 cells were grown in Nu/Nu Nude mice as described in Methods. Shown are the tumor volumes calculated from caliper measurements over the 12 week time course (left panel) and the final tumor weight at harvest for the four treatment groups: water control, Allopurinol, Oxypurinol, and Y-700 (right panel); significance of difference between each individual inhibitor group and the water control was determined by ANOVA. Allopurinol, p, n.s.; Oxypurinol, p<0.05; Y-700, p<0.05. Serum uric acid was measured at the time of harvest to verify the effect of XOR inhibition. Data show the mean and SEM with six mice in each group. Significance of difference between each individual inhibitor group and the water control was determined by one sided Student’s t-test. Allopurinol, p< 0.02; Oxypurinol, p<0.05; Y-700, p<0.001.
Pharmacological inhibition of XOR increased tumor growth in a mouse xenograft model of human BC
The contribution of XOR to mammary gland and HC11 differentiation suggested that XOR might modulate tumor cell growth, and very poor expression of XOR was observed in the most aggressive human BC (1). We observed that XOR was also undetected in aggressive tumors from a mouse ErbB2 transgenic model of BC (30); IF analysis of these aggressive tumors exhibited nearly undetectable levels of XOR (Fig. 4B). We utilized a xenograft model of MDA-MB-231 cells in NU/Nu mice to determine the effect of XOR pharmacological inhibition on tumor growth. When mice carrying MDA-MB-231 tumors were treated with three different inhibitors of XOR over a period of 12 weeks we observed a statistically significant increase in tumor growth and final tumor volume in the presence of Oxypurinol or Y-700 (Fig. 4C). While Allopurinol treatment produced a similar increase in tumor growth, its effect was significantly smaller than that observed with the other inhibitors. The effectiveness of systemic XOR inhibition was verified by the effect of XOR inhibitors on serum uric acid which was most profoundly reduced by Y-700 (Fig. 4C).
ID proteins exhibited divergent expression during both HC11 differentiation and during mouse mammary gland development
The Inhibitors of Differentiation proteins, Id proteins, are members of the helix-loop-helix family of transcription factors that exert essential, but still poorly understood roles in mammary gland development and breast cancer (31–33). Four Id proteins are presently recognized: Id1, -2, -3, and -4. We examined expression of Id proteins during differentiation of HC11 cells and observed a markedly divergent pattern of expression between the different proteins (Fig. 5A). Id1 protein levels declined precipitously at D1, D2, and D3 following the shift into DIP medium, whereas Id2 protein levels rose immediately and remained high at D1, D2, and D3. Id3 and Id4 protein levels declined in parallel with Id1, although the decline in Id4 protein level was not as marked as those for Id1 and Id3.
Figure 5.
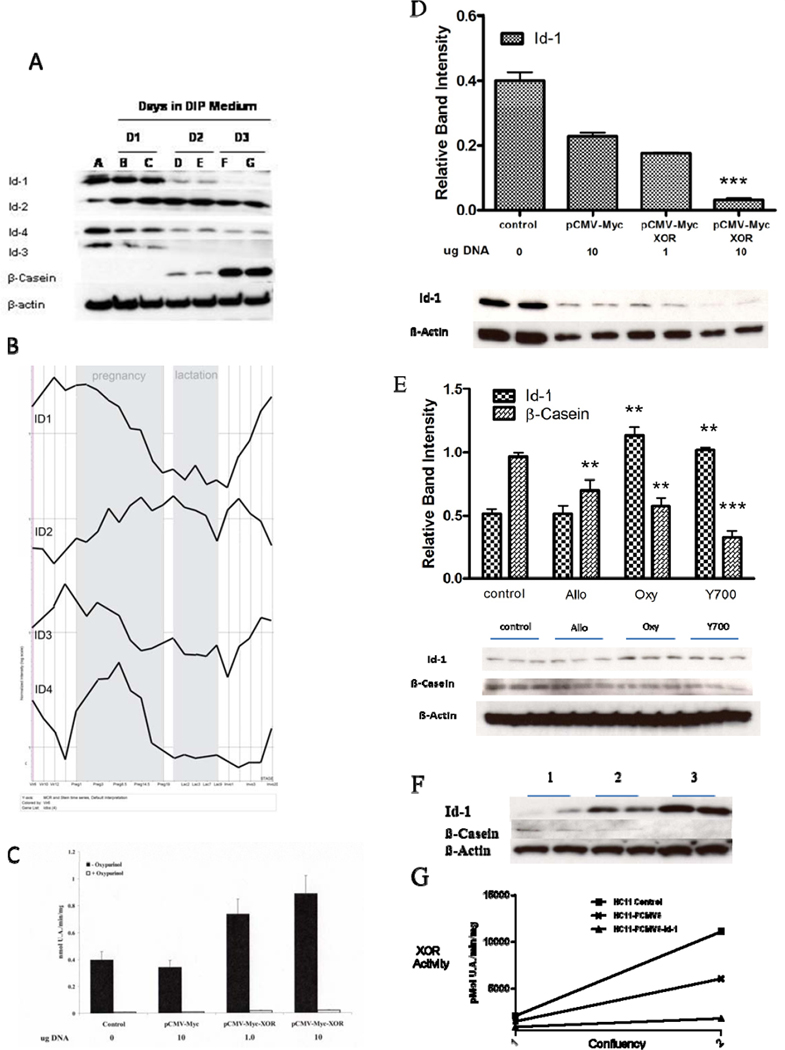
Divergent expression of ID proteins during HC11 differentiation in vitro and during mammary gland development in vivo. A, Differential expression of ID proteins in HC11 cells at different stages of differentiation. HC11 cells were differentiated as described in Figure 1. Western blots were run on cell lysates taken at the point of shift into DIP medium and subsequently at days 1, 2, and 3 following the shift. Blots were analyzed with antisera against Id1, 2, 3, 4 and β-casein. Experiments were run in quadruplicate and duplicate lanes are shown for each day after the shift. B, MRNA microarray expression profile of ID proteins 1–4 during mouse mammary gland development in vivo. Shown is the Normalized Expression of each Id mRNA over the entire developmental time course: Virgin weeks 6, 10, and 12, Pregnancy days 1, 3, 8.5, 14.5, 17, and 19, Lactation days 1, 2, 3, 7, 9, and forced-weaning involution days 1, 2, 3, 4, and 20. C, Ectopic overexpression of XOR increases XOR activity in undifferentiated HC11 cells. HC11 cells were grown to mid log phase in rich growth medium and were transfected with the pCMV-Myc vector or with pCMV-Myc-XOR at 1.0 and 10.0 ug/well. XOR activity was determined from four replicates, and Oxypurinol was used to confirm. D, Ectopic overexpression of XOR blocks expression of Id1 in undifferentiated HC11 cells. HC11 cells were grown to mid log phase in rich growth medium and were transfected with the pCMV-Myc vector or with pCMV-Myc-XOR at 1.0 and 10.0 ug/well. Cells were harvested after 48 hrs and western blots run against Id1. Replicate blots were scanned and data for Id1 were normalized to the band intensity of β-Actin. Data show the mean and SEM where ***, p< 0.001 when the indicated band was compared to control by Students t-test. E, Pharmacological inhibition of XOR increases Id1 protein level in differentiated HC11 cells. HC11 cells were differentiated as in Figure 1 with inhibitors of XOR added at the point of shift into DIP medium. Western blots were run against Id1 and β-casein at day 3 following the shift into DIP medium. Blots were scanned, quantitated, and normalized as above. Data show mean and SEM of three replicates. **, p<0.05 asnd ***, p< 0.001 when the indicated bands were compared to control by Students t-test. F, Stable overexpression of Id1 cDNA inhibits β-casein expression in differentiating HC11 cells. HC11 (1), HC11-pCMV6 (2), and HC11-pCMV6-Id1 (3) cell lines were differentiated as described in Figure 1. Cell lysates were prepared at day 3 following the shift into DIP medium and western blots were run against Id1 and β-casein. G, XOR activity was determined from the same cell lysates used in panel E at 3 days following the shift into DIP medium (2) and from cells harvested immediately before the shift (1).
Microarray analysis of Id mRNA levels throughout the course of mouse mammary gland development revealed equally complex and divergent expression (Fig. 5B). Before the onset of pregnancy, both Id1 and Id3 mRNA levels rose briefly, while mRNA levels for Id2 and Id4 fell. Both Id1 and Id3 mRNA levels declined continuously throughout pregnancy and lactation, while mRNA for Id2 rose during the same period. Id4 mRNA, on the other hand, exhibited dramatic increase during pregnancy that declined precipitously from mid-pregnancy and throughout lactation. Shortly after the start of involution Id1 and Id3 mRNA levels increased continuously, while Id2 mRNA levels declined throughout most of lactation. Id4 mRNA levels only showed an increase during the last few days of involution. The divergent pattern of expression of the different Id mRNAs is consistent with the diverse roles ascribed to Id proteins during mammary gland development and reaffirm that the Id proteins may have distinct and independent functions in development (33).
XOR and Id1 exerted opposite effects on their respective expression
To determine if XOR could modulate expression of Id1, we transfected HC11 cells with either an empty expression vector (pCMV-Myc) or with the XOR expression vector (pCMV-Myc-XOR). These cells showed an expected DNA dose-dependent and Oxypurinol inhibitable increase in XOR activity (Fig. 5C) and the concomitant reduction in levels of Id1 protein on western immunoblot (Fig. 5D). Conversely, when HC11 cells were differentiated in the absence or presence of XOR pharmacological inhibitors, we observed that cells exposed to Oxypurinol or Y-700 expressed higher levels of Id1 protein. As described above, this was accompanied by parallel decline in β-casein levels (Fig. 5E). To determine if ectopic overexpression of Id1 would modulate HC11 differentiation, we developed new stably transfected derivatives of the HC11 cell line that express either the empty expression vector (pCMV6) or overexpress Id1 cDNA in the same vector (pCMV6-Id1). These cells were differentiated in vitro and at D3 following the shift into DIP medium cells were harvested and analyzed. As expected, we observed marked increase in Id1 protein in cells transfected with pCMV6-Id1 (Fig. 5F). The increase in Id1 protein produced with pCMV6-Id1 was accompanied by marked decreases in expression of both β-casein protein levels and XOR activity (Fig. 5F, G). Thus, ectopic overexpression of Id1 mRNA inhibited functional differentiation of HC11 cells by lactogenic hormones.
Ectopic overexpression of XOR augmented Heregulin-β1 induced differentiation of human mammary cancer cells in vitro
It has been shown that Heregulin-β1 (HRGβ1) can induce expression of markers of epithelial cell differentiation in various BC cell lines (34). While XOR was activated in MCF-7 cells that were treated with HRGβ1 (Fig. 6A), we observed only modest inhibition of MCF7 proliferation by HRGβ1 alone (not shown). However, proliferation was significantly reduced in MCF-7 cells that were stably transfected with pCMV-Myc-XOR to generate high level constitutive overexpression of XOR (Fig. 6B). The reduction in proliferation was associated with the induction of differentiation measured by the level of HRGβ1 induced production of neutral lipid droplets (34) (Fig. 6B). The augmentation of HRGβ1 induced differentiation by XOR overexpression may result from the relatively low level of XOR found in native MCF7 cells (5).
Figure 6.
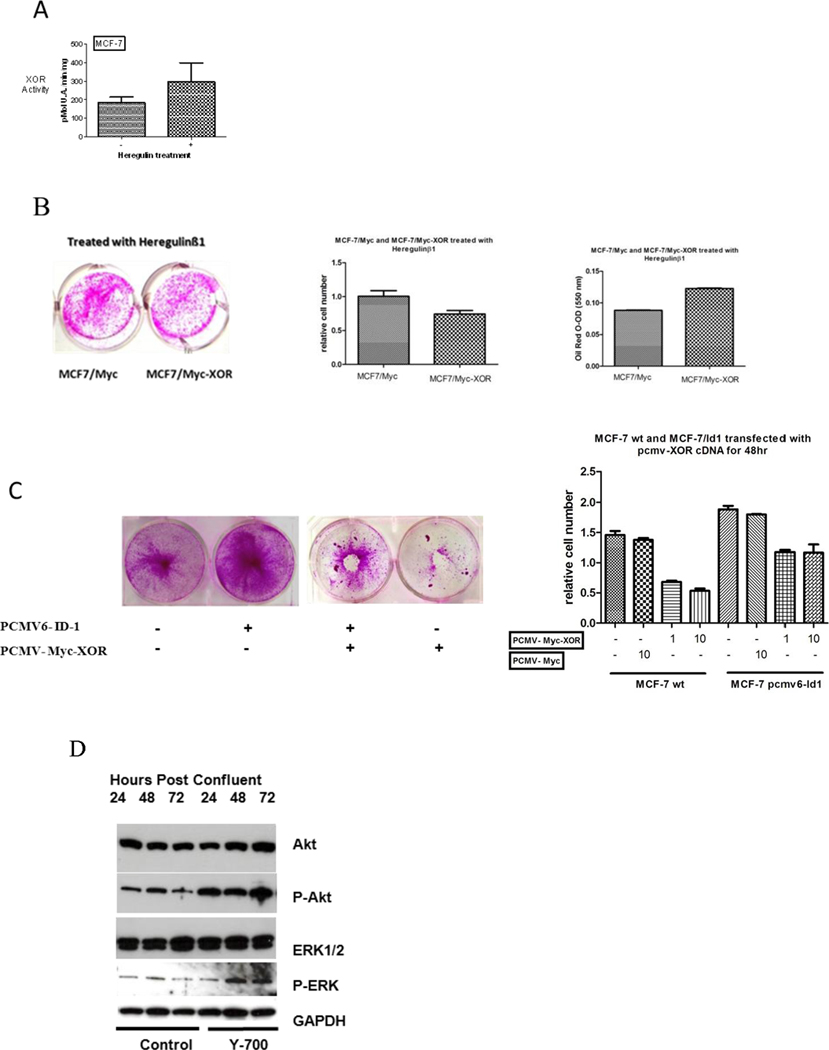
XOR modulates proliferation of human mammary carcinoma cells and tumors. A, XOR activity was increased in human mammary cancer cells by treatment with HRGβ1 (10 ng/ml). XOR activity was measured in MCF-7 human mammary cancer cells 72 hrs after treatment with HRGβ1 and in untreated control cells. Data show the mean and SEM of six independent replicates; p<0.05 by Student’s t-test. B, MCF7-Myc and MCF7-Myc-XOR cells were grown as above, treated with HRGβ1, and stained with the Sulforhodamine B. Plates were photographed and results of six independent assays were quantitated. Data show the Mean and SEM and differed significantly by Student’s T-test with p<0.02. MCF7-Myc and MCF7-Myc-XOR cells were differentiated with HRGβ1, and 72 hrs later cells were stained for neutral lipid with Oil-Red-O which was quantitated spectophotometrically. Data show the mean and SEM of six independent assays. C, Ectopic overexpression of XOR in MCF-7-pCMV6-Id1 cells reduces cell proliferation. MCF-7 wild type and MCF-7-pCMV6-Id1 cells were grown to late log phase and were then transfected with pCMV-Myc-XOR at different levels DNA input. Plates were stained with Sulforhodamine B to identify living cells 72 hrs after transfection and were photographed. Results of four independent transfections over the DNA concentration range indicated were quantitated to reflect the relative cell number. Data show the mean and SEM; data differed significantly by Student’s T-test for 1.0 and 10.0 ug of input pCMV-Myc-XOR between MCF7-WT and MCF7-pCMV6-Id1 p<0.02 (1.0ug DNA) and p<0.01 (10.0ug DNA). D, MCF-7 cells were grown 72hrs after reaching confluency in the absence or presence of the XOR inhibitor Y-700. Western blots were run on whole cell extracts against Akt, phosphor-akt (p-Akt), ERK, phosphor-ERK (p-ERK), and GAPDH as a control for loading of the gel.
Inhibitory effects of XOR on human breast cancer cell proliferation was attenuated by ectopic overexpression of Id1
We have shown the effects of XOR on normal HC11 and human breast cancer cell differentiation. These observations raised the possibility that induction or ectopic overexpression of XOR could be used to inhibit cancer cell proliferation. We observed that transient transfection of MCF-7 cells with pCMV-Myc-XOR resulted in reduced proliferation (Fig. 6C). To determine the effect of Id1 on XOR induced reduction of proliferation in these cells, we generated stable cell lines of MCF-7 that expressed either pCMV6-Id1 or the empty pCMV6 vector. We observed that Id1 ectopic overexpression not only increased the proliferation of MCF-7 cells but also attenuated the inhibitory effects of XOR on proliferation (Fig. 6C).
Both ERK and Akt MAP Kinase signaling cascades contribute to tumor proliferation, progression, and metastasis (35–38), and their activation regulates expression of key effector molecules (39, 40) involved in tumorigenesis. We observed that that both pERK and pAkt were increased in MCF7 by pharmacological inhibition of XOR (Fig. 6D). Thus, XOR activity may comprise an important missing link in the signaling cascade that modulates MAPK activation and mammary tumorigenesis. For example, while little is presently known about the impact of pERK on MCF7 Id1, in esophageal cancer Id1 promotes tumorigenesis in part by phospho-activation of Akt (41), and this effect is reflected in Id1 overexpressing MCF7 cells where Id1 also activates the Akt pathway (42). We imagine that one mechanism by which XOR modulates proliferation and Id1 in MCF7 mammary carcinoma cells is by down-regulating levels of pAkt and pERK, and this may comprise one mechanism by which XOR modulates BC.
Discussion
Clinical observations have suggested the possibility that down-regulation of XOR may be functionally linked to BC aggressiveness and recurrence. Conversely, expression of XOR was associated with less aggressive BC and reduced aggressiveness of BC cells in vitro (1, 5).
Our studies identified the contribution of XOR to differentiation that was associated with its capacity to modulate proliferation, and these data fully support both mRNA expression profiling in mammary gland development, the inhibition of XOR activity by estrogen (discussed below), and its expression in ERneg BC. In conjunction with previous investigations that demonstrated the activation of XOR by lactogenic hormones (6, 10) and identified its physical role in the formation of the lactating MFG (12, 14), these studies identify XOR as a marker of mammary gland development and differentiation. Furthermore, pharmacological inhibition of XOR activity was found to reduce expression of both β-casein protein and neutral lipid in differentiating HC11 cell, and these observations were confirmed with the use of anti-XOR-SiRNA transfection. In addition, clonally selected derivatives of HC11 cells that poorly express XOR failed to induce β-casein during differentiation. Together these data show for the first time that XOR catalytic activity, as opposed to its physical role in the formation of the MFG, is required for functional differentiation of HC11 cells.
The basic helix-loop-helix family of transcription factors (bHLH), including the Inhibitor of Differentiation proteins (Id1, 2, 3, 4), are important mediators of mammary gland development and breast tumorigenesis (33). While the roles of individual Id proteins are not well understood, current data support a role for Id2 in both the development of lactation (43) and in the maintenance of a differentiated and non-invasive phenotype (33, 44). Although the specific role of Id1 in mammary gland development and in neoplastic transformation is presently unclear (45), the cooperation of Id1 and Id3 in Triple Negative BC (ER-, PR-, Her2-) and in the progression and proliferation of lung metastasis has been identified (46). We uncovered highly divergent expression of Id proteins during HC11 differentiation and parallel divergence in mRNA expression during mouse mammary gland development in vivo that are consistent with these observations. For example, increased Id2 expression correlated well with HC11 differentiation and with mouse pregnancy and lactation. Expression of both Id1 and Id3 were consistently opposite that of Id2.
Expression of Id1 and XOR proteins were opposite during HC11 differentiation, and their respective mRNA profiles were opposite as well during mammary gland development in the mouse. These data led us to ask whether XOR was itself involved in expression of Id1 or whether Id1 was involved in the expression of XOR. Remarkably, we observed that XOR and Id1 exerted opposite effects on their respective expression. Ectopic overexpression of XOR repressed Id1 expression in HC11 cells, while pharmacological inhibition of XOR increased Id1 protein level. Conversely, ectopic overexpression of Id1 inhibited differentiation of HC11 cells blocking both XOR and β-casein expression. We hypothesized that the opposing expression of XOR and Id1 may comprise an important mechanism by which XOR expression could modulate BC aggressiveness.
Dysregulation of both XOR and Id1 in the most aggressive human BC (1, 19) led us to ask whether XOR and Id1 might oppositely effect BC cell proliferation. Id1 levels were found to be very high in the most aggressive metaplastic BC (19), whereas XOR levels were found to be extremely low in the most aggressive human BC (1) or BC cells (5). Furthermore, while Id1 is not expressed in normal luminal epithelial cells (47), XOR is an abundant product of these cells. To determine the effect of XOR and Id1 on BC cell proliferation, we developed new cell lines from the MCF-7 luminal carcinoma cell line that stably overexpressed Id1, the MCF-7-pCMV6-Id1 cells. As anticipated from published reports (48), these cells exhibited marked increase in proliferation compared to wild type MCF-7. Transient overexpression of XOR using pCMV-Myc-XOR in MCF-7-pCMV6-Id1 cells reversed the increase in cell proliferation and in a DNA dose dependent fashion. Indeed, even in wild type MCF-7 cells transient overexpression of XOR also dose dependently inhibited proliferation. We conclude that in human mammary carcinoma cells, as in HC11 cells, XOR and Id1 exert opposing effects on cell proliferation.
The impact of XOR on human mammary cancer per se was determined by microarray data mining of XOR mRNA expression. These analyses uncovered the significant predictive value of low XOR expression for the time to tumor relapse. Low XOR expression predicted a more rapid time to tumor relapse. Furthermore, XOR exhibited very poor expression in xenograft analysis of ErbB2 BC tumors. Published reports of Id1 in human BC revealed high Id1 levels to be associated with highly aggressive metaplastic carcinoma (19), with the reinitiation of TNBC derived lung metastasis (46), and as a key gene mediating both tumorigenesis and lung metastasis in MDA-MB-231 cell xenograft (18). While we have found XOR to be poorly expressed in MDA-MB-231 cells, expression could be activated pharmacologically to modulate aggressiveness in vitro (5). We hypothesize that the expression of XOR observed in luminal BC cells contributes to the poor expression of Id1 observed in these cells and tumors (19, 45), whereas the poor expression of XOR in both the most aggressive human BC tumors and cells (1, 5) removes this restraint on Id1 expression.
While the previously published clinical analysis of XOR did not show an association with ER status per se (1), microarray data mining the Wang dataset (28) did reveal a significant association of low XOR expression and ERpos status. Furthermore, estrogen stimulated both proliferation and Id1 expression (48) in ERpos T47D human BC cells, while estrogen down regulated XOR in both ERpos and ERneg BC cells (49, 50). Thus, XOR modulation by estrogen appears to be ER independent, and modulation of XOR by estrogen may comprise part of the mechanism by which reduced XOR expression contributes to BC aggressiveness. Differences in the datasets used to correlate XOR expression with ER status (one Finnish one North America, BC subtype classification, age and race composition) may be responsible for the different results obtained in these two studies.
Results presented here, in conjunction with published reports showing the effects of low XOR expression on tumor cell aggressiveness in vitro (5) and on mammary tumor aggressiveness in vivo (1), identify XOR as an important functional component of differentiation and proliferation whose diminished expression contributes to BC aggressiveness. Recent publications identified a group of signature genes that mediate BC metastasis to the lung that comprise in part Id1, COX-2, and MMP-1 (18, 46), and of these Id1 was also found to be a signature gene for tumorigenesis as well (18). Remarkably, XOR has now been found modulate expression of Id1, COX-2, and MMP-1 (5). While Id1 is poorly expressed in some BC (19, 45), its overexpression in the most aggressive metaplastic BC is consistent with the observation that poor XOR expression is associated with the most aggressive human BC. Down regulation of Id1 has been suggested as a potential therapeutic avenue for aggressive BC (32), and modulation of Id1 by ectopic overexpression of XOR suggests that pharmacologic activation of XOR may constitute a novel strategy for the management of the most aggressive and therapeutically resistant BC.
Acknowledgements
The authors would like to thank Dr. Atushi Fukunari (Mitsubishi Tanabe Pharma Corporation, Yokohama, Japan) for the XOR inhibitor, Y-700. Our thanks are extended to Dr. Peggy Neville (Department of Physiology, School of Medicine, UCD) for maintaining and providing access to the gene expression data. Paraffin embedded mammary tissues were the kind gift of Dr. Carol Palmer (UCD Animal Care Committee) and Dr. Jim McManaman (Department of Obstetrics & Gynecology, School of Medicine, UCD).
Grant Support
This work was supported by the generosity of the Robert and Helen Kleberg Foundation, the American Cancer Society (Grants: PF-06-005-01-CCE, PF-08-112-01-CCE), and by the National Institutes of Health (Grants: P20-CA103680 and RO1-HL045582).
Footnotes
Disclosure of Potential Conflicts of Interest
No potential conflicts of interest were disclosed.
References
- 1.Linder N, Lundin J, Isola J, Lundin M, Raivio KO, Joensuu H. Down-regulated xanthine oxidoreductase is a feature of aggressive breast cancer. Clin Cancer Res. 2005 Jun 15;11(12):4372–4381. doi: 10.1158/1078-0432.CCR-04-2280. [DOI] [PubMed] [Google Scholar]
- 2.Cook WS, Chu R, Saksela M, Raivio KO, Yelandi AV. Differential immunohistochemical localization of xanthine oxidase in normal and neoplastic human breast epithelium. Int J Oncol. 1997;11:1013–1017. doi: 10.3892/ijo.11.5.1013. [DOI] [PubMed] [Google Scholar]
- 3.Lewin I, Lewin R, Bray RC. Xanthine oxidase activity during mammary carcinogenesis in mice. Nature. 1957 Oct 12;180(4589):763–764. doi: 10.1038/180763a0. [DOI] [PubMed] [Google Scholar]
- 4.Shan L, He M, Yu M, Qiu C, Lee NH, Liu ET, et al. cDNA microarray profiling of rat mammary gland carcinomas induced by 2-amino-1-methyl-6-phenylimidazo[4,5-b]pyridine and 7,12-dimethylbenz[a]anthracene. Carcinogenesis. 2002 Oct;23(10):1561–1568. doi: 10.1093/carcin/23.10.1561. [DOI] [PubMed] [Google Scholar]
- 5.Fini MA, Orchard-Webb D, Kosmider B, Amon JD, Kelland R, Shibao G, et al. Migratory activity of human breast cancer cells is modulated by differential expression of xanthine oxidoreductase. J Cell Biochem. 2008 Sep 2;105(4):1008–1026. doi: 10.1002/jcb.21901. [DOI] [PMC free article] [PubMed] [Google Scholar]
- 6.McManaman JL, Hanson L, Neville MC, Wright RM. Lactogenic hormones regulate xanthine oxidoreductase and beta-casein levels in mammary epithelial cells by distinct mechanisms. Arch Biochem Biophys. 2000 Jan 15;373(2):318–327. doi: 10.1006/abbi.1999.1573. [DOI] [PubMed] [Google Scholar]
- 7.Linder N, Rapola J, Raivio KO. Cellular expression of xanthine oxidoreductase protein in normal human tissues. Lab Invest. 1999 Aug;79(8):967–974. [PubMed] [Google Scholar]
- 8.Garattini E, Mendel R, Romao MJ, Wright R, Terao M. Mammalian molybdo-flavoenzymes, an expanding family of proteins: structure, genetics, regulation, function and pathophysiology. Biochem J. 2003 May 15;372(Pt 1):15–32. doi: 10.1042/BJ20030121. [DOI] [PMC free article] [PubMed] [Google Scholar]
- 9.Anderson SM, Rudolph MC, McManaman JL, Neville MC. Key stages in mammary gland development. Secretory activation in the mammary gland: it's not just about milk protein synthesis! Breast Cancer Res. 2007;9(1):204. doi: 10.1186/bcr1653. [DOI] [PMC free article] [PubMed] [Google Scholar]
- 10.Kurosaki M, Zanotta S, Li Calzi M, Garattini E, Terao M. Expression of xanthine oxidoreductase in mouse mammary epithelium during pregnancy and lactation: regulation of gene expression by glucocorticoids and prolactin. Biochem J. 1996 Nov 1;319(Pt 3):801–810. doi: 10.1042/bj3190801. [DOI] [PMC free article] [PubMed] [Google Scholar]
- 11.McManaman JL, Neville MC, Wright RM. Mouse mammary gland xanthine oxidoreductase: purification, characterization, and regulation. Arch Biochem Biophys. 1999 Nov 15;371(2):308–316. doi: 10.1006/abbi.1999.1432. [DOI] [PubMed] [Google Scholar]
- 12.McManaman JL, Palmer CA, Wright RM, Neville MC. Functional regulation of xanthine oxidoreductase expression and localization in the mouse mammary gland: evidence of a role in lipid secretion. J Physiol. 2002 Dec 1;545(Pt 2):567–579. doi: 10.1113/jphysiol.2002.027185. [DOI] [PMC free article] [PubMed] [Google Scholar]
- 13.Seymour KJ, Roberts LE, Fini MA, Parmley LA, Oustitch TL, Wright RM. Stress activation of mammary epithelial cell xanthine oxidoreductase is mediated by p38 MAPK and CCAAT/enhancer-binding protein-beta. J Biol Chem. 2006 Mar 31;281(13):8545–8558. doi: 10.1074/jbc.M507349200. [DOI] [PubMed] [Google Scholar]
- 14.Vorbach C, Scriven A, Capecchi MR. The housekeeping gene xanthine oxidoreductase is necessary for milk fat droplet enveloping and secretion: gene sharing in the lactating mammary gland. Genes Dev. 2002 Dec 15;16(24):3223–3235. doi: 10.1101/gad.1032702. [DOI] [PMC free article] [PubMed] [Google Scholar]
- 15.Singh B, Berry JA, Shoher A, Ramakrishnan V, Lucci A. COX-2 overexpression increases motility and invasion of breast cancer cells. Int J Oncol. 2005 May;26(5):1393–1399. [PubMed] [Google Scholar]
- 16.Ohtsubo T, Rovira II, Starost MF, Liu C, Finkel T. Xanthine oxidoreductase is an endogenous regulator of cyclooxygenase-2. Circ Res. 2004 Nov 26;95(11):1118–1124. doi: 10.1161/01.RES.0000149571.96304.36. [DOI] [PubMed] [Google Scholar]
- 17.Shin MH, Moon YJ, Seo JE, Lee Y, Kim KH, Chung JH. Reactive oxygen species produced by NADPH oxidase, xanthine oxidase, and mitochondrial electron transport system mediate heat shock-induced MMP-1 and MMP-9 expression. Free Radic Biol Med. 2008 Feb 15;44(4):635–645. doi: 10.1016/j.freeradbiomed.2007.10.053. [DOI] [PubMed] [Google Scholar]
- 18.Minn AJ, Gupta GP, Siegel PM, Bos PD, Shu W, Giri DD, et al. Genes that mediate breast cancer metastasis to lung. Nature. 2005 Jul 28;436(7050):518–524. doi: 10.1038/nature03799. [DOI] [PMC free article] [PubMed] [Google Scholar]
- 19.Perk J, Gil-Bazo I, Chin Y, de Candia P, Chen JJ, Zhao Y, et al. Reassessment of id1 protein expression in human mammary, prostate, and bladder cancers using a monospecific rabbit monoclonal anti-id1 antibody. Cancer Res. 2006 Nov 15;66(22):10870–10877. doi: 10.1158/0008-5472.CAN-06-2643. [DOI] [PubMed] [Google Scholar]
- 20.Terao M, Cazzaniga G, Ghezzi P, Bianchi M, Falciani F, Perani P, et al. Molecular cloning of a cDNA coding for mouse liver xanthine dehydrogenase. Regulation of its transcript by interferons in vivo. Biochem J. 1992 May 1;283(Pt 3):863–870. doi: 10.1042/bj2830863. [DOI] [PMC free article] [PubMed] [Google Scholar]
- 21.Noren NK, Foos G, Hauser CA, Pasquale EB. The EphB4 receptor suppresses breast cancer cell tumorigenicity through an Abl-Crk pathway. Nat Cell Biol. 2006 Aug;8(8):815–825. doi: 10.1038/ncb1438. [DOI] [PubMed] [Google Scholar]
- 22.Matsuda Y, Schlange T, Oakeley EJ, Boulay A, Hynes NE. WNT signaling enhances breast cancer cell motility and blockade of the WNT pathway by sFRP1 suppresses MDA-MB-231 xenograft growth. Breast Cancer Res. 2009;11(3):R32. doi: 10.1186/bcr2317. [DOI] [PMC free article] [PubMed] [Google Scholar]
- 23.Tanaka T, Doi K, Maeda-Mamiya R, Negishi K, Portilla D, Sugaya T, et al. Urinary L-type fatty acid-binding protein can reflect renal tubulointerstitial injury. Am J Pathol. 2009 Apr;174(4):1203–1211. doi: 10.2353/ajpath.2009.080511. [DOI] [PMC free article] [PubMed] [Google Scholar]
- 24.Wu X, Wakamiya M, Vaishnav S, Geske R, Montgomery C, Jr, Jones P, et al. Hyperuricemia and urate nephropathy in urate oxidase-deficient mice. Proc Natl Acad Sci U S A. 1994 Jan 18;91(2):742–746. doi: 10.1073/pnas.91.2.742. [DOI] [PMC free article] [PubMed] [Google Scholar]
- 25.Tomayko MM, Reynolds CP. Determination of subcutaneous tumor size in athymic (nude) mice. Cancer Chemother Pharmacol. 1989;24(3):148–154. doi: 10.1007/BF00300234. [DOI] [PubMed] [Google Scholar]
- 26.Stein T, Morris JS, Davies CR, Weber-Hall SJ, Duffy MA, Heath VJ, et al. Involution of the mouse mammary gland is associated with an immune cascade and an acute-phase response, involving LBP, CD14 and STAT3. Breast Cancer Res. 2004;6(2):R75–R91. doi: 10.1186/bcr753. [DOI] [PMC free article] [PubMed] [Google Scholar]
- 27.Rudolph MC, McManaman JL, Hunter L, Phang T, Neville MC. Functional development of the mammary gland: use of expression profiling and trajectory clustering to reveal changes in gene expression during pregnancy, lactation, and involution. J Mammary Gland Biol Neoplasia. 2003 Jul;8(3):287–307. doi: 10.1023/b:jomg.0000010030.73983.57. [DOI] [PubMed] [Google Scholar]
- 28.Wang Y, Klijn JG, Zhang Y, Sieuwerts AM, Look MP, Yang F, et al. Gene-expression profiles to predict distant metastasis of lymph-node-negative primary breast cancer. Lancet. 2005 Feb 19–25;365(9460):671–679. doi: 10.1016/S0140-6736(05)17947-1. [DOI] [PubMed] [Google Scholar]
- 29.Hynes NE, Taverna D, Harwerth IM, Ciardiello F, Salomon DS, Yamamoto T, et al. Epidermal growth factor receptor, but not c-erbB-2, activation prevents lactogenic hormone induction of the beta-casein gene in mouse mammary epithelial cells. Mol Cell Biol. 1990 Aug;10(8):4027–4034. doi: 10.1128/mcb.10.8.4027. [DOI] [PMC free article] [PubMed] [Google Scholar]
- 30.Kim A, Liu B, Ordonez-Ercan D, Alvarez KM, Jones LD, McKimmey C, et al. Functional interaction between mouse erbB3 and wild-type rat c-neu in transgenic mouse mammary tumor cells. Breast Cancer Res. 2005;7(5):R708–R718. doi: 10.1186/bcr1281. [DOI] [PMC free article] [PubMed] [Google Scholar]
- 31.Ling MT, Wang X, Zhang X, Wong YC. The multiple roles of Id-1 in cancer progression. Differentiation. 2006 Dec;74(9–10):481–487. doi: 10.1111/j.1432-0436.2006.00083.x. [DOI] [PubMed] [Google Scholar]
- 32.Fong S, Debs RJ, Desprez PY. Id genes and proteins as promising targets in cancer therapy. Trends Mol Med. 2004 Aug;10(8):387–392. doi: 10.1016/j.molmed.2004.06.008. [DOI] [PubMed] [Google Scholar]
- 33.Desprez PY, Sumida T, Coppe JP. Helix-loop-helix proteins in mammary gland development and breast cancer. J Mammary Gland Biol Neoplasia. 2003 Apr;8(2):225–239. doi: 10.1023/a:1025957025773. [DOI] [PubMed] [Google Scholar]
- 34.Sellappan S, Grijalva R, Zhou X, Yang W, Eli MB, Mills GB, et al. Lineage infidelity of MDA-MB-435 cells: expression of melanocyte proteins in a breast cancer cell line. Cancer Res. 2004 May 15;64(10):3479–3485. doi: 10.1158/0008-5472.CAN-3299-2. [DOI] [PubMed] [Google Scholar]
- 35.Whyte J, Bergin O, Bianchi A, McNally S, Martin F. Key signalling nodes in mammary gland development and cancer. Mitogen-activated protein kinase signalling in experimental models of breast cancer progression and in mammary gland development. Breast Cancer Res. 2009;11(5):209. doi: 10.1186/bcr2361. [DOI] [PMC free article] [PubMed] [Google Scholar]
- 36.Myers AP, Cantley LC. Targeting a common collaborator in cancer development. Sci Transl Med. Sep 8;2(48):48ps5. doi: 10.1126/scitranslmed.3001251. [DOI] [PMC free article] [PubMed] [Google Scholar]
- 37.Yang W, Ju JH, Lee KM, Shin I. Akt isoform-specific inhibition of MDA-MB-231 cell proliferation. Cell Signal. Jan;23(1):19–26. doi: 10.1016/j.cellsig.2010.07.016. [DOI] [PubMed] [Google Scholar]
- 38.Mester J, Redeuilh G. Proliferation of breast cancer cells: regulation, mediators, targets for therapy. Anticancer Agents Med Chem. 2008 Dec;8(8):872–885. doi: 10.2174/187152008786847747. [DOI] [PubMed] [Google Scholar]
- 39.Dhillon AS, Hagan S, Rath O, Kolch W. MAP kinase signalling pathways in cancer. Oncogene. 2007 May 14;26(22):3279–3290. doi: 10.1038/sj.onc.1210421. [DOI] [PubMed] [Google Scholar]
- 40.Andersen JN, Sathyanarayanan S, Di Bacco A, Chi A, Zhang T, Chen AH, et al. Pathway-based identification of biomarkers for targeted therapeutics: personalized oncology with PI3K pathway inhibitors. Sci Transl Med. Aug 4;2(43):43ra55. doi: 10.1126/scitranslmed.3001065. [DOI] [PubMed] [Google Scholar]
- 41.Li B, Tsao SW, Li YY, Wang X, Ling MT, Wong YC, et al. Id-1 promotes tumorigenicity and metastasis of human esophageal cancer cells through activation of PI3K/AKT signaling pathway. Int J Cancer. 2009 Dec 1;125(11):2576–2585. doi: 10.1002/ijc.24675. [DOI] [PubMed] [Google Scholar]
- 42.Lee JY, Kang MB, Jang SH, Qian T, Kim HJ, Kim CH, et al. Id-1 activates Akt-mediated Wnt signaling and p27(Kip1) phosphorylation through PTEN inhibition. Oncogene. 2009 Feb 12;28(6):824–831. doi: 10.1038/onc.2008.451. [DOI] [PubMed] [Google Scholar]
- 43.Mori S, Nishikawa SI, Yokota Y. Lactation defect in mice lacking the helix-loop-helix inhibitor Id2. Embo J. 2000 Nov 1;19(21):5772–5781. doi: 10.1093/emboj/19.21.5772. [DOI] [PMC free article] [PubMed] [Google Scholar]
- 44.Itahana Y, Singh J, Sumida T, Coppe JP, Parrinello S, Bennington JL, et al. Role of Id-2 in the maintenance of a differentiated and noninvasive phenotype in breast cancer cells. Cancer Res. 2003 Nov 1;63(21):7098–7105. [PubMed] [Google Scholar]
- 45.Nair R, Junankar S, O'Toole S, Shah J, Borowsky AD, Bishop JM, et al. Redefining the expression and function of the inhibitor of differentiation 1 in mammary gland development. PLoS One. 5(8):e11947. doi: 10.1371/journal.pone.0011947. [DOI] [PMC free article] [PubMed] [Google Scholar]
- 46.Gupta GP, Perk J, Acharyya S, de Candia P, Mittal V, Todorova-Manova K, et al. ID genes mediate tumor reinitiation during breast cancer lung metastasis. Proc Natl Acad Sci U S A. 2007 Dec 4;104(49):19506–19511. doi: 10.1073/pnas.0709185104. [DOI] [PMC free article] [PubMed] [Google Scholar]
- 47.Uehara N, Chou YC, Galvez JJ, de-Candia P, Cardiff RD, Benezra R, et al. Id-1 is not expressed in the luminal epithelial cells of mammary glands. Breast Cancer Res. 2003;5(2):R25–R29. doi: 10.1186/bcr560. [DOI] [PMC free article] [PubMed] [Google Scholar]
- 48.Lin CQ, Singh J, Murata K, Itahana Y, Parrinello S, Liang SH, et al. A role for Id-1 in the aggressive phenotype and steroid hormone response of human breast cancer cells. Cancer Res. 2000 Mar 1;60(5):1332–1340. [PubMed] [Google Scholar]
- 49.Budhiraja R, Kayyali US, Karamsetty M, Fogel M, Hill NS, Chalkley R, et al. Estrogen modulates xanthine dehydrogenase/xanthine oxidase activity by a receptor-independent mechanism. Antioxid Redox Signal. 2003 Dec;5(6):705–711. doi: 10.1089/152308603770380007. [DOI] [PubMed] [Google Scholar]
- 50.Taibi G, Carruba G, Miceli V, Cocciadiferro L, Nicotra CM. Estradiol decreases xanthine dehydrogenase enzyme activity and protein expression in non-tumorigenic and malignant human mammary epithelial cells. J Cell Biochem. 2009 Oct 15;108(3):688–692. doi: 10.1002/jcb.22305. [DOI] [PubMed] [Google Scholar]