

Abstract
Background
Protein-energy wasting is common in chronic kidney disease and is associated with reductions in body muscle and fat stores and poor outcomes. The accuracy and reliability of field methods to measure body composition is unknown in this population.
Study Design
Cross sectional, observational study.
Setting and Participants
118 maintenance hemodialysis patients were seen at the General Clinical Research Center at Harbor-UCLA Medical Center.
Index Tests
Triceps skinfold, near-infrared interactance, and bioelectrical impedance analysis using the Segal, Kushner and Lukaski equations
Reference Test
Dual energy X-ray absorptiometry (DEXA)
Results
Participants (42% women, 52% diabetics, 40% African-Americans and 38% Hispanics were 49.4±11.5 (mean±SD) years old, and had undergone dialysis for 41.1±32.9 months. Their body mass index was 27.0±6.0 kg/m2. Using DEXA as the reference test, the bioelectrical impedance analysis–Kushner equation, and triceps skinfold and near-infrared interactance were most accurate of the index tests in estimating total body fat percentage, whereas bioelectrical impedance analysis–Segal equation and bioelectrical impedance analysis–Lukaski equation overestimated total body fat percentage. Bland-Altman analyses and Difference plots showed that bioelectrical impedance analysis–Kushner and near-infrared interactance were most similar to the reference test. Bioelectrical impedance analysis–Kushner, triceps skinfold and near-infrared interactance had the smallest mean differences from DEXA, especially in women (1.6%, 0.7% and 1.2%, respectively). Similar results were observed in African-American participants (n=47).
Limitations
Measurements were performed one day after hemodialysis treatment leading to more fluid retention, which may have affected reference and index tests differently.
Conclusions
Using DEXA as the reference test, both near-infrared interactance and bioelectrical impedance analysis-Kushner method yield more consistent estimates of total body fat percentage in maintenance hemodialysis patients compared to the other index tests. The near-infrared interactance is not affected by skin color. Field methods with portable devices may provide adequate precision.
Keywords: Chronic kidney disease (CKD), hemodialysis, protein-energy wasting (PEW), near-infrared, bioelectrical impedance analysis (BIA), malnutrition
Introduction
Of those with advanced chronic kidney disease (CKD) who require dialysis therapy to survive, 20%–75% of individuals show evidence of uremic malnutrition, muscle wasting and body fat loss.(1, 2) Accurate assessment of nutritional status and body composition in this population is crucial, because malnutrition and wasting syndromes are among the strongest risk factors for morbidity and mortality.(3–5) The International Society for Renal Nutrition and Metabolism (ISRNM) Expert Panel has recently proposed the term protein-energy wasting in lieu of other terms for malnutrition or wasting in CKD and defines it as “loss of body protein mass and fuel reserves”.(1) Protein-energy wasting can be diagnosed if at least three out of four characteristics are present, i.e., abnormal levels of circulating biomarkers (low serum albumin, prealbumin, or cholesterol concentrations), reduced body mass (low or reduced body or fat mass or weight loss with reduced intake of protein and energy), reduced muscle mass and/or abnormal nutritional score (subjective global assessment or malnutrition-inflammation score(5)). In particular, the body fat measurement in long-term hemodialysis patients is important, since even slight changes in total body fat may have significant bearing on patient survival.(6)
Even though dual energy X-ray absorptiometry (DEXA) is considered a gold standard method for assessing body composition,(7–9) few dialysis clinics have direct access to DEXA machines and these measurements are expensive. At least three field methods are available using easily transportable devices for assessing body composition in the CKD population. A traditional technique is measuring the skinfold thickness in areas of the trunk and limbs with a skinfold caliper.(9, 10) The accuracy of skinfold measurements is dependent on highly trained technicians.(9) Bioelectrical impedance analysis (BIA) is a non-invasive method which requires relatively inexpensive equipment. Its operation does not require highly trained personnel, and the results have good reproducibility.(11–13) However, variations in the hydration status may affect the validity of this technique, especially among long-term patients who usually accumulate 1 to 4 liters of fluid between any two consecutive hemodialysis sessions.(14, 15). Near infrared (NIR) interactance is a relatively new, non-invasive method for estimating the total body fat percentage (percentage total body fat) based on the degree of light absorption into the skin of the upper arm.(6, 16) It is not clear which of the three aforementioned portable methods yield results similar to DEXA or whether gender or race confounds measurement accuracy. In particular, it is not known whether the color of the skin can interfere with the NIR interactance method,(17, 18) given the fact that over one-third of the 400,000 long-term patients in the United States are African Americans and many more are Hispanic or Asian.(19) Moreover, advanced CKD is often associated with the gradual accumulation of a pale lemon pigment in the skin which may also alter the specificity and sensitivity of NIR interactance in renal failure patients. In the present study we assessed body fat percentage simultaneously in a group of patients using multiple methods and examined their consistency with DEXA as the reference test as well as the impact of hydration status on estimates of percentage total body fat.
Methods
Patient Population
We studied patients who participated in the Nutritional and Inflammatory Evaluation in Dialysis (NIED) Study.(20) The original patient cohort was derived over 5 years from a pool of over 3,000 outpatients in eight DaVita chronic dialysis facilities in the South Bay Los Angeles area (see the NIED Study website [www.NIEDStudy.org] for more details).(4, 5, 21–26) Included were outpatients who had been undergoing treatment for at least 8 weeks, who were 18 years or older and who signed the Institutional Review Board approved consent form. Participants with acute infections or an anticipated life expectancy of less than six months (e.g. due to a metastatic malignancy or advanced HIV/AIDS disease) were excluded.
From October 1, 2001, through December 31, 2006, a total of 893 patients from eight DaVita dialysis facilities in the Los Angeles South Bay area signed the informed consent form. Repeated evaluations were performed on these persons every 6 months for up to 10 semi-annual rounds while they were attending their routine dialysis treatment sessions. One out of every five of these patients was invited randomly to come to the Harbor-UCLA campus to undergo additional tests including body composition measures at the General Clinical Research Center. In each patient, body composition assessments were performed simultaneously within a single one to 2- hr General Clinical Research Center visit on the day following a routine hemodialysis treatment. All participants refrained from eating and drinking for at least 4 hours before the tests, and did not consume alcohol or exercise for 24 hours before the testing.
Anthropometric Measures
Participants were weighed wearing a hospital gown, with no footwear. Body weight was measured to the nearest 0.1 kg on a GSE digital platform scale, model 350 (GSE Scale Systems, www.gse-inc.com[nd1]) Height was measured to the nearest 0.1 cm using a wall mounted stadiometer (model S100; Ayrton Co[nd2]rp) with participants standing erect and arms hanging freely at their sides. Lange calipers (Cambridge Scientific Instruments, www.cambridgescientific.com) were used to measure triceps skinfold thickness as described in the Anthropometric Standardization Reference Manual.(27) Triplicate measurements were taken from the arm not without the dialysis vascular access. In this study, triceps skinfold was used as an index test to estimate body fat using a series of conventional regression equations based on age and gender (see Item S1, provided as supplementary material accompanying this article at www.ajkd.org).(28, 29)
DEXA
The reference test for assessment of body composition was DEXA performed with a Hologic Series Delphi-A Fan (30)Beam X-ray Bone Densitometer with software version 12.4 (Hologic Inc., www.hologic.com). Measurements were performed as previously described. (7–9) with participants wearing a hospital gown, with no metal snaps, and all artifacts removed. Participants were lying supine on the table, centered in the scan field with arms at their sides, palms down and thighs separated. Legs were rotated inward 25 degrees until their toes touched each other and then taped together to maintain this position. Scans were analyzed using the whole body fan beam method to determine lean mass, fat mass, bone mineral content and percentage total body fat. Precision of body composition analysis was determined by weekly quality control assessments using a Whole Body Phantom and Tissue Calibration Step Phantom, composed of soft tissue and lean tissue equivalent materials.(7–9)
NIR Interactance
To estimate the percentage of body fat and fat-free body mass, NIR interactance was measured at the same time as the anthropometric measurements.(6, 14, 16) A commercial NIR interactance sensor with a coefficient of variation of 0.5% for total body fat measurement (portable Futrex 6100®, www.futrex.com) was used. NIR interactance measurements were performed by placing a Futrex® sensor for several seconds on the upper aspect of the arm without a vascular access, and entering the required data (date of birth, gender, weight and height) of each patient. NIR interactance measurements of body fat appear to correlate significantly with other nutritional measures in patients.(6, 31)
BIA
Single frequency bioelectrical impedance analysis was performed using a BIA-Quantum analyzer (RJL Systems, www.rjlsystems.com). Resting EGC Electrodes (RJL Systems) were placed on the non-access side of the patient following standard tetrapolar technique. Electrodes were placed on the dorsal surfaces of the hand and foot proximal to the metacarpal-phalangeal and metatarsal-phalangeal joints, between the distal prominences of the radius and the ulna and between the medial and lateral malleoli. Measurements were taken in the supine position with arms and legs abducted from the body, within 5 minutes of the patient lying down.(11–13) An electrical current of 800µA at 50kHz is introduced into the subject and resistance and reactance were measured. Impedance circuitry of the analyzer was tested monthly with a 500 ohm test resistor. Total body fat percentage was estimated using Kushner, Lukaski and Segal equations separately (see Item S1).(32–34)
Laboratory Tests
Pre-dialysis blood samples and post-dialysis serum urea nitrogen were obtained on a mid-week day which coincided chronologically with the drawing of quarterly blood tests in the DaVita facilities. The single-pool Kt/V was used to represent the weekly dialysis dose. All routine laboratory measurements were performed by DaVita® Laboratories (www.davita.com) using automated methods.
Statistical Methods
The Pearson’s correlation coefficient between DEXA-measured body fat percentage, the reference test, and other body fat estimates, the index tests, including triceps skinfold, NIR interactance and BIA (the latter estimated by three distinct regression equations, i.e. Segal, Lukaski and Kushner), were examined in all participants and in each gender separately. To examine differences between DEXA-measured body fat percentage and other methods, we employed both the Difference plots with Pearson correlations tests (35) and Bland-Altman plots with Pitman test for trend (36). The Difference plot is a graphical tool with related simple statistics for comparison of a field method with a Reference Method, focusing on identity within the inherent analytical imprecision or acceptability within analytical quality specifications.(35) In this article results from the Difference test are illustrated whereas Bland-Altman tests have also been performed for comparsion. McNemar’s test was used to compare the alternative methods on the proportion of participants with body fat measured within 3.5% of DEX-measured body fat percentage. Repeated measures analysis of variance (ANOVA) with Bonferroni adjustment for multiple comparisons was employed to examine the mean difference of DEXA-measured percentage total body fat and other body composition measurements. Unless otherwise stated, results are summarized as mean±SD (standard deviation). A p-value <0.05 was considered to be statistically significant and a p-value >0.2 was considered a lack of a meaningful difference. Statistical analyses were carried out with SAS 9.2 (SAS Corporation, www.sas.com) and Stata 10.1 (Stata Corporation, www.stata.com).
Results
Among outpatients who were followed during the 5-year NIED Study in their dialysis clinics, 118 participants traveled to the Harbor-UCLA campus and underwent all four measurements of body composition (DEXA, BIA, NIR interactance, and triceps skinfold) during the same day in the General Clinical Research Center Outpatient Unit. Table 1 shows the general characteristics of the study population.
Table 1.
Demographic and clinical characteristics of study participants upon first body composition measurement
| Total (N= 118) |
Women (n= 50) |
Men (n= 68) | |
|---|---|---|---|
| Age* | 49.4±11.5 | 48.6±12.0 | 50.0±11.2 |
| Diabetes (%)* | 52 | 44 | 57 |
| Race/ethnicity (%)* | |||
| African-American | 40 | 44 | 37 |
| Hispanic | 38 | 36 | 40 |
| Weight (kg) | 74.5±18.4 | 70.8±19.8 | 77.2±16.9 |
| Height (cm) | 165.9±9.6 | 158.7±7.3 | 171.2±7.5 |
| Body mass index (kg/m2) | 27.0±6.0 | 27.9±6.6 | 26.3±5.4 |
| DEXA-measured total body fat (%) | 28.9±10.1 | 35.3±8.5 | 24.1±8.5 |
| Dialysis vintage (months) | 41.1±32.9 | 46.1±38.8 | 37.3±27.2 |
| Dialysis dose (Kt/V) | 1.7±0.3 | 1.8±0.3 | 1.6±0.3 |
| nPCR (gr/kg per day) | 1.1±0.2 | 1.1±0.3 | 1.1±0.2 |
| Albumin (gr/dl) | 4.0±0.3 | 3.9±0.3 | 4.1±0.3 |
| Creatinine (mg/dl) | 10.8±3.0 | 10.0±2.9 | 11.3±2.9 |
| Total iron binding capacity (mg/dl) [nd4] | 210.9±35.3 | 204.3±33.1 | 215.7±36.3 |
| Hemoglobin (gr/dl) | 12.2±0.7 | 12.1±0.7 | 12.3±0.7 |
| Prealbumin (transthyretin) (mg/dl) | 30.6±9.6 | 29.6±7.9 | 31.4±10.6 |
| Total cholesterol (mg/dl) | 147.2±41.1 | 156.0±43.5 | 140.8±38.3 |
| LDL cholesterol (mg/dl) | 80.9±28.9 | 87.4±34.4 | 76.1±23.1 |
| HDL cholesterol (mg/dl) | 36.1±13.4 | 39.2±15.9 | 33.8±10.9 |
| Triglycerides (mg/dl) | 148.2±122.6 | 142.1±80.3 | 152.7±146.5 |
| Serum urea nitrogen (mg/dl) | 63.0±16.2 | 61.6±16.4 | 64.1±16.1 |
Footnote: Values are presented as mean ± standard deviation or percentage.
Abbreviations: DEXA, dual energy X-ray absorptiometry; nPCR normalized protein catabolic rate, HDL, high-density lipoprotein; LDL, low-density lipoprotein.[nd5]
conversion factors for units: albumin in g/dL to g/L, ×10; creatinine in mg/dL to umol/L, ×88.4; iron binding capacity in ug/dL to umol/L[ND6], ×0.179; hemoglobin in g/dL to g/L, ×10; LDL and HDL cholesterol in mg/dL to mmol/L, ×0.02586; triglycerides in mg/dL to mmol/L, ×0.01129; serum urea nitrogen in mg/dL to mmol/L ×0.357.
Table 2 and Figure 1 show the distribution of total body fat percentage measured using six methods, i.e., DEXA, triceps skinfold, and NIR interactance as well as BIA calculated by three different regression equations (Segal, Kushner and Lukaski). As shown in Figure 1, compared with DEXA, the BIA-Kushner and NIR interactance methods were more accurate for estimating percentage total body fat, whereas triceps skinfold, BIA-Segal and BIA-Lukaski overestimated the DEXA-measured body fat. Table 2 also shows percentage total body fat estimates for each of the two genders considered separately indicating that women have higher body fat regardless of the methodology employed. The skinfold caliper-based method and BIA-Segal were the least consistent with DEXA measurements, with less than 35% of the measures being within +/−3.5% of DEXA measures, whereas other methods had 40% or more estimates within this range. The accuracy of body fat estimation was different between genders with all index tests having more measures being within +/−3.5% of DEXA in women (triceps skinfold, 48% vs. 25%; NIR interactance, 52% vs. 38%; BIA-Kushner, 60% vs. 49%; BIA-Segal, 70% vs. 7%; BIA-Lukaski, 50% vs. 34% in women and men respectively).
Table 2.
Total body fat estimations using different methods of body composition assessment
| Total (N= 118) |
Women (n= 50) |
Men (n= 68) | Percentage Within ±3.5% of DEXA † |
|
|---|---|---|---|---|
| DEXA | 28.9±10.1 | 35.3±8.5 | 24.1±8.5 | |
| NIR interactance | 26.4±10.4 | 34.1±7.7 | 20.7±8.2 | 44% |
| Triceps skinfold | 31.0±8.4 | 34.6±7.1 | 28.3±8.4 | 34% |
| BIA | ||||
| Segal | 35.0±8.0 | 37.6±7.9 | 33.1±7.5 | 33% |
| Kushner | 27.1±11.7 | 33.7±9.4 | 22.3±10.9 | 53%* |
| Lukaski | 32.88±11.2 | 39.1±8.5 | 28.1±10.7 | 40% |
Estimates of total body fat are given as percentages.
McNemar’s test was used to compare the alternative methods on the proportion of patients with body fat measured within 3.5% of DEXA-measured body fat percentage.
p<0.001 vs. triceps skinfold and BIA-Segal
DEXA, Dual energy X-ray absorptiometry; NIR, near infrared; BIA, bioelectrical impedance analysis
Figure 1.
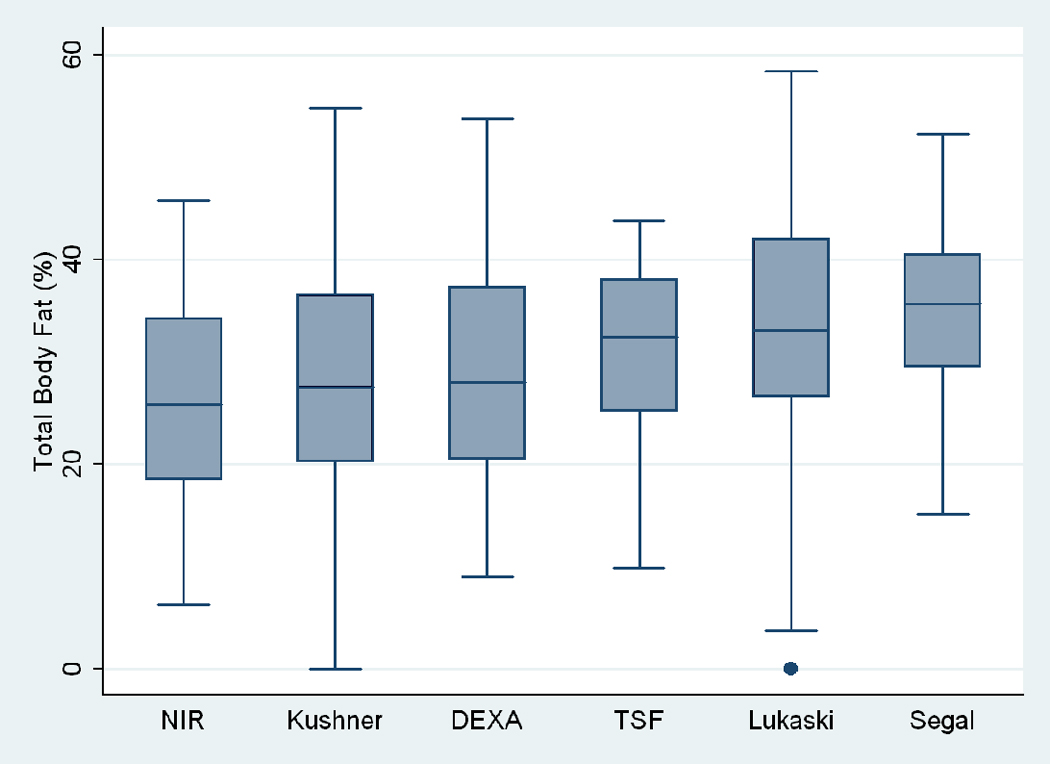
Box plots of total body fat % measured by using different methods in maintenance hemodialysis patients. The lower and upper box boundaries are the 25th and 75th percentiles, the line within the box is the median, and the whiskers extend to 1.5*IQR, where IQR=75th-25th percentile. TSF, triceps skinfold.
Figure 2 illustrates Difference plot analyses and provides the Pearson correlation test results between DEXA and each of the other five methods. BIA- Kushner was the most consistent with DEXA, in that its measurement bias was not correlated with body fatness (r=0.14, p=0.1;Panel D of Figure 2). Both BIA-Kushner and NIR interactance underestimated percentage total body fat (Panel D and A). However, using Bland-Altman test, the NIR interactance was most consistent with DEXA, as indicated by lowest Pitmam’s r (−0.06) and highest p-value (p=0.5) (data not shown). Triceps skinfold tended to overestimate percentage total body fat among lean participants (Panel B). Difference plot analyses also showed that BIA-Lukaski tended toward overestimation regardless of total body fat while BIA-Segal had a greater tendency for overestimation in leaner participants (Panels C and E). BIA-Kushner, triceps skinfold and NIR interactance had smaller mean differences in estimated percentage total body fat (mean difference with DEXA of 1.8%, –2.1% and 2.5%, respectively). In Bland-Altman analyses the BIA-Kushner assessment underestimated percentage total body fat particularly in leaner participants (data not shown).
Figure 2.
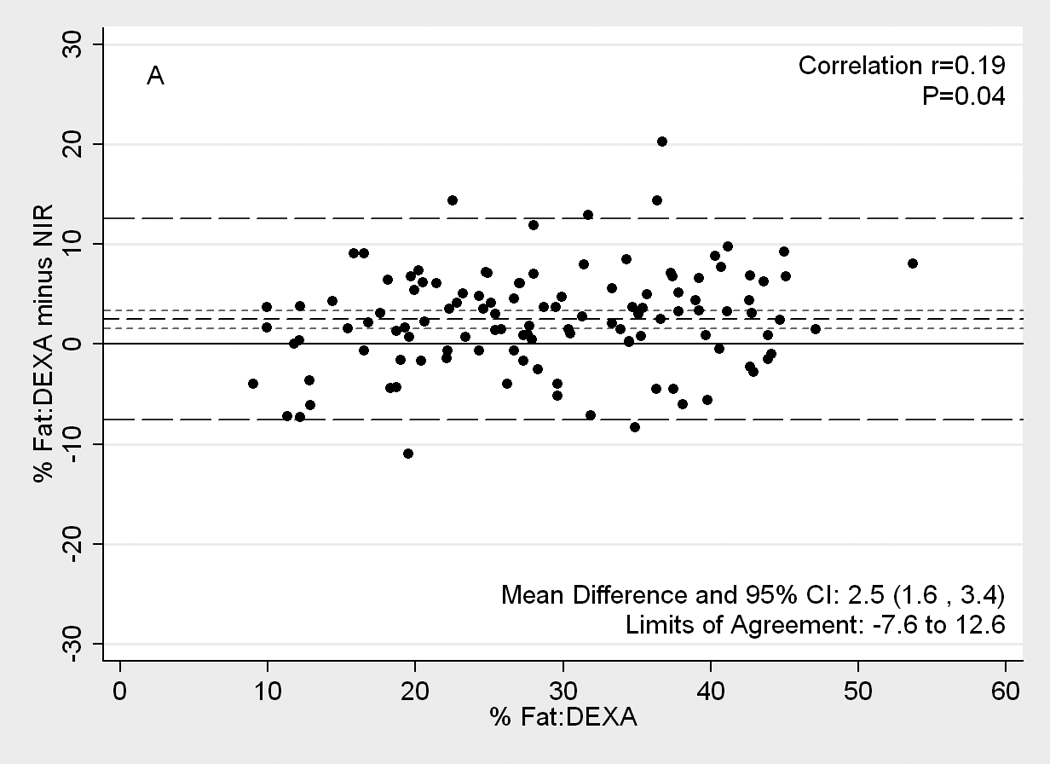
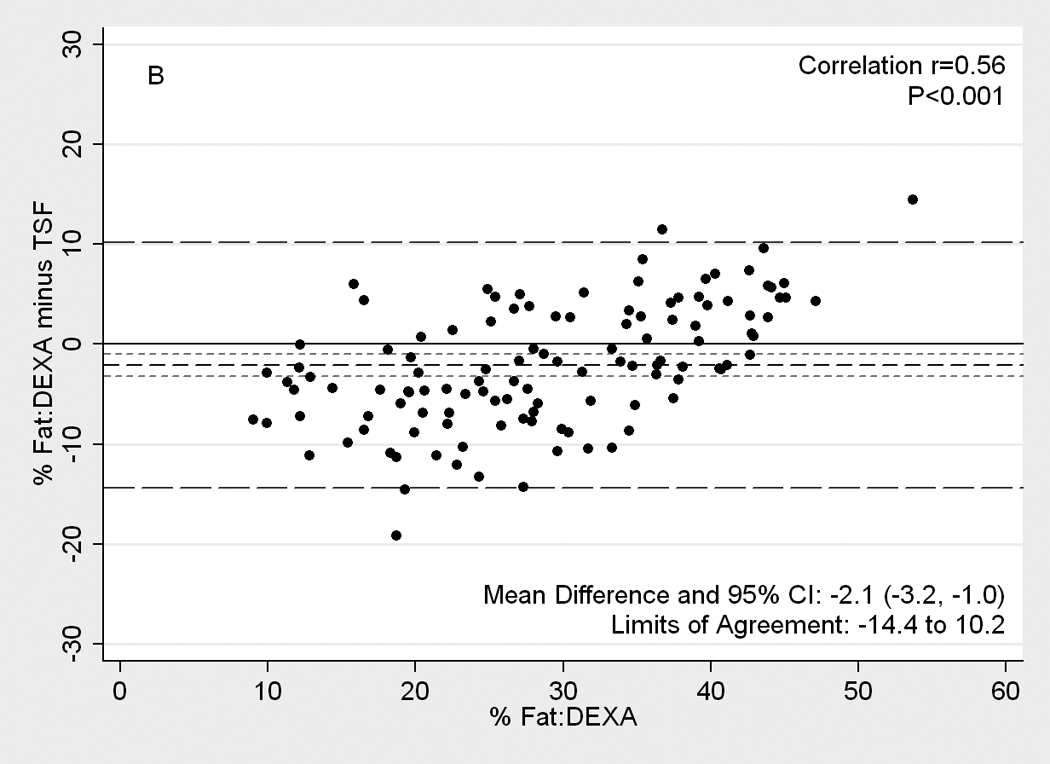
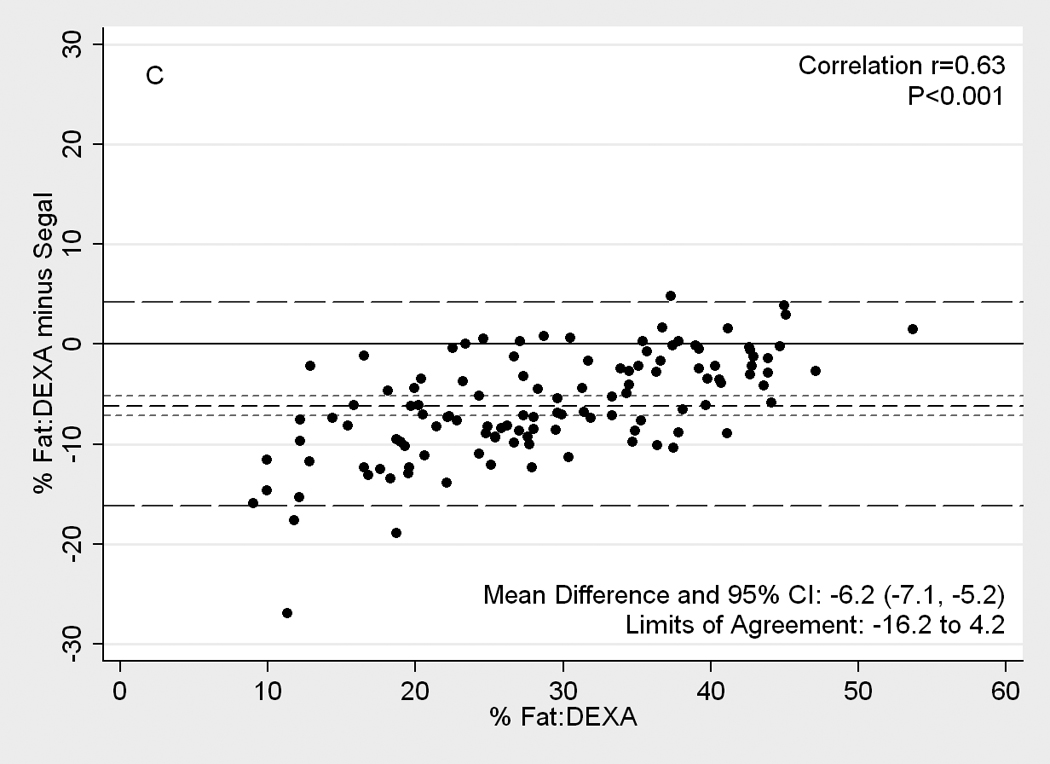
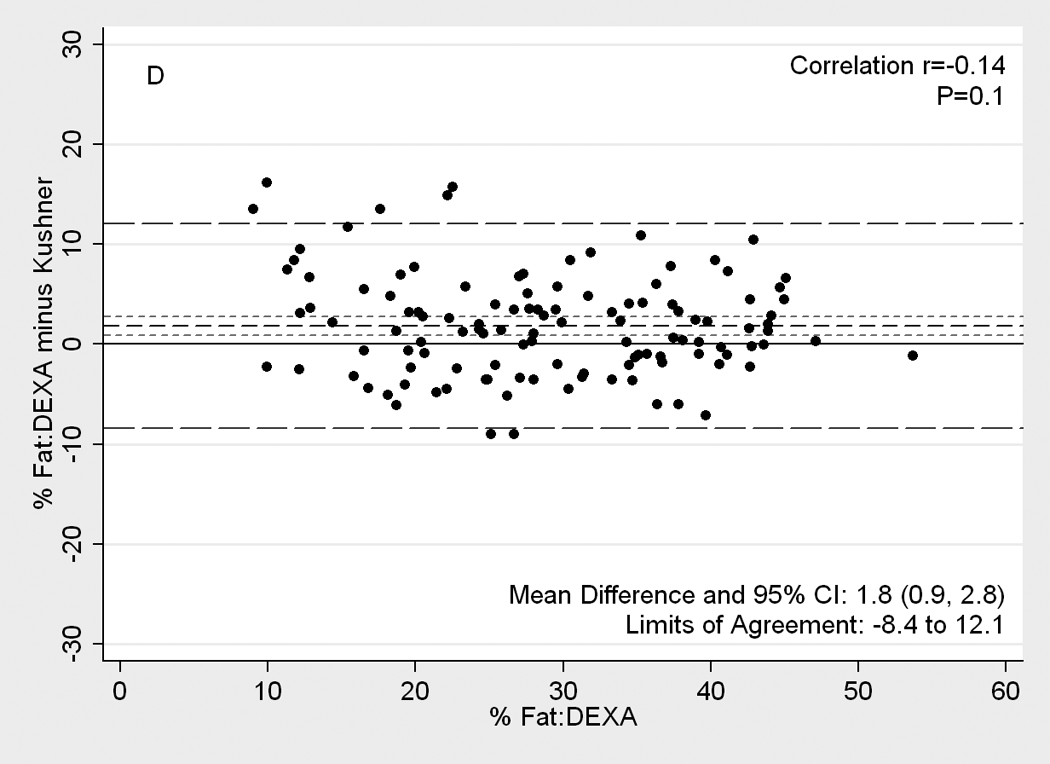
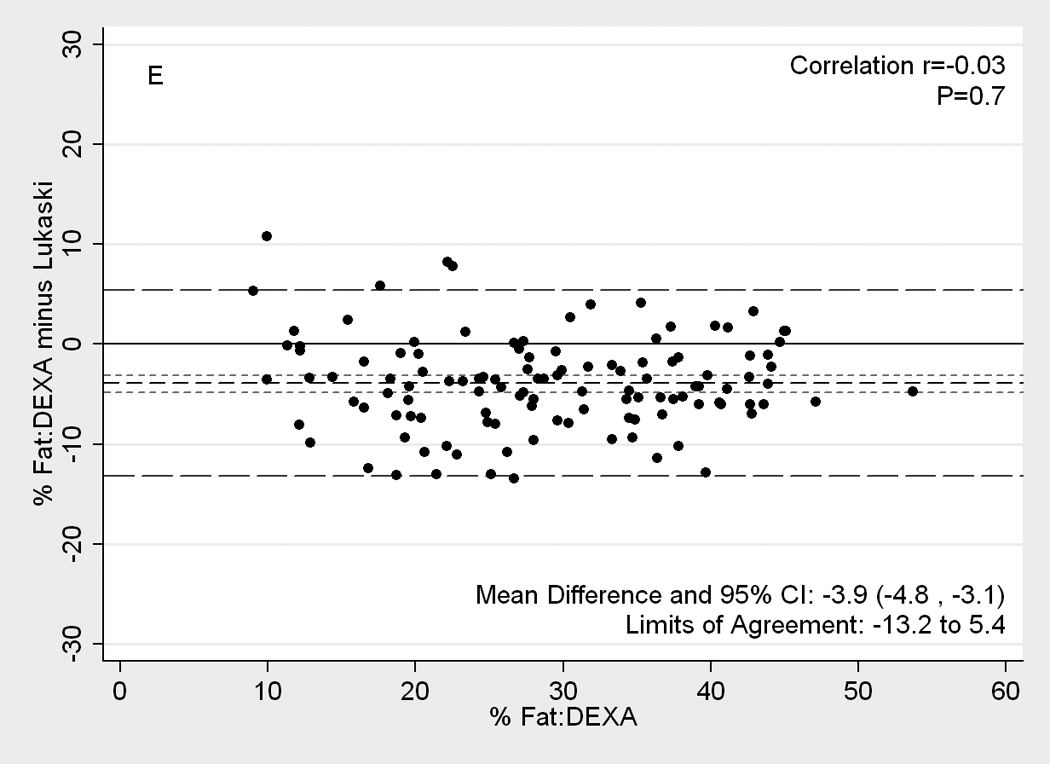
[nd8]Difference plots between DEXA as reference standard and other methods of body composition assessment in 118 patients. Medium dashed line is the difference, long dashed lines are limits of agreement (mean±2SD) and short dashed lines are 95% confidence intervals for the difference. Panels show difference of DEXA-measured total body fat percentage and (A) NIR (near infrared) interactance, (B) triceps skinfold (TSF), (C) bioelectrical impedance analysis (BIA) Segal equation, (D) BIA-Kushner, (E) BIA-Lukaski.
The mean difference and limits of agreement between DEXA-measured and other estimates of body fat in men and women and also in African American men and women combined are shown in Table 3. Repeated measures ANOVA analysis showed that in women triceps skinfold, NIR interactance and BIA-Kushner had smaller mean differences in estimated mean percentage total body fat (mean difference with DEXA of 0.7%, 1,.2% and 1.6% respectively). Similarly, in men BIA-Kushner and NIR interactance had the smallest mean differences with DEXA-measured percentage total body fat (2.0% and 3.4%, respectively). Additional sensitivity analyses in African-American participants (n=47, both genders combined) showed similar results to those seen in the women. Table 4 shows that the BIA and NIR interactance measured percentage total body fat had strong linear correlation with DEXA (r values≥0.87), whereas triceps skinfold showed poorer correlation in both men and women.
Table 3.
[nd7]Difference Plot comparison of DEXA-measured body fat percentage and other estimates of body fat in 118 patients
| Limits of agreement |
Mean difference (95% CI) |
P** | Correlation* (r) |
Correlation P-value |
|
|---|---|---|---|---|---|
| Women (n= 50) | |||||
| triceps skinfold | −9.1 to 10.6 | 0.7 (−0.7, 2.1) | 0.9 | 0.55 | <0.001 |
| NIR interactance | −7.7 to 10.1 | 1.2 (−0.1, 2.5) | 0.3 | 0.42 | 0.002 |
| BIA | |||||
| Segal | −8.8 to 4.2 | −2.3 (−3.2, −1.4) | <0.001 | 0.36 | 0.01 |
| Kushner | −6.6 to 9.9 | 1.6 (0.5, 2.8) | 0.04 | 0.004 | 0.9 |
| Lukaski | −11.5 to 3.8 | −3.8 (−4.9, −2.7) | <0.001 | 0.21 | 0.1 |
| Men (n= 68) | |||||
| triceps skinfold | −16.5 to 8.1 | −4.2 (−5.7, −2.7) | <0.001 | 0.38 | 0.001 |
| NIR interactance | −7.2 to 14.0 | 3.4 (2.1, 4.7) | <0.001 | 0.36 | 0.003 |
| BIA | |||||
| Segal | −18.0 to 0.0 | −9.0 (−10.1, −7.9) | <0.001 | 0.47 | <0.001 |
| Kushner | −9.6 to 13.6 | 2.0 (0.6, 3.4) | 0.03 | −0.23 | 0.06 |
| Lukaski | −14.4 to 6.5 | −4.0 (−5.2, −2.7) | <0.001 | −0.19 | 0.12 |
| African American (n=47) | |||||
| triceps skinfold | −13.7 to 10.2 | −1.7 (−3.4, 0.0) | 0.2 | 0.58 | <0.001 |
| NIR interactance | −7.5 to 12.3 | 2.4 (1.0, 3.8) | 0.01 | 0.14 | 0.3 |
| BIA | |||||
| Segal | −18.1 to 4.9 | −6.6 (−8.2, −4.9) | <0.001 | 0.77 | <0.001 |
| Kushner | −9.0 to 12.5 | 1.8 (0.2, 3.3) | 0.1 | −0.20 | 0.2 |
| Lukaski | −12.9 to 5.6 | −3.6 (−4.9, −2.3) | <0.001 | −0.11 | 0.4 |
Pearson correlation between difference and DEXA values.
Significance calculated by repeated measures ANOVA with Bonferroni adjustment.
Abbreviations: CI, confidence interval; DEXA, Dual energy X-ray absorptiometry; NIR, near infrared; BIA, bioelectrical impedance analysis
Table 4.
Pearson’s correlation coefficients (r) between DEXA-measured body fat and other estimates of body fat
| Total (N= 118) | Women (n= 50) | Men (n= 68) | |
|---|---|---|---|
| NIR interactance | 0.88 | 0.85 | 0.80 |
| triceps skinfold | 0.79 | 0.81 | 0.73 |
| BIA | |||
| Segal | 0.87 | 0.92 | 0.85 |
| Kushner | 0.91 | 0.90 | 0.87 |
| Lukaski | 0.91 | 0.90 | 0.88 |
All P- values <0.001
Abbreviations: DEXA, Dual energy X-ray absorptiometry; NIR, near infrared; BIA, bioelectrical impedance analysis
Table 5 shows Pearson’s correlation coefficients between BMI and all estimates of percentage total body fat. In both men and women, total body fat percentage measured by NIR interactance and BIA-Segal had strong linear correlation with BMI (r values≥0.85), whereas triceps skinfold showed poorer correlation in both men and women (r values < 0.63). Overall, BIA-Segal had the strongest linear correlation with BMI (r = 0.90).
Table 5.
Pearson’s correlation coefficients (r) between body mass index and estimates of body fat
| Total (N= 118) | Women (n= 50) | Men (n= 68) | |
|---|---|---|---|
| DEXA | 0.72 | 0.82 | 0.76 |
| NIR interactance | 0.74 | 0.89 | 0.85 |
| triceps skinfold | 0.60 | 0.63 | 0.58 |
| BIA | |||
| Segal | 0.90 | 0.89 | 0.94 |
| Kushner | 0.64 | 0.72 | 0.64 |
| Lukaski | 0.65 | 0.76 | 0.64 |
All P- values <0.001
Abbreviations: DEXA, dual energy X-ray absorptiometry; NIR, near infrared; BIA, bioelectrical impedance analysis
Discussion
We examined three field methods performed with portable instruments to estimate percentage total body fat in individuals. When cross-validated against DEXA measurements, these methods are considered to give an accurate assessment of percentage total body fat in this population.(7–9, 37) There was reasonable concordance with BIA-Kushner and NIR interactance on the basis of both Difference Plots and Bland Altman analyses as well as McNemar’s tests in 118 participants. Of the methods tested, BIA-Kushner, triceps skinfold, and NIR interactance showed the smallest mean difference with DEXA (1.8%, −2.1% and 2.5%, respectively). Of these, BIA-Kushner and NIR interactance were the methods in which the bias in measuring percentage total body fat was not correlated with the amount of body fat, making it a relatively bias-free method. The NIR interactance assessment underestimated percentage total body fat in overweight and obese and BIA-Kushner in leaner participants, according to Difference Plot and Bland-Atman, respectively, whereas triceps skinfold overestimated percentage total body fat in leaner participants according to both statistical analyses. The observed differences in percentage total body fat estimates between the index methods and DEXA persisted across genders and in African-Americans, with the exception of the triceps skinfold percent body fat in men. BIA-Kushner, NIR interactance and BIA-Lukaski had comparatively better predictive accuracy with 53%, 44% and 40% of measurements within +/−3.5% of percentage total body fat by DEXA, respectively. Nevertheless, there are significant variations in the estimation of percentage total body fat in patients based on the technique employed as well as the method of calculation.
Accurate and reliable field methods to assess body composition in persons with CKD and in particular in and other dialysis patients are essential to their clinical management, given the consistent evidence of strong and robust associations between protein-energy status and survival in these patients.(2–4) Body composition assessments provide important clinical information about CKD patients, which are needed in order to prescribe and monitor appropriate clinical and nutritional therapies.(38) However, virtually all body composition methods were originally developed in healthy individuals. Although these methods are commonly used in patients with chronic disease states and wasting syndrome such as dialysis patients, their application to such populations may be affected by the incompatibility of underlying assumptions with the dynamic effects of dialysis on body composition.(39–42)
DEXA is one of the reference methods for the assessment of body composition in CKD patients.(37) DEXA measurements are based on a three-compartmental model (total body minerals, fat-free soft or lean mass, and fat tissue mass).(7–9) It can also distinguish regional as well as whole body parameters of body composition. The equipment is expensive, and requires trained personnel to operate. DEXA is, however, not feasible for routine use in most CKD patients due to its technical complexity, its space-occupying scanner (requiring participants to be in supine position), exposure to radiation, relatively high cost, and need for trained and licensed personnel.(7)
Skinfold measurements using a skinfold caliper have traditionally been used as a convenient and non-invasive method for estimating percent body fat despite its limited reproducibility and precision due to high measurement variability.(9, 10, 43) Assuming a higher body fat with higher skinfold thickness, regression equations have been developed to calculate total body fat. Although there is no specific site that is universally acceptable for estimating body fat in all genders, ages and ethnicities, the triceps skinfold is commonly used. (28) In the present study we found that compared to DEXA, triceps skinfold overestimates the percentage total body fat in participants by 2.1%, especially in leaner participants (Pitman r=0.29, p<0.001). Not surprisingly, the overestimation by triceps skinfold was seen in men rather than women (−4.2% and 0.7% respectively) whose mean body fat was significantly lower. This finding is consistent with several studies in the general population.(44–46) In a very controlled environment with highly trained anthropometry technicians, triceps skinfold proved to be a reliable method in this population.
BIA, a relatively simple and inexpensive field method, has been validated both in normal subjects and in patients with chronic diseases.(33, 47, 48) Indeed, BIA can be used to assess fluid status and adequacy of dialysis treatment in patients.(7, 42, 49) Stall et al (50) showed that BIA-Segal (51) overestimated body fat by 5% from DEXA and that this bias increased as body fat increased. In our study, we found a similar overestimate (mean difference of 6.2%). Similar to Oe et al (52) who found that the choice of BIA equation has a significant impact on its measurement accuracy, the BIA based results from the three equations tested in our study also performed differently both in terms of the absolute limits of agreement with DEXA and in the direction of the difference. BIA-Segal and BIA-Lukaski overestimated percent body fat by 6.2% and 3.9%, respectively, while BIA-Kushner underestimated percent body fat, but only by 1.8%. BIA-Kushner also had the highest level of accuracy compared to the other methods.
The NIR interactance technology is based on principles of light absorption and reflection using near-infrared spectroscopy.(53) The bicep is the most often used single site for estimating body fat using the NIR interactance method. Elia et al (53) reported that NIR interactance underestimated body fat in very obese participants. Young et al (54) reported that NIR interactance presented the best standard error of estimates (3.5%) and the best correlation (r=0.84) with hydrostatic weighing. However, Moon et al (55) recently reported both poor correlation (r < 0.80) and high standard error of estimates (>4.0% fat) in men with a mean percentage total body fat of 16%. In dialysis patients, NIR interactance has proven to be well correlated with subjective global assessment, anthropometric measurements and nutritionally relevant biochemical parameters (31) and to have a high degree of reproducibility and was independent of the fluid status.(16) Kamimura et al (56) reported that NIR interactance progressively underestimated body fat in comparison with BIA in patients with higher amounts of body fat. We found that NIR interactance was the only method in which the bias was constant over the entire range of body fat.
NIR interactance uses light at wavelengths of 650–1000 nm that passes through skin and subcutaneous tissues, but is absorbed by chromophores such as melanin and hemoglobin, which determine skin color.(16, 31) Since skin color can explain up to 16% of the variability in optical density measured using NIR interactance at the biceps (57), participants with darker skin may have higher optical density values which results in a greater underestimation of NIR interactance-based percent body fat (17, 18). Hortobagyi et al (58) reported that skin color does not affect NIR interactance, since correlation coefficients between optical density and skinfold thickness measures are identical in Caucasian and African Americans. In our present study, the mean difference in body fat between NIR interactance and DEXA in African American participants was 2.4 % (95% CI: 0.9 – 3.9%), suggesting that skin color did not appear to affect the Difference Plot or Bland-Altman comparison.
A potential limitation of our study is that measurements were performed one day after hemodialysis treatments, instead of immediately thereafter, leading to more fluid retention. This timing, however, is more likely to reflect conditions in which measurements are made under normal clinical circumstances. BIA is most likely to be affected by this limitation. Given the agreement between BIA-Kushner and DEXA, either both methods are equally affected by the fluid imbalance or the Kushner equation corrects for fluid status. Even though NIR interactance and triceps skinfold measurements were performed on a single arm, our findings suggest that NIR interactance may be one of the very few methods unaffected by fluid variations typical of dialysis patients despite the said limitation. Although the mean difference was small compared to DEXA percentage total body fat, there was greater variability and significant bias compared to the other portable devices. Furthermore, skinfold thickness measurements require highly trained technicians which are not always available in clinical settings. Finally, we did not compare DEXA or field methods to underwater weighing or air displacement techniques; however, these techniques are even more time-consuming and cumbersome to perform in patients.
In conclusion, this study provides clinically relevant data regarding the validity of field methods to estimate body fat in patients. Field methods that evaluate body composition are needed in this population where malnutrition is a major cause of morbidity and mortality. While BMI and waist circumference are easy to measure, they do not provide information on energy balance, energy stores or fluid status. Our findings suggest that BIA-Kushner and NIR interactance appear to be acceptable field methods to use when DEXA or trained anthropometry technicians are not available. Furthermore, we found that the validity of NIR interactance in African-American participants is similar to that of other races. The effect of total body or regional alterations in water content or body fat on anthropometric and body composition measurements in dialysis patients is not well understood. The abnormal hydration status associated with CKD and dialysis treatment alters the assumptions underlying anthropometric and body composition methods. Clearly a better understanding of the body composition of dialysis patients is needed,(59) which we attempted in this study. Additional studies are needed to verify and extend our findings.
Supplementary Material
Acknowledgements
The authors are thankful to Dr Peter Christenson, Biostatistician at Harbor-UCLA General Clinical Research Center for extensive help with statistical methods and data analysis. They are also indebted to hard-working collaborating dietitians in 10 DaVita dialysis facilities in Los Angeles South Bay area and DaVita teammates in these facilities, as well as DaVita Clinical Research.
Support: This study was supported by a National Institutes of Health (NIH) National Institute of Diabetes, Digestive and Kidney Disease grants K23-DK61162 and R21-DK078012 Drs Kalatnar-Zadeh and Kovesdy). Additional sources of funding include a research grants from Watson Pharmaceuticals, DaVita Clinical Research, Harold Simmons (Dr Kalatnar-Zadeh), and General Clinical Research Center grant M01-RR00425 from the NIH National Centers for Research Resources.
Footnotes
Publisher's Disclaimer: This is a PDF file of an unedited manuscript that has been accepted for publication. As a service to our customers we are providing this early version of the manuscript. The manuscript will undergo copyediting, typesetting, and review of the resulting proof before it is published in its final citable form. Please note that during the production process errors may be discovered which could affect the content, and all legal disclaimers that apply to the journal pertain.
Financial Disclosure: The authors declare that they have no relevant financial interests.
Supplementary Material
Item S1: Technical appendix.[nd3]
Note: The supplementary material accompanying this article (doi:_______) is available at www.ajkd.org.
References
- 1.Fouque D, Kalantar-Zadeh K, Kopple J, et al. A proposed nomenclature and diagnostic criteria for protein-energy wasting in acute and chronic kidney disease. Kidney Int. 2008;73:391–398. doi: 10.1038/sj.ki.5002585. [DOI] [PubMed] [Google Scholar]
- 2.Kovesdy CP, Kalantar-Zadeh K. Why is protein-energy wasting associated with mortality in chronic kidney disease? Semin Nephrol. 2009;29:3–14. doi: 10.1016/j.semnephrol.2008.10.002. [DOI] [PMC free article] [PubMed] [Google Scholar]
- 3.Kalantar-Zadeh K, Kilpatrick RD, Kuwae N, et al. Revisiting mortality predictability of serum albumin in the dialysis population: time dependency, longitudinal changes and population-attributable fraction. Nephrol Dial Transplant. 2005;20:1880–1888. doi: 10.1093/ndt/gfh941. [DOI] [PubMed] [Google Scholar]
- 4.Rambod M, Kovesdy CP, Bross R, Kopple JD, Kalantar-Zadeh K. Association of serum prealbumin and its changes over time with clinical outcomes and survival in patients receiving hemodialysis. Am J Clin Nutr. 2008;88:1485–1494. doi: 10.3945/ajcn.2008.25906. [DOI] [PMC free article] [PubMed] [Google Scholar]
- 5.Rambod M, Bross R, Zitterkoph J, et al. Association of Malnutrition-Inflammation Score with quality of life and mortality in hemodialysis patients: a 5-year prospective cohort study. Am J Kidney Dis. 2009;53:298–309. doi: 10.1053/j.ajkd.2008.09.018. [DOI] [PMC free article] [PubMed] [Google Scholar]
- 6.Kalantar-Zadeh K, Kuwae N, Wu DY, et al. Associations of body fat and its changes over time with quality of life and prospective mortality in hemodialysis patients. Am J Clin Nutr. 2006;83:202–210. doi: 10.1093/ajcn/83.2.202. [DOI] [PubMed] [Google Scholar]
- 7.Donadio C, Halim AB, Caprio F, Grassi G, Khedr B, Mazzantini M. Single- and multi-frequency bioelectrical impedance analyses to analyse body composition in maintenance haemodialysis patients: comparison with dual-energy x-ray absorptiometry. Physiol Meas. 2008;29:S517–S524. doi: 10.1088/0967-3334/29/6/S43. [DOI] [PubMed] [Google Scholar]
- 8.Negri AL, Barone R, Veron D, et al. Lean mass estimation by creatinine kinetics and dual-energy x-ray absorptiometry in peritoneal dialysis. Nephron Clin Pract. 2003;95:c9–c14. doi: 10.1159/000073013. [DOI] [PubMed] [Google Scholar]
- 9.Kamimura MA, Avesani CM, Cendoroglo M, Canziani ME, Draibe SA, Cuppari L. Comparison of skinfold thicknesses and bioelectrical impedance analysis with dual-energy X-ray absorptiometry for the assessment of body fat in patients on long-term haemodialysis therapy. Nephrol Dial Transplant. 2003;18:101–105. doi: 10.1093/ndt/18.1.101. [DOI] [PubMed] [Google Scholar]
- 10.Oe B, de Fijter CW, Oe PL, Stevens P, de Vries PM. Four-site skinfold anthropometry (FSA) versus body impedance analysis (BIA) in assessing nutritional status of patients on maintenance hemodialysis: which method is to be preferred in routine patient care? Clin Nephrol. 1998;49:180–185. [PubMed] [Google Scholar]
- 11.Di Iorio BR, Scalfi L, Terracciano V, Bellizzi V. A systematic evaluation of bioelectrical impedance measurement after hemodialysis session. Kidney Int. 2004;65:2435–2440. doi: 10.1111/j.1523-1755.2004.00660.x. [DOI] [PubMed] [Google Scholar]
- 12.Kushner RF, Roxe DM. Bipedal bioelectrical impedance analysis reproducibly estimates total body water in hemodialysis patients. Am J Kidney Dis. 2002;39:154–158. doi: 10.1053/ajkd.2002.29907. [DOI] [PubMed] [Google Scholar]
- 13.Chen Y, Chen H, Yeh J, Chen S, Lin K. Each of anthropometry, bioelectrical impedance analysis and dual-energy X-Ray absorptiometry methods can be used to assess lean body mass in hemodialysis patients. Nephron. 2000;84:374–375. doi: 10.1159/000045614. [DOI] [PubMed] [Google Scholar]
- 14.Bioelectrical impedance analysis in body composition measurement: National Institutes of Health Technology Assessment Conference Statement. Am J Clin Nutr. 1996;64:524S–532S. doi: 10.1093/ajcn/64.3.524S. [DOI] [PubMed] [Google Scholar]
- 15.Kalantar-Zadeh K, Regidor DL, Kovesdy CP, et al. Fluid retention is associated with cardiovascular mortality in patients undergoing long-term hemodialysis. Circulation. 2009;119:671–679. doi: 10.1161/CIRCULATIONAHA.108.807362. [DOI] [PMC free article] [PubMed] [Google Scholar]
- 16.Kalantar-Zadeh K, Block G, Kelly MP, Schroepfer C, Rodriguez RA, Humphreys MH. Near infra-red interactance for longitudinal assessment of nutrition in dialysis patients. J Ren Nutr. 2001;11:23–31. doi: 10.1016/s1051-2276(01)91938-7. [DOI] [PubMed] [Google Scholar]
- 17.Wassenaar EB, Van den Brand JG. Reliability of near-infrared spectroscopy in people with dark skin pigmentation. J Clin Monit Comput. 2005;19:195–199. doi: 10.1007/s10877-005-1655-0. [DOI] [PubMed] [Google Scholar]
- 18.Houmard JA, Israel RG, McCammon MR, O'Brien KF, Omer J, Zamora BS. Validity of a Near-infrared Device for Estimating Body Composition in a College Football Team. Journal of Strength & Conditioning Research. 1991;5:53–59. [Google Scholar]
- 19.Kalantar-Zadeh K, Kovesdy CP, Derose SF, Horwich TB, Fonarow GC. Racial and survival paradoxes in chronic kidney disease. Nat Clin Pract Nephrol. 2007;3:493–506. doi: 10.1038/ncpneph0570. [DOI] [PubMed] [Google Scholar]
- 20.Colman S, Bross R, Benner D, et al. The Nutritional and Inflammatory Evaluation in Dialysis patients (NIED) study: overview of the NIED study and the role of dietitians. J Ren Nutr. 2005;15:231–243. doi: 10.1053/j.jrn.2005.01.003. [DOI] [PubMed] [Google Scholar]
- 21.Kalantar-Zadeh K, Kopple JD, Kamranpour N, Fogelman AM, Navab M. L-inflammatory index correlates with poor outcome in hemodialysis patients. Kidney Int. 2007;72:1149–1156. doi: 10.1038/sj.ki.5002491. [DOI] [PubMed] [Google Scholar]
- 22.Bross R, Zitterkoph J, Pithia J, et al. Association of serum total iron-binding capacity and its changes over time with nutritional and clinical outcomes in hemodialysis patients. Am J Nephrol. 2009;29:571–581. doi: 10.1159/000191470. [DOI] [PMC free article] [PubMed] [Google Scholar]
- 23.Shantouf R, Kovesdy CP, Kim Y, et al. Association of serum alkaline phosphatase with coronary artery calcification in maintenance hemodialysis patients. Clin J Am Soc Nephrol. 2009;4:1106–1114. doi: 10.2215/CJN.06091108. [DOI] [PMC free article] [PubMed] [Google Scholar]
- 24.Rambod M, Kovesdy CP, Kalantar-Zadeh K. Malnutrition-Inflammation Score for risk stratification of patients with CKD: is it the promised gold standard? Nat Clin Pract Nephrol. 2008;4:354–355. doi: 10.1038/ncpneph0834. [DOI] [PubMed] [Google Scholar]
- 25.Rambod M, Kovesdy CP, Kalantar-Zadeh K. Combined high serum ferritin and low iron saturation in hemodialysis patients: the role of inflammation. Clin J Am Soc Nephrol. 2008;3:1691–1701. doi: 10.2215/CJN.01070308. [DOI] [PMC free article] [PubMed] [Google Scholar]
- 26.Raj DS, Shah VO, Rambod M, Kovesdy CP, Kalantar-Zadeh K. Association of Soluble Endotoxin Receptor CD14 and Mortality Among Patients Undergoing Hemodialysis. Am J Kidney Dis. 2009 doi: 10.1053/j.ajkd.2009.06.028. [e-published Sep 2009] [DOI] [PMC free article] [PubMed] [Google Scholar]
- 27.Lohman T, Roche A, Martorell R. Anthropometric Standardization Reference Manual. Champaign, IL: Human Kinetis Books; 1988. [Google Scholar]
- 28.Roche AF, Sievogel RM, Chumlea WC, Webb P. Grading body fatness from limited anthropometric data. Am J Clin Nutr. 1981;34:2831–2838. doi: 10.1093/ajcn/34.12.2831. [DOI] [PubMed] [Google Scholar]
- 29.Durnin JV, Womersley J. Body fat assessed from total body density and its estimation from skinfold thickness: measurements on 481 men and women aged from 16 to 72 years. Br J Nutr. 1974;32:77–97. doi: 10.1079/bjn19740060. [DOI] [PubMed] [Google Scholar]
- 30.DCI Dialysis Clinic Inc homepage. Nashville, TN 37203: Dialysis Clinic, Inc.; 2001–2002. About DCI-Introduction. www.diciinc.org. [Google Scholar]
- 31.Kalantar-Zadeh K, Dunne E, Nixon K, et al. Near infra-red interactance for nutritional assessment of dialysis patients. Nephrol Dial Transplant. 1999;14:169–175. doi: 10.1093/ndt/14.1.169. [DOI] [PubMed] [Google Scholar]
- 32.Kushner RF, Schoeller DA. Estimation of total body water by bioelectrical impedance analysis. Am J Clin Nutr. 1986;44:417–424. doi: 10.1093/ajcn/44.3.417. [DOI] [PubMed] [Google Scholar]
- 33.Lukaski HC, Bolonchuk WW, Hall CB, Siders WA. Validation of tetrapolar bioelectrical impedance method to assess human body composition. J Appl Physiol. 1986;60:1327–1332. doi: 10.1152/jappl.1986.60.4.1327. [DOI] [PubMed] [Google Scholar]
- 34.Segal KR, Van Loan M, Fitzgerald PI, Hodgdon JA, Van Itallie TB. Lean body mass estimation by bioelectrical impedance analysis: a four-site cross-validation study. Am J Clin Nutr. 1988;47:7–14. doi: 10.1093/ajcn/47.1.7. [DOI] [PubMed] [Google Scholar]
- 35.Petersen PH, Stockl D, Blaabjerg O, et al. Graphical interpretation of analytical data from comparison of a field method with reference method by use of difference plots. Clin Chem. 1997;43:2039–2046. [PubMed] [Google Scholar]
- 36.Bland JM, Altman DG. Statistical methods for assessing agreement between two methods of clinical measurement. Lancet. 1986;1:307–310. [PubMed] [Google Scholar]
- 37.Locatelli F, Fouque D, Heimburger O, et al. Nutritional status in dialysis patients: a European consensus. Nephrol Dial Transplant. 2002;17:563–572. doi: 10.1093/ndt/17.4.563. [DOI] [PubMed] [Google Scholar]
- 38.Blumenkrantz MJ, Kopple JD, Gutman RA, et al. Methods for assessing nutritional status of patients with renal failure. Am J Clin Nutr. 1980;33:1567–1585. doi: 10.1093/ajcn/33.7.1567. [DOI] [PubMed] [Google Scholar]
- 39.Stall S, Ginsberg NS, DeVita MV, et al. Percentage body fat determination in hemodialysis and peritoneal dialysis patients: a comparison. J Ren Nutr. 1998;8:132–136. doi: 10.1016/s1051-2276(98)90004-8. [DOI] [PubMed] [Google Scholar]
- 40.Ikizler TA, Sezer MT, Flakoll PJ, et al. Urea space and total body water measurements by stable isotopes in patients with acute renal failure. Kidney Int. 2004;65:725–732. doi: 10.1111/j.1523-1755.2004.00439.x. [DOI] [PubMed] [Google Scholar]
- 41.Dumler F, Schmidt R, Kilates C, Faber M, Lubkowski T, Frinak S. Use of bioelectrical impedance for the nutritional assessment of chronic hemodialysis patients. Miner Electrolyte Metab. 1992;18:284–287. [PubMed] [Google Scholar]
- 42.Chertow GM, Lazarus JM, Lew NL, Ma L, Lowrie EG. Development of a population-specific regression equation to estimate total body water in hemodialysis patients. Kidney Int. 1997;51:1578–1582. doi: 10.1038/ki.1997.216. [DOI] [PubMed] [Google Scholar]
- 43.Woodrow G, Oldroyd B, Smith MA, Turney JH. Measurement of body composition in chronic renal failure: comparison of skinfold anthropometry and bioelectrical impedance with dual energy X-ray absorptiometry. Eur J Clin Nutr. 1996;50:295–301. [PubMed] [Google Scholar]
- 44.Garcia AL, Wagner K, Hothorn T, Koebnick C, Zunft HJ, Trippo U. Improved prediction of body fat by measuring skinfold thickness, circumferences, and bone breadths. Obes Res. 2005;13:626–634. doi: 10.1038/oby.2005.67. [DOI] [PubMed] [Google Scholar]
- 45.Wattanapenpaiboon N, Lukito W, Strauss BJ, Hsu-Hage BH, Wahlqvist ML, Stroud DB. Agreement of skinfold measurement and bioelectrical impedance analysis (BIA) methods with dual energy X-ray absorptiometry (DEXA) in estimating total body fat in Anglo-Celtic Australians. Int J Obes Relat Metab Disord. 1998;22:854–860. doi: 10.1038/sj.ijo.0800672. [DOI] [PubMed] [Google Scholar]
- 46.Kitano T, Kitano N, Inomoto T, Futatsuka M. Evaluation of body composition using dual-energy X-ray absorptiometry, skinfold thickness and bioelectrical impedance analysis in Japanese female college students. J Nutr Sci Vitaminol (Tokyo) 2001;47:122–125. doi: 10.3177/jnsv.47.122. [DOI] [PubMed] [Google Scholar]
- 47.Chertow GM, Lowrie EG, Wilmore DW, et al. Nutritional assessment with bioelectrical impedance analysis in maintenance hemodialysis patients. J Am Soc Nephrol. 1995;6:75–81. doi: 10.1681/ASN.V6175. [DOI] [PubMed] [Google Scholar]
- 48.Cooper BA, Aslani A, Ryan M, et al. Comparing different methods of assessing body composition in end-stage renal failure. Kidney Int. 2000;58:408–416. doi: 10.1046/j.1523-1755.2000.00180.x. [DOI] [PubMed] [Google Scholar]
- 49.Woodrow G, Oldroyd B, Turney JH, Davies PS, Day JM, Smith MA. Measurement of total body water by bioelectrical impedance in chronic renal failure. Eur J Clin Nutr. 1996;50:676–681. [PubMed] [Google Scholar]
- 50.Stall SH, Ginsberg NS, DeVita MV, et al. Comparison of five body-composition methods in peritoneal dialysis patients. Am J Clin Nutr. 1996;64:125–130. doi: 10.1093/ajcn/64.2.125. [DOI] [PubMed] [Google Scholar]
- 51.Segal KR, Gutin B, Presta E, Wang J, Van Itallie TB. Estimation of human body composition by electrical impedance methods: a comparative study. J Appl Physiol. 1985;58:1565–1571. doi: 10.1152/jappl.1985.58.5.1565. [DOI] [PubMed] [Google Scholar]
- 52.Oe B, CW DEF, Geers AB, Vos PF, Donker AJ, De Vries PM. The impact of equations on calculation of lean body mass by bioelectrical impedance analysis in RDT patients. Int J Artif Organs. 2000;23:168–172. [PubMed] [Google Scholar]
- 53.Elia M, Parkinson SA, Diaz E. Evaluation of near infra-red interactance as a method for predicting body composition. Eur J Clin Nutr. 1990;44:113–121. [PubMed] [Google Scholar]
- 54.Young H, Porcari J, Terry L, Brice G. Validity of body composition assessment methods for older men with cardiac disease. J Cardiopulm Rehabil. 1998;18:221–227. doi: 10.1097/00008483-199805000-00006. [DOI] [PubMed] [Google Scholar]
- 55.Moon JR, Tobkin SE, Smith AE, et al. Percent body fat estimations in college men using field and laboratory methods: A three-compartment model approach. Dyn Med. 2008;7:7. doi: 10.1186/1476-5918-7-7. [DOI] [PMC free article] [PubMed] [Google Scholar]
- 56.Kamimura MA, Jose Dos Santos NS, Avesani CM, Fernandes Canziani ME, Draibe SA, Cuppari L. Comparison of three methods for the determination of body fat in patients on long-term hemodialysis therapy. J Am Diet Assoc. 2003;103:195–199. doi: 10.1053/jada.2003.50024. [DOI] [PubMed] [Google Scholar]
- 57.Wilson WL, Heyward VH. Validation of the near-infrared interactance method for Native Indian, black, Hispanic and white men 19 to 57 years. Basic Life Sci. 1993;60:389–392. doi: 10.1007/978-1-4899-1268-8_91. [DOI] [PubMed] [Google Scholar]
- 58.Hortobagyi T, Israel RG, Houmard JA, McCammon MR, O'Brien KF. Comparison of body composition assessment by hydrodensitometry, skinfolds, and multiple site near-infrared spectrophotometry. Eur J Clin Nutr. 1992;46:205–211. [PubMed] [Google Scholar]
- 59.Chumlea WC, Dwyer J, Bergen C, et al. Nutritional status assessed from anthropometric measures in the HEMO study. J Ren Nutr. 2003;13:31–38. doi: 10.1053/jren.2003.50003. [DOI] [PubMed] [Google Scholar]
Associated Data
This section collects any data citations, data availability statements, or supplementary materials included in this article.