Abstract
Digital Transverse microradiography (TMR) offers several advantages over film based methods including real-time image acquisition, excellent linearity with exposure, and it does not require expensive specialized film. The purpose of this work was to demonstrate that a high-resolution digital microradiography system can be used to measure the volume percent mineral loss for sound and demineralized enamel and dentin thin sections from 150–350-μm in thickness. A custom fabricated digital microradiography system with ~ 2-μm spatial resolution consisting of a digital x-ray imaging camera, a computerized high-speed motion control system and a high-intensity copper Kα; x-ray source was used to determine the volume percent mineral content of sound and demineralized tooth sections. The volume percent mineral loss was compared with cross-sectional microhardness measurements on sound extracted human teeth. The correlation between microhardness and microradiography was excellent (Pr=0.99) for section thickness ranging from 59–319-μm (n=13). The attenuation was linear with varying exposure time from 1–10 seconds. Digital TMR is an effective and rapid method for the assessment of the mineral content of enamel and dentin thin sections.
Keywords: dental enamel, dental caries, microradiography
1. INTRODUCTION
Transverse microradiography (TMR) is the currently accepted gold standard for the measurement of mineral loss in natural and artificial caries lesions1–6. Therefore, TMR is considered the most appropriate method for validation of new caries imaging methods such as optical coherence tomography, terahertz imaging and fluorescence 7,8. Polarized light microscopy is also commonly used, however it only provides a measure of lesion depth and not mineral loss 9,10. Cross sectional microhardness measurements using a diamond micro-indenter is another method, but the area near the surface (15-μm) cannot be sampled and the method does not provide an image of mineral density/loss it can only be used to sample specific points on the sample11,12. MicroCT systems13 and X-ray tomography systems14–17 are also being investigated but such systems are still either extremely expensive or do not have sufficient resolution. In transverse “contact” microradiography, thin cross sections of enamel and dentin are placed in contact with an x-ray film and the sample/film is exposed to a low-energy x-ray source (Cu Kα). Since the response of film is nonlinear, an aluminum step-wedge is simultaneously exposed to measure the incident x-ray intensity and the volume percent mineral in the sample is calculated from the ratio of the aluminum to hydroxyapatite attenuation coefficients18. High-resolution x-ray film/plates are expensive and difficult to obtain, film response is nonlinear with exposure19 and the film requires digitization for processing. Elliot et al. has discussed the merits of using photon counting methods for x-ray attenuation measurements over film based methods18. New high-resolution x-ray imaging systems such as the system used in this work have an integrated high-resolution CCD camera, a GdOS:Tb scintillator and a fiber-optic taper between the scintillator for increased magnification.
Ideally, enamel and dentin thin sections of 80–100-μm thickness are routinely used for film-based microradiography, however, enamel is very brittle and difficult to cut into such thin sections without fracture, more so for carious sections, and attempts to produce such thin sections often result in an unacceptably high attrition rate of samples/sections. Therefore, sections are typically cut at a greater thickness and ground down to the desired thickness using various polishing techniques. It is not clear that lesions are damaged and contaminated during the procedure and this method is difficult and time consuming. We can reliably cut serial thin sections of 150 – 225–μm for enamel using a diamond saw. Dentin sections are easier to cut since they are more resistant to fracture.
The purpose of this paper is to describe a new digital TMR system that was specifically developed in our laboratory for quantifying the severity of natural and artificial caries lesions. The performance of the system was evaluated by measuring the linearity of the attenuation through sound enamel slices—verified by microhardness measurements—of thickness ranging from 59–319-μm.
2. MATERIALS AND METHODS
2.1 Sample Preparation
Sound 3rd molars extracted from patients in the San Francisco Bay area were collected, cleaned and sterilized with gamma radiation. Thirteen teeth were visually inspected and sectioned longitudinally through the center. Half of each crown was used for microradiography and the other half was embedded and submitted to microhardness profiling. For microradiography, one slice was cut from each of the remaining half crowns using a linear precision saw, the IsoMet 5000 (Buehler, Lake Bluff, IL), each with a different thickness ranging from 59 – 319-μm and was used for the calibration curve. The tooth sections were serial polished with 12-μm, 6-μm, and 1-μm diamond abrasives and stored in 0.1% thymol to prevent bacterial growth. The thickness of each section was measured with a digital indicator, Model 112E (Mitutoyo, Japan) with a resolution of 1-μm.
2.2 Microhardness Measurements
One half of each crown was embedded in epoxy resin with the cut face exposed. The surface was serial polished to a 1-μm finish. The hardness of each tooth was calculated from two sets of twelve Knoop diamond indents that were made at 25-μm intervals across the surface starting at 150-μm from the anatomical surface to 425-μm11. Measurements were made using a Miniload II (Leitz-Wetzlar, Germany) microhardness tester and the indents were measured using an Olympus BX-60 microscope. Knoop hardness profiles were converted to mean (±s.d.) volume percent mineral for the 24-pts on each sample as has been described previously 11.
2.3 Transverse Digital Microradiography
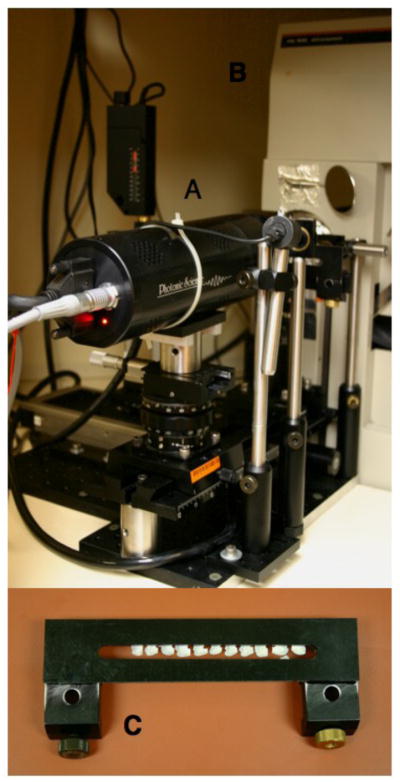
A custom-built digital microradiography (TMR) system, shown in Fig. 1, was used to measure the mineral loss in artificial and natural caries lesions. High-resolution microradiographs were taken using nickel filtered Cu Kα radiation with a wavelength of 1.54 Å from a collimated beam of a Philips 3100 X-ray generator and a Photonics Science FDI X-ray digital imager (Microphotonics, Allentown, PA). The X-ray digital imager consists of a 1392×1040 pixel interline CCD directly bonded to a coherent micro fiber-optic coupler that transfers the light from an optimized gadolinium oxysulphide scintillator to the CCD sensor. The images can be acquired in real-time at a frame rate of 10 fps with 12-bit resolution. The image size is 2.99 × 2.24 mm with a pixel spacing of 2.15-μm. A high-speed motion control system with UTM150 and 850G stages and an ESP300 controller (Newport, Irvine, CA) coupled to a video microscopy and laser targeting system was used for precise positioning of the tooth samples in the field of view of the imaging system. The camera was positioned 15-cm from the aperture/port of the x-ray generator and the samples were placed 5-mm from the surface of the camera scintillator. There is a 2-mm gap between the outer case of the camera and the scintillator surface and each sample was placed on a delrin mount in contact with the outer case of the camera, that is 3-mm thick. The actual spatial dimensions on the samples was determined by drilling four holes in a square pattern on enamel using a CO2 laser that were spaced exactly 1-mm apart. The corresponding dimensions were 18% greater than the pixel specifications for the camera. The holes were measured again after positioning the samples a further 25.4 mm away from the camera. This produced only a 10% increase in dimension, which indicates that slight errors in position (< 1-mm) from the scintillator and differences in sample thickness are unlikely to cause significant errors. In the processed x-ray images, the pixels were scaled to 1 pixel = 1.76 μm to correct for the 18% magnification of the sample.
Fig. 1.
High-resolution digital x-ray microradiography system (TMR), (a) FDI x-ray imager with motion control system, (b) x-ray diffractometer, and (c) sample mount.
3. RESULTS & DISCUSSION
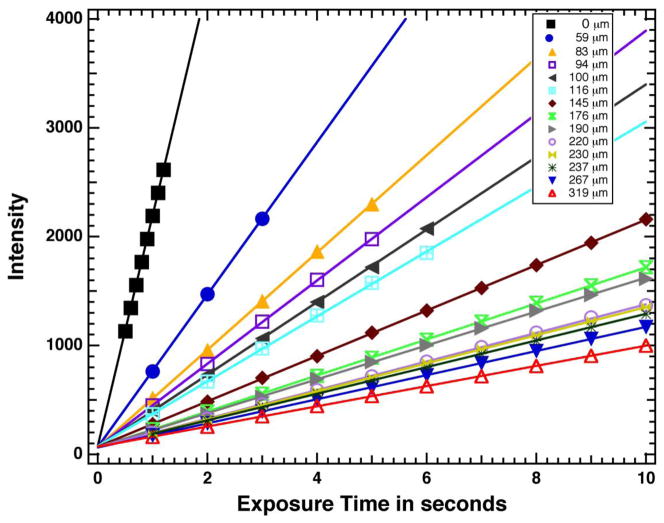
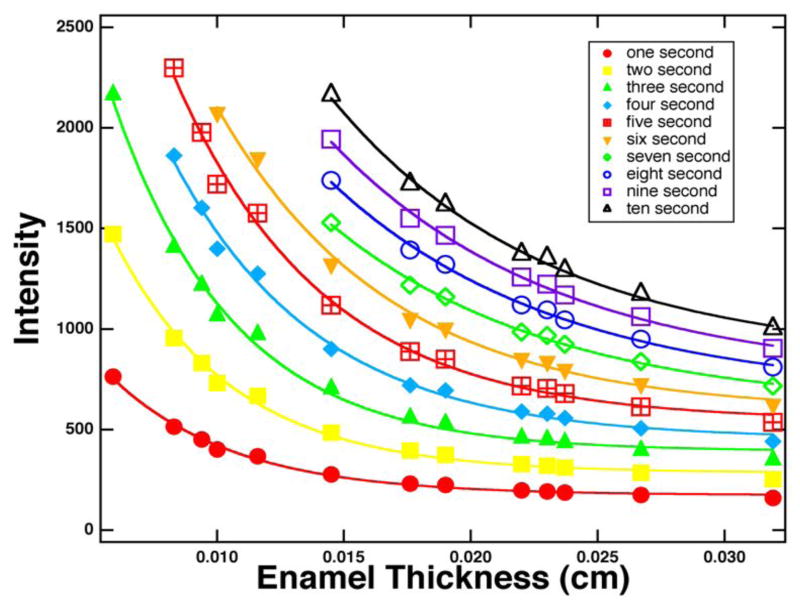
Figure 2 shows a plot of intensity versus exposure time in seconds. The x-ray generator was set at 25 kV and 30 mA and the imaging camera has a 12-bit dynamic intensity range (0–4095). Linear plots of the background (no sample) and thirteen sound enamel samples are shown in Fig. 2. For each point measured without any sample (black), 0.5–1.2 seconds represents the mean intensity from an area of 1.4 million pixels. Intensities were linear with exposure with a Pearson correlation coefficient of Pr = 0.999. The mean intensity through the thirteen enamel sections was measured for areas ranging from 200,000–300,000 pixels for each exposure time are also plotted in Fig. 2. Each enamel section produced a linear plot (Pr = 0.999) with the thinnest section producing the steepest slope as expected. All of the plots converge to a relative intensity of 67.7±3.7. This number represents the dark current, and the intensity was measured to be 66.1±2.6 when the x-ray machine is turned off. Exponential plots of intensity versus enamel thickness with various exposure times ranging from one to ten seconds for each enamel section are shown in Fig. 3. Ten reference curves for each exposure time from 1–10 seconds were constructed from Fig. 3 by dividing the transmitted intensity, I (enamel section) by the incident intensity, I0 and taking the natural logarithm according to the Beer’s Law, eq. 1.
Fig. 2.
Linear change in x-ray intensity through thirteen different enamel sections and no sample (black) versus exposure time in seconds.
Fig. 3.
X-ray intensity of enamel versus thickness 59 – 319-μm for thirteen tooth sections.
| (1) |
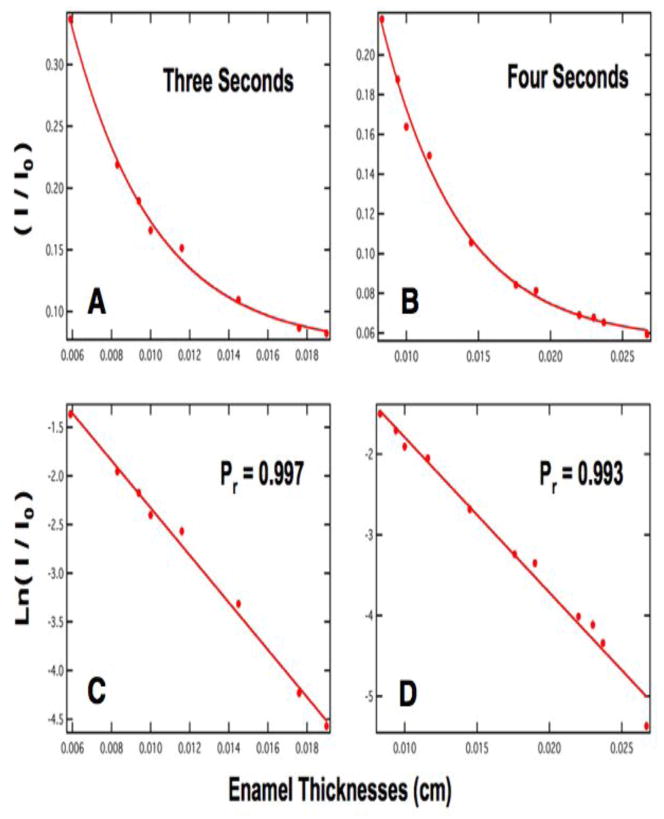
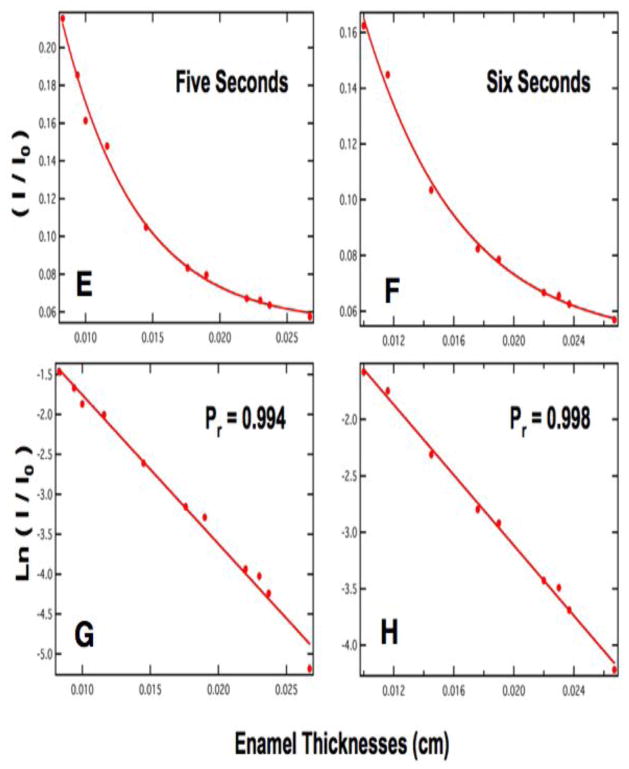
Where t represents the enamel thickness in centimeters and μ is the linear attenuation coefficient. Figures 4 & 5 show four curves of (I/Io) vs. thickness for three to six second exposure times in A–B and E–F with the anticipated exponential decrease in intensity with thickness. Plots C–D, and G–H of ln (I/Io) vs thickness are highly linear. These plots of intensity vs. enamel thickness and other plots for varying exposure time are used to determine the mineral content of the sound and demineralized enamel and dentin sections of interest. The four plots of Figs. 4&5 are best suited for determining the mineral content of sound and carious enamel for a section thickness range of 150 – 225 μm thickness. The volume percent mineral content of each tooth section is calculated by simply determining the equivalent thickness to sound enamel (teq) using the plot for the appropriate exposure time, e.g., Figs. 4 & 5, and then dividing by the actual sample thickness and multiplying by the value for sound enamel as shown by eq. 2.
Fig. 4.
(A) & (B) are plots of intensity/background versus thickness in centimeters for 3 and 4 second exposure times. (C) & (D) are the natural logarithm of intensity/background versus thickness in centimeters for 3 and 4 second exposure times. The slope of the line corresponds to the linear attenuation coefficient for (C) & (D).
Fig. 5.
(E) & (F) are plots of intensity/background versus thickness in centimeters for 5 and 6 second exposure times. (G) & (H) are the natural logarithm of intensity/background versus thickness in centimeters for 5 and 6 second exposure times. The slope of the line corresponds to the linear attenuation coefficient for (G) & (H).
| (2) |
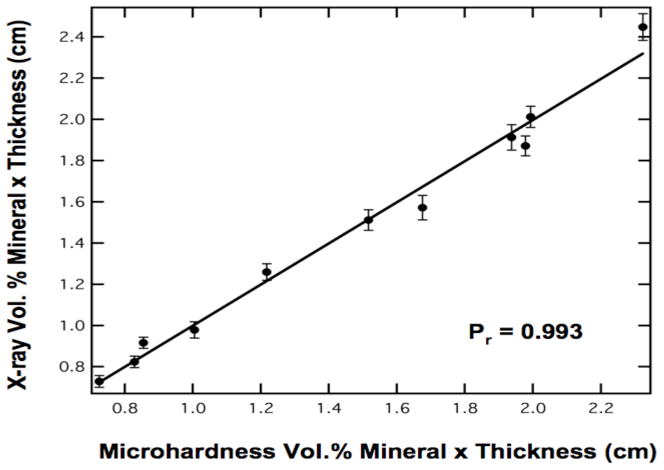
The sound enamel vol.% mineral value was determined from the mean microhardness value of all of the samples (86.3±1.87). This agrees very well with the value of 86.2% used by Angmar4,18. The high linearity of microradiography over the range of sample thickness investigated and the high correlation of the product of vol. % mineral and sample thickness determined using microhardness and microradiography (Fig. 6) serve to validate our approach. Even though microhardness is not a gold standard for microradiography—in fact microradiography was previously used to validate microhardness11—it provides an independent method of verification that all the enamel samples used were sound. If there was a problem with this approach including: nonlinearity in the detector/scintillator response over the intensity range employed, the influence of the organic content was significant, or there was substantial x-ray dispersion at these x-ray wavelengths, than the plot of Fig. 6 would not be linear over this range of sample thickness.
Fig. 6.
The volume percent mineral times thickness measured using microradiography versus the mean ± (s.d) of the volume percent mineral measured using transverse microhardness from 24-pts on each sample, times thickness for a five second exposure time. The correlation is high, Pr = 0.993.
An aluminum step-wedge was not used and there is no need to insert the linear attenuation coefficient for aluminum or the hydroxyapatite mineral. The same enamel calibration curve is used for both enamel and dentin because the organic material and water contribute little to attenuation. The absorption coefficient of the mineral content is approximately 25 times greater than that of the organic material and water using Cu kα radiation18, therefore it is not surprising that the organic content is not problematic for the sample thickness range that we use for enamel or dentin.
The natural curvature of the edge of the tooth is a concern for thicker samples when measuring mineral profiles near the surface of the lesion. This can be compensated for by subtracting the lesion profile from an adjacent sound area of the same section with the same surface curvature.
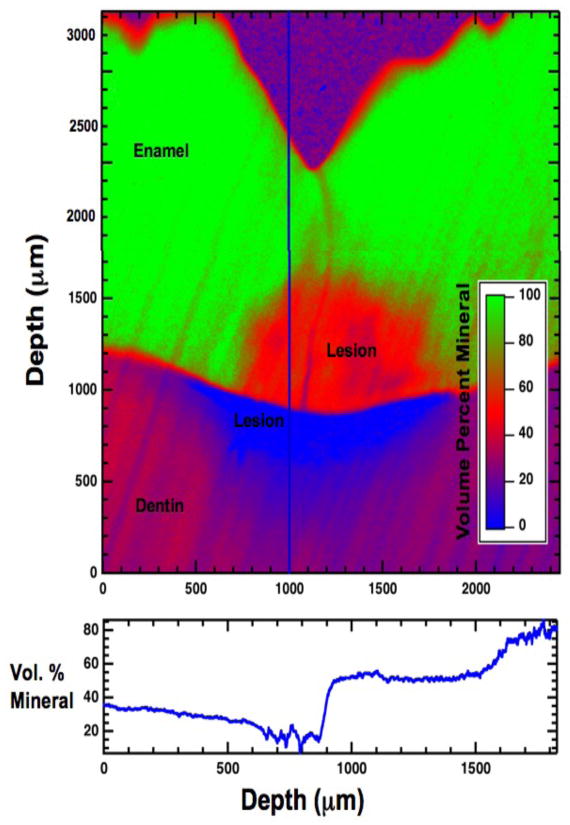
A sample x-ray image of a 225-μm thick tooth section containing a lesion in both enamel and dentin is shown in Fig. 7. The image has been converted to volume % mineral, which is shown in false color (bluered-green).
Fig. 7.
(top) A high-resolution digital microradiograph of the lesion area shows the volume percent mineral versus depth in μm in the lesion. (bottom) Line profile of the volume percent mineral versus depth in μm along the vertical line drawn through the lesion.
In summary, we have demonstrated that this digital microradiography system can be used to measure the mineral loss in enamel and dentin thin sections in real-time, including samples that are greater than 200-μm in thickness which can be reliably cut with a diamond saw without fracture.
Acknowledgments
Supported By NIH/NIDCR Grants R01-DE14698, R01-DE17869 and R01-DE09958.
References
- 1.de Josselin de Jong E, ten Bosch JJ, Noordmans J. Optimized microcomputer-guided quantitative microradiography on dental mineralized tissue slices. Phys Med Biol. 1987;32:887–899. doi: 10.1088/0031-9155/32/7/008. [DOI] [PubMed] [Google Scholar]
- 2.de Josselin de Jong E, van der Linden AHIM, Borsboom PCF, ten Bosch JJ. Determination of mineral changes in human dental enamel by longitudinal microradiography and scanning optical mintoring and their correlation with chemical analysis. Caries Res. 1988;22:153–159. doi: 10.1159/000261098. [DOI] [PubMed] [Google Scholar]
- 3.de Josselin de Jong E, van der Linden AHIM, ten Bosch JJ. Longitudinal microradiography: a non-destructive automated quantitative method to follow mineral changes in mineralized tissue slices. Phys Med Biol. 1987;32:1209–1220. doi: 10.1088/0031-9155/32/10/001. [DOI] [PubMed] [Google Scholar]
- 4.Angmar-Mansson B. A quantitative microradiographic study on the organic matrix of developing human enamel in relation to the mineral content. Arch Oral Biol. 1971;16:135–45. doi: 10.1016/0003-9969(71)90101-4. [DOI] [PubMed] [Google Scholar]
- 5.Bergstrom DH, Fox JL, Higuchi WI. Quantitative microradiography for studying dental enamel demineralization and remineralization. J Pharm Sci. 1984;73:650–3. doi: 10.1002/jps.2600730515. [DOI] [PubMed] [Google Scholar]
- 6.Hall AF, Sadler JP, Strang R, de Josselin de Jong E, Foye RH, Creanor SL. Application of transverse microradiography for measurement of mineral loss by acid erosion. Adv Dent Res. 1997;11:420–5. doi: 10.1177/08959374970110040701. [DOI] [PubMed] [Google Scholar]
- 7.Angmar-Mansson B, ten Bosch JJ. Optical methods for the detection and quantification of caries. Adv Dent Res. 1987;1:14–20. doi: 10.1177/08959374870010010601. [DOI] [PubMed] [Google Scholar]
- 8.de Josselin de Jong E, Sundstrom F, Westerling H, Tranaeus S, ten Bosch JJ, Angmar-Mansson B. A New Method for in vivo Quantification of Changes in Initial Enamel Caries with laser Fluorescence. Caries Res. 1995;29:2–7. doi: 10.1159/000262032. [DOI] [PubMed] [Google Scholar]
- 9.Waggoner WF, Crall JJ. A study of the carious lesion utilizing radiography, polarized light microscopy, and scanning electron microscopy. Quintessence Int Dent Dig. 1984;15:1163–74. [PubMed] [Google Scholar]
- 10.Wefel JS, Harless JD. Comparison of artificial white spots by microradiography and polarized light microscopy. J Dent Res. 1984;63:1271–5. doi: 10.1177/00220345840630110301. [DOI] [PubMed] [Google Scholar]
- 11.Featherstone JDB, ten Cate JM, Shariati M, Arends J. Comparison of artificial caries-like lesions by quantitative microradiography and microhardness profiles. Caries Res. 1983;17:385–391. doi: 10.1159/000260692. [DOI] [PubMed] [Google Scholar]
- 12.White DJ, Featherstone JDB. A longitudinal microhardness analysis of fluoride dentifrice effects on lesion progression in vitro. Caries Res. 1987;21:502–512. doi: 10.1159/000261059. [DOI] [PubMed] [Google Scholar]
- 13.Clementino-Luedemann TN, Kunzelmann KH. Mineral concentration of natural human teeth by a commercial micro-CT. Dent Mater J. 2006;25:113–9. doi: 10.4012/dmj.25.113. [DOI] [PubMed] [Google Scholar]
- 14.Dowker SE, Davis GR, Elliott JC, Wong FS. X-ray microtomography: 3-dimensional imaging of teeth for computer-assisted learning. Eur J Dent Educ. 1997;1:61–5. doi: 10.1111/j.1600-0579.1997.tb00013.x. [DOI] [PubMed] [Google Scholar]
- 15.Dowker SE, Elliott JC, Davis GR, Wassif HS. Longitudinal study of the three-dimensional development of subsurface enamel lesions during in vitro demineralisation. Caries Res. 2003;37:237–45. doi: 10.1159/000070865. [DOI] [PubMed] [Google Scholar]
- 16.Dowker SE, Elliott JC, Davis GR, Wilson RM, Cloetens P. Synchrotron x-ray microtomographic investigation of mineral concentrations at micrometre scale in sound and carious enamel. Caries Res. 2004;38:514–22. doi: 10.1159/000080580. [DOI] [PubMed] [Google Scholar]
- 17.Kinney JH, Balooch M, Haupt DL, Marshall SJ, Marshall GW. Mineral distribution and dimensional changes in human dentin during demineralization. J Dent Res. 1995;74:1179–1184. doi: 10.1177/00220345950740050601. [DOI] [PubMed] [Google Scholar]
- 18.Elliott JC, Wong FS, Anderson P, Davis GR, Dowker SE. Determination of mineral concentration in dental enamel from X-ray attenuation measurements. Connect Tissue Res. 1998;38:61–72. doi: 10.3109/03008209809017022. discussion 73–9. [DOI] [PubMed] [Google Scholar]
- 19.Dowsett DJ, Kenny PA, Johnston RE. The Physics of Diagnostic Imaging. Chapman & Hall Medical; NY: 1998. [Google Scholar]


