Abstract
Transcription factor Lbx1 is known to play a role in the migration of muscle progenitor cells in limb buds and also in neuronal determination processes. In addition, involvement of Lbx1 in cardiac neural crest-related cardiogenesis was postulated. Here, we used mouse embryonic stem (ES) cells which have the capacity to develop into cells of all three primary germ layers. During in vitro differentiation, ES cells recapitulate cellular developmental processes and gene expression patterns of early embryogenesis. Transcript analysis revealed a significant upregulation of Lbx1 at the progenitor cell stage. Immunofluorescence staining confirmed the expression of Lbx1 in skeletal muscle cell progenitors and GABAergic neurons. To verify the presence of Lbx1 in cardiac cells, triple immunocytochemistry of ES cell-derived cardiomyocytes and a quantification assay were performed at different developmental stages. Colabeling of Lbx1 and cardiac specific markers troponin T, α-actinin, GATA4, and Nkx2.5 suggested a potential role in early myocardial development.
1. Introduction
Lbx1 is a member of the Ladybird-like homeobox gene family that encodes a homeodomain transcription factor. This mouse counterpart of Drosophila m. ladybird gene was first discovered by Jagla et al. [1]. In vertebrates, expression of Lbx1 has been described in the CNS and in migrating muscle precursor cells. During early mouse embryonic development, the presence or absence of Lbx1 distinguishes two major neuronal classes generated in the dorsal spinal cord [2]. Specifically, Lbx1 is essential for determining a somatosensory instead of a viscerosensory fate in relay neurons in the hindbrain [3]. At later stages of mouse neurogenesis, expression of Lbx1 defines a basal GABAergic differentiation state for dorsal horn neurons [4].
Furthermore, it was found that Lbx1 plays an important role in the migration of hypaxial muscle precursor cells during development. It was suggested by Brohmann et al. [5] that Lbx1 controls the expression of genes that are essential for the recognition or interpretation of cues that guide migrating muscle precursors and maintain their migratory potential. Watanabe et al. [6] detected Lbx1 in activated but not quiescent satellite cells of adult mice. They suggested that Lbx1 plays important roles in the differentiation and maintenance of satellite cells of mature myofibers.
In addition to its relevance in neuronal [7] and muscle cell [8] development in Drosophila ladybird genes have also been reported to be expressed in a specific subset of cardioblasts, required for the diversification of heart precursor cells [9]. Until today, there are only few data about the involvement of Lbx1 in mouse cardiogenesis. Inactivation of Lbx1 in mice mainly resulted in defects in heart looping and increased cell proliferation leading to myocardial hyperplasia [10]. Obviously there are striking morphological and functional differences between the tubular Drosophila heart and the four-chambered mammalian heart. However, the specification of cardiac primordia in both Drosophila and vertebrate embryos is under the control of conserved core cardiac transcription factors encoding, for example, Nkx2.5/Tinman, GATA/Pannier, Mef2, and Hand family members [11].
Murine embryonic stem (ES) cells are characterized by the capacity to differentiate into virtually any cell type of an organism, including neurons, skeletal, and cardiac muscle cells [12]. In vitro differentiation of mouse ES cells into cardiomyocytes recapitulates the programmed expression of cardiac genes observed in the mouse embryo in a time-controlled manner [13]. During ES cell differentiation, cardiac-specific genes are up- or downregulated dependent on extracellular signals and cell-cell interactions, thus providing an excellent model system to study early embryonic development at the cellular level.
Therefore, the aim of this study was the identification of Lbx1 expression at the transcript and protein level in ES cell-derived neurons and muscle cell progenitors to ensure the presence of Lbx1 in our in vitro model system. Specifically, we investigated whether Lbx1 is also expressed in ES cell-derived cardiac myocytes. The presence of Lbx1 was clearly demonstrated in a small subpopulation of ES cell-derived cardiomyocytes by immunocytochemistry.
2. Materials and Methods
2.1. Cell Culture and Differentiation
ES cells of line R1 [14] were cultured on a mitotically inactivated embryonic fibroblast feeder layer in Dulbecco's modified Eagle's medium (DMEM; Invitrogen, Karlsruhe, Germany) and supplements as described [15]. The two-step differentiation protocol included (i) the formation of embryoid bodies (EBs) and (ii) after EB plating on adhesive substrate (0.1% gelatin) the expansion of multilineage progenitor cells and spontaneous differentiation to form differentiated phenotypes. In short, ES cells (n = 600 cells/20 μL drop) were plated on the lids of Petri dishes (∅ 10 cm), cultured as “hanging drops” for 2 days and on bacteriological plates (∅ 6 cm) in suspension for additional 3 days to form EBs (five days in total = 5 d). The differentiation medium consisted of Iscove's modified Dulbecco's medium (IMDM) supplemented with 20% FCS (selected batches), L-glutamine/penicillin/streptomycin (1 : 100 of stock solution), nonessential amino acids (1 : 100 of stock solution, all from Invitrogen), and α-monothioglycerol (final concentration 450 μM; Sigma-Aldrich, Taufkirchen, Germany). At day 5, EBs were plated in IMDM with the supplements mentioned above and cultivated for further two ( = 5 + 2 d) up to 35 days ( = 5 + 35 d) onto gelatin-coated 6 cm culture dishes for RT-PCR analysis and cardiomyocyte isolation (30 EBs). 30 EBs were plated onto gelatin-coated 6 cm culture dishes containing cover slips for immunocytochemistry, and 100 EBs onto 10 cm culture plates for protein isolation. Cultures were maintained in a 37°C/5% CO2 incubator. Although this differentiation approach is preferentially used to obtain cardiomyocytes and skeletal muscle cell progenitor cells, a small population of neuronal cells can be generated, too.
2.2. RNA Extraction and RT-PCR
Control mouse heart and brain tissues at day E12.5, ES cells, EBs, or differentiated cells collected at days 5 + 2, 5 + 4, 5 + 7, 5 + 9, 5 + 11, 5 + 14, 5 + 18, 5 + 25, 5 + 30, and 5 + 35 were suspended in lysis buffer (peqGOLD RNAPure, peqlab, Erlangen, Germany). Total RNA was isolated by the single-step extraction method according to Chomczynski and Sacchi [16]. RNA was reverse transcribed using Oligo d(T)16 primers (Applied Biosystems, Darmstadt, Germany) and amplified using oligonucleotide primers specific for the following genes (oligonucleotide sequences are given in brackets in the order forward-, reverse-primer followed by the annealing temperature used for PCR, the length of the amplified fragments in base pairs, and the number of cycles): Lbx1 (CAGACCTCGCCTCTCTGC, CTCCTCTAGGTCCCGCTTG; 60°C; 318 bp; 32), Gapdh (CAGCCTCGTCCCGTAGAC, CGCTCCTGGAAGATGGTG; 60°C; 253 bp; 32). Reverse transcription was performed with MuLV reverse transcriptase (Invitrogen) for 10 min at 25°C and 90 min at 42°C, followed by denaturation for 10 min at 70°C and cooling to 8°C according to the protocol supplied by the manufacturer. For semiquantitative determination of mRNA levels, PCR analyses were carried out with Taq DNA polymerase (peqGOLD Taq-Polymerase, peqlab, Erlangen, Germany). For determination of relative mRNA levels, two separate PCR reactions, either using primers of the analyzed gene or primers specific for Gapdh, were performed.
The PCR reactions were performed on a 25 μL reaction volumes. One-third of each PCR reaction was electrophoretically separated on 2% agarose gels containing GelRed nucleic Acid Gel Stain (Biotium, Hayward, USA). Gels were illuminated with UV light, and the GelRed fluorescence signals were analyzed by the TINA2.08e software (Raytest Isotopenmeßgeräte, Straubenhardt, Germany). Data of the target genes were plotted as percentage changes in relation to the expression of the housekeeping gene Gapdh. Gels of ten independent experiments were analyzed. For statistical evaluation, data were compared using analysis of variance (ANOVA).
2.3. Western Blotting
EBs, cells at differentiation stages 5 + 2, 5 + 4, 5 + 7, 5 + 11, 5 + 14, and 5 + 18, embryonic mouse hearts and brains at days E12.5 and E15.5, and adult heart and brain tissue were washed three times with PBS and homogenized in 300–500 μL cold disruption buffer (PARIS Kit, Applied Biosystems, Darmstadt, Germany). The samples were stored at −80°C until use. The total protein content was determined spectrophotometrical using the BCA Protein Acid Kit (Sigma-Aldrich) and NanoDrop (peqlab). Sixty μg protein were solubilized in Laemmli buffer and heated at 95°C for 5 min and electrophoresed on 15% SDS-PAGE. Proteins were electrotransferred to PVDF membrane and blocked in Tris-buffered saline containing 0.2% Tween and 10% nonfatty milk powder for 1 h. Blots were incubated in 10% nonfatty milk powder/TBS-Tween with rabbit anti mouse Lbx1 antibody (1 : 1000, gift from Dr. T. Müller, Berlin, Germany) or rabbit anti mouse Gapdh antibody (1 : 2000, Abcam, Cambridge, UK) at room temperature (RT) for 1 h. Afterwards, the blots were washed three times for 10 min in TBS-Tween and then incubated with goat anti rabbit IgG (1 : 80000) conjugated to horseradish peroxidase (Sigma-Aldrich) in 10% nonfatty milk powder/TBS-Tween at RT for 1 h. After washing, immunoreactive signals were visualized by enhanced chemiluminescence detection (ECL plus, Amersham Biotech, Freiburg, Germany). Apparent molecular weights were determined by comparison with standard molecular weight markers (PageRuler Plus Prestained Protein Ladder, Fermentas, St. Leon-Rot, Germany).
2.4. Immunofluorescence Analysis
Indirect immunofluorescence (IF) analysis of EB outgrowths was carried out at days 5 + 11 for neuronal phenotypes and 5 + 14 for skeletal muscle cell progenitors. To quantify the amount of Lbx1-positive cardiac cells in EB outgrowths at various differentiation stages, beating cardiac clusters were isolated as described [15] at days 5 + 4, 5 + 7, 5 + 9, 5 + 11, and 5+15. Clusters were replated onto gelatin-coated cover slips (∅10 mm) in wells of 4-well plates and allowed to attach overnight. Cells were rinsed with PBS and fixed with PBS containing 4% paraformaldehyde at RT for 20 min. After washing, cells were permeabilized with 0.1% Triton in PBS at RT for 10 min. Preparations were incubated with 1% bovine serum albumine in PBS for 1 h followed by incubation with the primary antibodies at RT in a humidified chamber for 1 h. The following antibodies were applied: rabbit anti mouse Lbx1 (1 : 1000, gift from Dr. T. Müller), mouse anti mouse sarcomeric alpha actinin (1 : 200), mouse anti mouse cardiac Troponin T (1 : 200; all from Abcam), mouse anti mouse β III tubulin isoform (1 : 150), guinea pig anti mouse gamma-aminobutyric acid (GABA, 1 : 500; all from Chemicon-Millipore, Schwalbach, Germany), goat anti mouse GATA4 (1 : 100), and goat anti mouse Nkx2.5 (1 : 100; all from Santa Cruz Biotechnology, Heidelberg, Germany), respectively. After washing (3x) with PBS, cells were incubated at RT for 1 h with fluorescence-labelled secondary antibodies which were either anti rabbit, anti guinea pig, anti goat Cy3 (1 : 700), anti mouse Cy5 (1 : 700; all from Dianova, Hamburg, Germany) or anti mouse, anti rabbit Alexa 488, (1 : 100) or anti mouse Alexa 350 (1 : 100; all from Molecular Probes-Invitrogen). After counterstaining with DAPI, cover slips were rinsed (3x) with PBS and with A. tridest (1x). After being embedded in Vectashield mounting medium (Vector Lab.—Biozol, Wertheim-Bettingen, Germany), specimen were analyzed with the fluorescence microscope (Axiovert; Zeiss, Germany).
The quantitative estimation based on the evaluation of approximately 1000 cardiac cells (n = 10 experiments) positively stained for troponin T at the given differentiation stages. Lbx1-immunopositive cells displaying a strong fluorescence signal coexpressing troponin T (Lbx1+, troponin T+) and cells positive for troponin only T (Lbx1−, troponin T+) were counted. Lbx1 expressing cells not costained by troponin T antibody in close proximity to cardiac clusters were not counted. Most likely, these cells did not rearrange the sarcomeric apparatus properly after dissociation and replating.
3. Results
3.1. RT-PCR Analysis of Lbx1 Expression
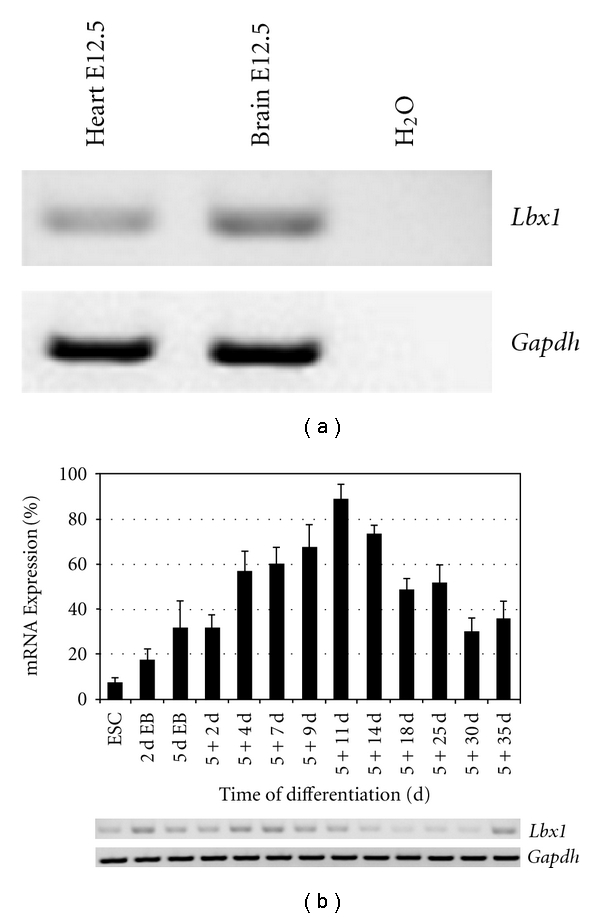
Embryonic mouse heart and brain tissues as well as ES cells and differentiated progeny of 2 to 5 + 35 days of cultivation were analyzed by RT-PCR. Heart and brain tissue from E12.5 revealed transcript levels with slightly higher levels in brain tissue (Figure 1(a)). Transcript levels of Lbx1 were low in undifferentiated ES cells (8.2%) but showed a significant transient upregulation at the progenitor cell stage from 5 + 4 d (55.9%) to 5 + 14 d (72.3%; Figure 1(b)). Maximum level of 86.7% was reached at day 5+11. At the terminal differentiation stage 5+30 d, Lbx1 was significantly downregulated to 30.3%.
Figure 1.

RT-PCR analysis of mRNA levels of Lbx1 gene in embryonic tissues and ES cell-derived progeny. (a) Representative gel of semiquantitative RT-PCR Lbx1 products in brain and heart tissue at E12.5. (b) Representative gel and Lbx1 transcript levels at given differentiation stages of ES cell differentiation. The data were plotted (in %) in relation to the transcript levels of the housekeeping gene Gapdh as means (n = 10 experiments). Error bars represent standard error of the mean. The P value is <0.0001.
3.2. Detection of Lbx1 by Western Blot Analysis
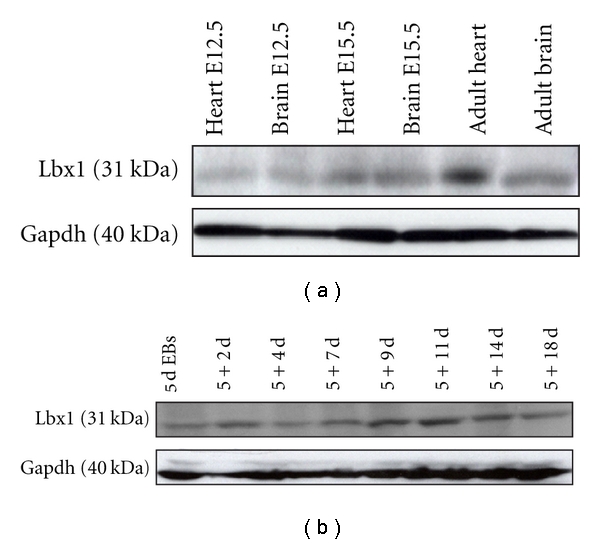
To confirm the presence of Lbx1 at the protein level, heart and brain tissues from different developmental stages were analyzed. Lbx1 was moderately detectable in comparative brain tissues (Figure 2(a)). Lbx1 could also be detected in E12.5, E15.5, and adult hearts. In differentiated ES cell derivatives, Lbx1 was expressed at all stages of differentiation at moderate levels (Figure 2(b)).
Figure 2.

Western blot analysis of Lbx1 in mouse tissues and ES cell-derived cultures. (a) Representative gels of analyzed embryonic heart and brain tissue at E12.5 and E15.5 as well as adult tissue compared to internal standard Gapdh. (b) Representative gels of Lbx1 and Gapdh at the indicated differentiation stages of ES cell differentiation.
3.3. Immunocytochemical Analysis of Lbx1 in Differentiated ES Cell Progeny
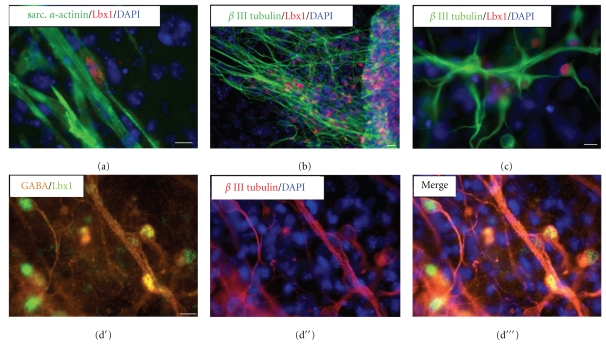
Immunocytochemical analysis was first performed with skeletal muscle progenitors and neuronal cells to confirm the involvement of Lbx1 in early developmental processes in ES cell-derived cultures in vitro. Costaining with sarcomeric α-actinin revealed a small number of Lbx1-positive skeletal muscle cell progenitors (Figure 3(a)). Lbx1 immunoreactivity was also detected in numerous β III tubulin-positive neuronal cells (Figure 3(b) and at higher magnification Figure 3(c)). To identify the neuronal subtype, costaining with anti-GABA antibody was performed. As shown in Figures 3(d′) and 3(d′′′), Lbx1 was expressed in the nuclei of GABA-positive neuronal cells. Immunocytochemical analysis of Lbx1 in undifferentiated ES cells revealed its absence (not shown).
Figure 3.
Immunofluorescence analysis of Lbx1 expression in ES cell-derived cells. (a) Sarcomeric α-actinin- (green)-labeled skeletal muscle cell progenitors partially costained for Lbx1 (red) at day 5 + 14 of spontaneous ES cell differentiation. (b) β III tubulin- (green)-positive neuronal cells partially coexpressed Lbx1 (red) at day 5 + 11. (c) Lbx1 staining (red) was clearly located to the nuclear region of β III tubulin- (green)-positive neurons. Triple immunofluorescence staining revealed the coexpression of (d′) Lbx1 (green) and GABA (orange) in (d′′) β III tubulin- (dark red)-positive neurons. (d′′′) Merged image. Nuclei were labeled with fluorescent marker DAPI (blue). Bar = 20 μm.
3.4. Lbx1 Is Colocated in ES Cell-Derived Cardiomyocytes
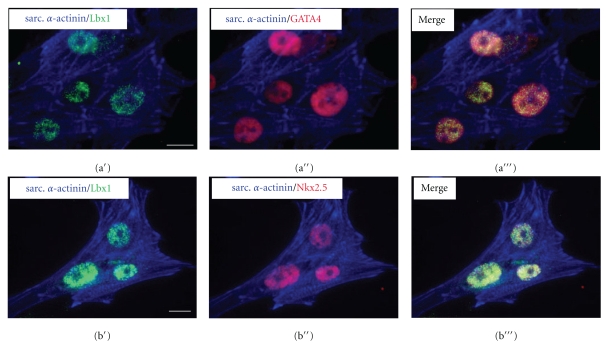
In order to discover whether Lbx1 could also be detected in ES cell-derived cardiomyocytes, triple immunofluorescence staining including sarcomeric α-actinin and early cardiac transcription factors was performed in isolated beating clusters. Lbx1 was found in a small subpopulation of cardiomyocytes in coexpression with GATA4 (Figure 4(a′′′)) and Nkx2.5 (Figure 4(b′′′)).
Figure 4.
Immunofluorescence analysis of Lbx1 expression in ES cell-derived cardiomyocytes. (a′,b′) Sarcomeric α-actinin- (blue)-stained cardiac myocytes coexpressed Lbx1 (green) and (a′′) GATA 4 (red) or (b′′) Nkx2.5 (red). (a′′′,b′′′) Merged images. Bar = 20 μm.
To further investigate the amount of Lbx1-expressing cardiomyocytes, a quantification assay was performed at different developmental stages. Immunocytochemistry revealed that about 10% of troponin T-positive cardiomyocytes stained positive for Lbx1 as early as day 5 + 4 (Figure 5(a)). This amount slightly changed at days 5 + 7 (7.8%) and 5 + 9 (8.2%) to 10.9% at 5 + 11 d and 9.6% at day 5+15, but changes were not significant. Figures 5(b)–5(d) showed representative images of immunofluorescence staining of isolated beating cardiomyocytes partially coexpressing Lbx1 at given time points.
Figure 5.

Quantification of Lbx1-expressing cardiomyocytes. (a) Percentage of Lbx1/troponin T double positive cardiomyocytes (filled bars) in relation to all troponin T-positive cardiomyocytes (open bars; approximately 1000 cells per time point) at the indicated differentiation stages. Data are shown as means (n = 10 experiments). Error bars represent standard error of the mean. (b)–(d) Representative double immunostainings of troponin T (green) and Lbx1 (red) at given time points. Nuclei were labeled with fluorescent marker DAPI (blue). White arrow in (c) indicates an Lbx1 expressing cell close to a cardiac cluster not costained by troponin T antibody. Bar =10 μm.
Because there was no Lbx1-specific purification or enrichment procedure included, approximately less than five percent of ES cell-derived cells expressed Lbx1. Expression was restricted to skeletal myocyte progenitors, cardio myocytes, and neuronal cells.
4. Discussion
Analysis of Lbx1 at the transcript and protein level in ES cell-derived progeny revealed the expression in neurons as well as skeletal muscle progenitors and in a small subpopulation of cardiomyocytes. To our knowledge, this is the first time that a coexpression of Lbx1 and several cardiac-specific markers could be demonstrated in ES cell-derived cardiomyocytes.
RT-PCR analysis showed an expression signal in embryonic heart tissue. While Schäfer et al. [10] detected Lbx1-LacZ-positive cells in embryonic mouse hearts but failed to detect Lbx1 mRNA, Chao et al. [17] found moderate expression levels of Lbx1 gene in porcine hearts. Lbx1 was significantly upregulated at the progenitor cell stage around day 5 + 11 of ES cell differentiation. Western blot analysis of embryonic hearts tissue samples and several ES cell differentiation stages confirmed the presence of Lbx1 protein in our model system. Because there are progenitors from several lineages including the mesodermal as well as ectodermal lineage present at this time of ES cell differentiation [18], double immunocytochemistry using cell type-specific antibodies was performed to assign Lbx1 signal to specific phenotypes. As expected, Lbx1 immunoreactivity could be detected in skeletal muscle cell precursors and GABAergic neurons, reflecting the tissue expression pattern in mice as described previously [4, 19].
Costaining of Lbx1 with cardiac transcription factors (GATA4, Nkx2.5) and the continuous expression in a subpopulation of troponin T-positive cardiomyocytes suggested a potential role in myocardial differentiation and function. During mouse cardiogenesis at E11.0, single Lbx1-LacZ-positive cells were detected in the myocardium of the left ventricle [10]. The authors stated that this small population of Lbx1-LacZ-positive cells might originate from the neural tube migrating to the caudal branchial arch and the truncus arteriosus between E9.0 and E9.5 or reflect a de novo Lbx1 expression in the myocardium. Our data provide first evidence for an expression of Lbx1 in murine cardiomyocytes independent from the cardiac neural crest system.
Long-term expression of the Lbx1 homolog Ladybird was also found in Drosophila [20]. The authors performed a muscle and heart-targeted genome-wide transcriptional profiling and a chromatin-immunoprecipitation- (ChIP-)on-chip search for direct Ladybird targets. They concluded that Ladybird contributes to specifying the identity of cardiac precursors, regulates genes required for the acquisition of cell-type specific properties (e.g. motility, shape, and size), and might be involved in the regulation of genes required for terminal differentiation and the functional properties of cardiac cells [20]. A similar approach in mice would help to discover the entire function of Lbx1 in vertebrate heart development.
Taken together, our findings clearly demonstrated the expression of Lbx1 in embryonic stem cell-derived cardiomyocytes, thus providing a model system for the identification of Lbx1 target genes and signaling pathways involved in early heart failure caused by Lbx1 inactivation.
Acknowledgment
The authors wish to thank Dr. T. Müller for providing them with the anti-Lbx1 antibody.
References
- 1.Jagla K, Dolle P, Mattei MG, et al. Mouse Lbx1 and human LBX1 define a novel mammalian homeobox gene family related to the Drosophila lady bird genes. Mechanisms of Development. 1995;53(3):345–356. doi: 10.1016/0925-4773(95)00450-5. [DOI] [PubMed] [Google Scholar]
- 2.Müller T, Brohmann H, Pierani A, et al. The homeodomain factor Lbx1 distinguishes two major programs of neuronal differentiation in the dorsal spinal cord. Neuron. 2002;34(4):551–562. doi: 10.1016/s0896-6273(02)00689-x. [DOI] [PubMed] [Google Scholar]
- 3.Sieber MA, Storm R, Martinez-de-la-Torre M, et al. Lbx1 acts as a selector gene in the fate determination of somatosensory and viscerosensory relay neurons in the hindbrain. Journal of Neuroscience. 2007;27(18):4902–4909. doi: 10.1523/JNEUROSCI.0717-07.2007. [DOI] [PMC free article] [PubMed] [Google Scholar]
- 4.Cheng L, Samad OA, Xu Y, et al. Lbx1 and Tlx3 are opposing switches in determining GABAergic versus glutamatergic transmitter phenotypes. Nature Neuroscience. 2005;8(11):1510–1515. doi: 10.1038/nn1569. [DOI] [PubMed] [Google Scholar]
- 5.Brohmann H, Jagla K, Birchmeier C. The role of Lbx1 in migration of muscle precursor cells. Development. 2000;127(2):437–445. doi: 10.1242/dev.127.2.437. [DOI] [PubMed] [Google Scholar]
- 6.Watanabe S, Kondo S, Hayasaka M, Hanaoka K. Functional analysis of homeodomain-containing transcription factor Lbx1 in satellite cells of mouse skeletal muscle. Journal of Cell Science. 2007;120(23):4178–4187. doi: 10.1242/jcs.011668. [DOI] [PubMed] [Google Scholar]
- 7.de Graeve F, Jagla T, Daponte J-P, et al. The ladybird homeobox genes are essential for the specification of a subpopulation of neural cells. Developmental Biology. 2004;270(1):122–134. doi: 10.1016/j.ydbio.2004.02.014. [DOI] [PubMed] [Google Scholar]
- 8.Maqbool T, Soler C, Jagla T, et al. Shaping leg muscles in Drosophila: role of landybird, a conserved regulator of appendicular myogenesis. PLoS ONE. 2006;1(1, article e122) doi: 10.1371/journal.pone.0000122. [DOI] [PMC free article] [PubMed] [Google Scholar]
- 9.Jagla K, Frasch M, Jagla T, Dretzen G, Bellard F, Bellardi M. ladybird, a new component of the cardiogenic pathway in Drosophila required for diversification of heart precursors. Development. 1997;124(18):3471–3479. doi: 10.1242/dev.124.18.3471. [DOI] [PubMed] [Google Scholar]
- 10.Schäfer K, Neuhaus P, Kruse J, Braun T. The homeobox gene Lbx1 specifies a subpopulation of cardiac neural crest necessary for normal heart development. Circulation Research. 2003;92(1):73–80. doi: 10.1161/01.res.0000050587.76563.a5. [DOI] [PubMed] [Google Scholar]
- 11.Olson EN. Gene regulatory networks in the evolution and development of the heart. Science. 2006;313(5795):1922–1927. doi: 10.1126/science.1132292. [DOI] [PMC free article] [PubMed] [Google Scholar]
- 12.Wobus AM, Boheler KR. Embryonic stem cells: prospects for developmental biology and cell therapy. Physiological Reviews. 2005;85(2):635–678. doi: 10.1152/physrev.00054.2003. [DOI] [PubMed] [Google Scholar]
- 13.Boheler KR, Czyz J, Tweedie D, Yang H-T, Anisimov SV, Wobus AM. Differentiation of pluripotent embryonic stem cells into cardiomyocytes. Circulation Research. 2002;91(3):189–201. doi: 10.1161/01.res.0000027865.61704.32. [DOI] [PubMed] [Google Scholar]
- 14.Nagy A, Rossant J, Nagy R, Abramow-Newerly W, Roder JC. Derivation of completely cell culture-derived mice from early-passage embryonic stem cells. Proceedings of the National Academy of Sciences of the United States of America. 1993;90(18):8424–8428. doi: 10.1073/pnas.90.18.8424. [DOI] [PMC free article] [PubMed] [Google Scholar]
- 15.Wobus M, Guan K, Yang HT, Boheler KR. Embryonic stem cells as a model tostudy cardiac, skeletal muscle, and vascular smooth muscle cell differentiation. In: Turksen K, editor. Methods in Molecular Biology. Vol. 185. Totowa, NJ, USA: Humana Press; 2002. pp. 127–156. [DOI] [PubMed] [Google Scholar]
- 16.Chomczynski P, Sacchi N. Single-step method of RNA isolation by acid guanidinium thiocyanate-phenol-chloroform extraction. Analytical Biochemistry. 1987;162(1):156–159. doi: 10.1006/abio.1987.9999. [DOI] [PubMed] [Google Scholar]
- 17.Chao Z, Wu J, Zheng R, Li F-E, Xiong Y-Z, Deng C-Y. Molecular characterization and expression patterns of Lbx1 in porcine skeletal muscle. Molecular Biology Reports. 2011;38(6):3983–3991. doi: 10.1007/s11033-010-0516-1. [DOI] [PubMed] [Google Scholar]
- 18.Rolletschek A, Schroeder IS, Schulz H, Hummel O, Huebner N, Wobus AM. Characterization of mouse embryonic stem cell differentiation into the pancreatic lineage in vitro by transcriptional profiling, quantitative RT-PCR and immunocytochemistry. International Journal of Developmental Biology. 2010;54(1):41–54. doi: 10.1387/ijdb.082694ar. [DOI] [PubMed] [Google Scholar]
- 19.Buckingham M, Bajard L, Chang T, et al. The formation of skeletal muscle: from somite to limb. Journal of Anatomy. 2003;202(1):59–68. doi: 10.1046/j.1469-7580.2003.00139.x. [DOI] [PMC free article] [PubMed] [Google Scholar]
- 20.Junion G, Bataillé L, Jagla T, da Ponte JP, Tapin R, Jagla K. Genome-wide view of cell fate specification: ladybird acts at multiple levels during diversification of muscle and heart precursors. Genes and Development. 2007;21(23):3163–3180. doi: 10.1101/gad.437307. [DOI] [PMC free article] [PubMed] [Google Scholar]


