

Abstract
AIM
To determine whether customary exposure to grapefruit juice (GFJ) alters serum concentrations, effectiveness, and potential adverse effects of atorvastatin in patients requiring the medication.
METHODS
Patients receiving extended treatment with atorvastatin (10, 20 or 40 mg day−1) at a stable dose received 300 ml day−1 of 100% GFJ for a period of 90 days. One cohort of patients (arm A, n = 60) continued on their current dose of atorvastatin; the second cohort (arm B, n = 70) reduced the daily dose by 50%. Serum atorvastatin, lipid profile, liver functions, and creatine phosphokinase (CPK) were measured at baseline and at 30, 60, and 90 days after starting GFJ.
RESULTS
In Arm A patients, co-ingestion of GFJ significantly elevated serum atorvastatin by 19% to 26% compared with baseline. Changes in lipid profile relative to baseline were negligible. There were no adverse effects on liver function tests or CPK. In arm B patients, serum atorvastatin declined by 12% to 25% compared to baseline, with a small but significant unfavourable effect in serum lipid profile. There were no adverse effects on liver function tests or CPK.
CONCLUSION
In patients on extended stable atorvastatin treatment, addition of daily GFJ in typical quantities slightly elevates serum atorvastatin concentrations, but has no meaningful effect on the serum lipid profile, and causes no detectable adverse liver or muscle effects. Reduction of atorvastatin dosage when moderate amounts of GFJ are co-ingested does not appear to be necessary.
Keywords: atorvastatin, drug interactions, grapefruit juice, lipid disorders
WHAT IS ALREADY KNOWN ABOUT THIS SUBJECT
In previous studies of healthy volunteers, administration of atorvastatin with very large quantities of grapefruit juice increases exposure to atorvastatin by a mean factor of 3.3. However more typical quantities of grapefruit juice increased exposure only by a factor of 1.3. The effects of customary doses of grapefruit juice on the efficacy and safety of atorvastatin in patients requiring treatment with this drug have not been established.
WHAT THIS STUDY ADDS
The present study is the first to evaluate changes in the lipid-lowering efficacy of atorvastatin, as well as subjective and laboratory assessments of safety, in a series of hyperlipidaemic patients on stable doses of atorvastatin who co-ingested typical quantities of grapefruit juice. The findings indicate a small elevation of serum atorvastatin concentrations due to grapefruit juice, but no meaningful enhancement of lipid-lowering effects, and no evidence of adverse liver or muscle effects.
Introduction
Grapefruit juice (GFJ) contains a number of naturally-occurring furanocoumarin derivatives that irreversibly inhibit cytochrome P450-3A (CYP3A) enzymes important in human drug metabolism [1–7]. CYP3A enzymes are localized both in the liver and in enterocytes lining the proximal small bowel [8]. GFJ furanocoumarins, of which 6′, 7′-dihydroxybergamottin (DHB) is the most important, inactivate and inhibit the metabolic activity of CYP3A enzymes localized enterically. Except with high levels of exposure, GFJ furanocoumarins do not inhibit hepatic CYP3A. A number of orally administered drugs commonly used in clinical practice ordinarily undergo presystemic extraction (first-pass metabolism) partly or entirely by enteric CYP3A [5, 6]. Examples include buspirone, felodipine and simvastatin. When GFJ is co-ingested with these drugs, presystemic extraction is reduced due to inactivation of enteric CYP3A, and systemic plasma concentrations of the drugs may be increased substantially, possibly leading to enhanced clinical effects or adverse reactions [2, 5, 6].
The recognition of the possibility of drug interactions with GFJ has produced considerable speculation and concern in both the medical literature and lay press regarding the prevalence of such interactions and their clinical importance. Much of this concern has focused on the HMG-CoA reductase inhibitors or ‘statins,’ which now are widely prescribed throughout the world for the treatment of lipid disorders [9–12]. In the year 2009, atorvastatin (Lipitor) was in fact the most widely prescribed brand name drug in the United States, with more than 42 million prescriptions at a total retail cost exceeding $5 billion. In this context, understanding of the probability of a clinically significant interaction of atorvastatin with GFJ, and the consequences of an interaction if it did happen, is of general medical and public health importance [13–15].
Atorvastatin is a substrate for metabolism by CYP3A enzymes [16, 17] and has an absolute oral bioavailability in the range of 15–30% [16]. Plasma concentrations of atorvastatin are modestly increased by strong CYP3A inhibitors such as itraconazole [18, 19] or clarithromycin [20]. This contrasts with other statins such as simvastatin, having oral bioavailability in the range of 5%, for which co-administration of CYP3A inhibitors may increase AUC by a factor of 10-fold or more [9, 10]. Nonetheless, the interaction of atorvastatin with GFJ still is not completely characterized. In one study [21], pretreatment of healthy volunteers with 200 ml of double-strength GFJ three times daily for 2 days caused an increase in area under the plasma concentration curve (AUC) for atorvastatin by a factor of 3.3. In another study involving pretreatment with 250 ml of regular-strength GFJ three times daily for 2 days [22], atorvastatin AUC was increased only by a mean factor of 1.3. Among patients taking atorvastatin for the treatment of lipid disorders and who ingest more ‘typical’ quantities of GFJ, the magnitude and clinical importance of the GFJ–atorvastatin interaction still is not established. Included in the American product label for atorvastatin is that that GFJ ‘contains one or more components that inhibit CYP3A4 and can increase plasma concentrations of atorvastatin, especially with excessive GFJ consumption (>1.2 Liters per day)’.
The GREAT (GRapefruit Effect on Atorvastatin Therapy) Trial was designed to evaluate the consequences of a daily, single 10 ounce (300 ml) glass of grapefruit juice consumption on plasma concentrations and lipid-lowering effects of atorvastatin in hyperlipidaemic patients on stable atorvastatin treatment.
Methods
Participants
The study protocol and consent form were reviewed and approved by the applicable Institutional Review Board. All participants provided written informed consent.
The study subjects were hyperlipidaemic adult patients under treatment at the Watson Clinic, Lakeland, FL, USA. All were receiving chronic (>90 days) therapy with atorvastatin (ATOR) at doses of 10, 20, or 40 mg day−1, with no prior evidence of myositis or hepatic insufficiency. The diagnosis of hyperlipidaemia was consistent with the National Cholesterol Education Program guidelines [23]. Only patients receiving stable atorvastatin doses of 10 mg, 20 mg, or 40 mg daily were included. Patients were at least 21 years of age and were able to provide informed consent prior to enrollment. Patients were also excluded if historical or laboratory evidence of myositis or hepatic insufficiency was noted within 90 days prior to enrollment. Evidence of myositis was defined as diffuse musculoskeletal ache and/or creatine phosphokinase (CPK) >3× the normal upper limit (normal 20–289 mg dl−1) [24]. Hepatic insufficiency was defined as alanine aminotransferase (ALT) >3× the normal upper limit (normal: 15–41 U l−1) or aspartate aminotransferase (AST) >3× the normal upper limit (normal: 7–40 U l−1). Moderate alcohol intake for patients was restricted to ≤4 ounces (120 ml) per day (<two 12 ounce (360 ml) cans of beer, ≤two glasses of wine or ≤two mixed drinks). Women of childbearing potential who did not apply an effective method of contraception were excluded. All potential participants with a history of allergic intolerance to grapefruit juice were excluded. Patients prescribed medications known or suspected to interact with grapefruit were also excluded.
Grapefruit juice
The study utilized only 100% Florida GFJ obtained from Citrus paradisi fruit. The GJF was provided to participants from one uniform lot packaged in shelf stable standardized 10 ounce (300 ml) glass bottles. The Florida Department of Citrus (FDOC) provided testing of GFJ uniformity and noted the following nutritional analysis: calories 113, total carbohydrates 27.5 g, sugar 25 g, protein 1.25 g, and vitamin C 137% daily value. GFJ was stored at room temperature following receipt from the FDOC. The duration of storage prior to consumption did not exceed 8 weeks.
Design, setting, and intervention
The design was a prospective, single centre, open label, randomized trial. This study measured lipid profiles, serum atorvastatin concentrations, liver function tests, CPK and quality of life in response to the daily consumption for 90 days of 10 ounces (300 ml) of GFJ by hyperlipidaemic patients on atorvastatin.
Baseline data (day 0, prior initiating the study protocol) was obtained, after which patients were randomized in approximately equal numbers to one of two open labeled treatment arms. Arm A patients continued their usual maintenance atorvastatin dose (10, 20, or 40 mg). Patients in arm B used half their maintenance atorvastatin dose (0.5 × 10, 20, or 40 mg). Atorvastatin was administered as single daily doses in the evening. All patients in both arms ingested GFJ daily in the morning as described above.
The sample size was determined based on the following power analysis. Assuming a 10% drop in low density lipoprotein (LDL) as clinically significant, 65 patients in each group would assure 80% power with 0.05 type I error for overall group comparison. The current study aimed to enroll 75 patients in each group, anticipating 10 dropouts. Outcomes were measured on four study visits (entry, 30, 60, and 90 days).
Principal outcome measures
At each of four study visits, vital signs were measured, and serum samples obtained for measurement of atorvastatin concentrations, lipid profile (total cholesterol, LDL, high density lipoprotein (HDL), triglycerides), liver functions (ALT and AST), and CPK. Assay of ALT, AST, and CPK was done by a Vitros 950 analyzer made by Johnson and Johnson. Serum samples for determination of atorvastatin concentrations (atorvastatin acid, the parent compound) were stored at −70°C until the time of assay. For assay, samples were thawed, and deuterated atorvastatin was added as internal standard. After alkalinization with 1.0 N NaOH, samples were extracted with diethyl ether. The aqueous layer was frozen by immersing sample tubes in dry ice, and the upper organic layer was discarded. The remaining aqueous layer was thawed and acidified by addition of 1.0 N phosphoric acid, and extracted with diethyl ether. The organic layer was separated, evaporated to dryness, and reconstituted with a 60 : 39 : 1 mixture of 20 mm ammonium acetate, acetonitrile, and isopropanol. The reconstituted mixture was centrifuged, and the supernatant separated for LC/MS/MS analysis. Along with each set of study samples, calibration standards prepared in drug-free human plasma, containing varying known amounts of atorvastatin, were processed as well.
The HPLC system consisted of an LDC CM 4000 pump, PerkinElmer ISS-200 autosampler, and a 4MC J-sphere H80 S-4 2.0 × 15 mm column, coupled to a Quattro LC-Z MS/MS system. The HPLC mobile phase was 70 : 30 acetonitrile : 0.1% formic acid, at a flow rate of 0.2 ml min−1. m/z monitored were 559 (parent ion for atorvastatin) and 564 (parent ion for deuterated atorvastatin). The lower limit of sensitivity was 2.5 ng ml−1. The within- and between-day variability for replicate samples did not exceed 10%. The assay procedure did not measure concentrations of atorvastatin metabolites.
Subjective ratings
Because the study population consisted of patients under treatment for lipid disorders, outcome measures included evaluation of quality of life and functional status.
A Quality of Life Survey utilizing the standardized SF-36 Health Survey, version 1, measured physical well-being (PCS) and emotional well-being (MCS) [25, 26].
A myalgia score was used to assess muscle soreness without myositis (elevated CPK) for preceding 4 weeks, 1 through 5 in descending frequency – all, most, some, little, none of the time. Higher scores indicate less myalgia.
A memory score was used to subjectively rate memory loss for preceding 4 weeks, 1 through 5 in descending frequency – all, most, some, little, none of the time. Higher scores indicate less memory loss.
Statistical methods
Data on body weight, vital signs and serum lipid profiles at each measurement time point in arms A and B were aggregated by calculation of arithmetic mean and SD. Because of skewed distributions, liver function tests (ALT, AST), CPK, and serum atorvastatin concentrations were presented as median and interquartile range.
Changes over time in the outcome measures were evaluated by analysis of variance (anova) for repeated measures on rank-transformed variables, followed by comparison of 30, 60, and 90 day values with the day 0 baseline using the Friedman test. Changes over the day 0 baseline were compared between arm A and arm B at corresponding times using the Kruskal-Wallis test, a nonparametric procedure.
Study compliance
The target was to maintain a study visit frequency cycle of once every 30 days (variance ± 5 days) and phlebotomy cycle of once every 30 days (variance ± 15 days) to accommodate participants' time constraints. GFJ compliance was monitored by counting empty and residual GFJ bottles compared with days in trial.
Results
Enrollment and withdrawals
Following initial enrollment, six patients (three in each group) voluntarily withdrew within 7 days of entry because of anticipated inability to comply. An additional 29 patients withdrew from the study (15 from arm A, 14 from arm B) prior to the last follow-up visit at 90 days. Three patients completed the study but missed one follow-up visit. Reasons for withdrawal included: food intolerance (n = 9), patient request (n = 7), excluded medication prescribed post-enrollment (n = 4), myalgia (n = 2, one each in arm A and arm B), hospitalization unrelated to study (n = 2), non-compliance with visits or stock GFJ (n = 2), diabetic control prompting GJF discontinuation (n = 1), citrus allergy unknown pre-enrollment (n = 1), and death from sepsis unrelated to the study (n = 1). The final sample size used for data analysis was n = 130, with 60 in arm A and 70 in arm B. Characteristics of these patients are shown in Table 1.
Table 1.
Summary of patient characteristics
| Mean (± SD) | ||
|---|---|---|
| Arm A | Arm B | |
| Number of patients | 60 | 70 |
| Age (years) | 63 (± 11) | 66 (± 11) |
| Gender (M/F) | 37/23 | 40/24 |
| Weight (pounds) | 195 (± 39) | 191 (± 32) |
| Smoking habits (never/current/former) | 39/9/12 | 55/5/10 |
| Diabetes (yes/no) | 8/52 | 10/60 |
| Coronary artery disease (yes/no) | 31/29 | 30/40 |
| Atorvastatin dose (10/20/40 mg day−1) | 26/24/10 | 31/29/10 |
Values for arm A and arm B are not significantly different.
Patients in arm A and arm B did not differ significantly in any of the measured variables on day 0, prior to randomization and initiation of GFJ exposure (Tables 1 and 2).
Table 2.
Summary of main study results
| Mean ± SD | ||||
|---|---|---|---|---|
| Day 0 | Day 30 | Day 60 | Day 90 | |
| Weight (lb) | ||||
| Arm A | 195 (± 39) | 195 (± 39) | 196 (± 38) | 195 (± 37) |
| Arm B | 191 (± 32) | 191 (± 32) | 191 (± 31) | 191 (± 32) |
| Systolic BP (mm Hg) | ||||
| Arm A | 134 (± 14) | 130 (± 14) | 131 (± 16) | 132 (± 17) |
| Arm B | 135 (± 16) | 132 (± 15) | 132 (± 16) | 133 (± 17) |
| Diastolic BP (mm Hg) | ||||
| Arm A | 82 (± 8) | 80 (± 8) | 78 (± 9) | 79 (± 8) |
| Arm B | 80 (± 10) | 77 (± 10) | 78 (± 8) | 78 (± 9) |
| Heart rate (beats min−1) | ||||
| Arm A | 67 (± 8) | 65 (± 8) | 67 (± 9) | 67 (± 7) |
| Arm B | 70 (± 9) | 68 (± 8) | 69 (± 9) | 69 (± 8) |
| Serum atorvastatin* (ng ml−1) | ||||
| Arm A | 9.4 (5.3–21.1) | 11.9 (7.7–26.5) | 11.2 (7.3–19.7) | 11.2 (7.5–21.2) |
| Arm B | 10.1 (5.2–17.3) | 8.1 (3.7–12.0) | 8.9 (4.2–18.0) | 7.5 (3.8–11.8) |
| Cholesterol (mg 100 ml−1) | ||||
| Arm A | 159 (± 20) | 157 (± 26) | 158 (± 27) | 155 (± 26) |
| Arm B | 167 (± 31) | 169 (± 28) | 170 (± 33) | 173 (± 32) |
| Tryglycerides (mg 100 ml−1) | ||||
| Arm A | 123 (± 49) | 132 (± 56) | 142 (± 68) | 137 (± 60) |
| Arm B | 128 (± 72) | 143 (± 98) | 154 (± 116) | 156 (± 104) |
| HDL (mg 100 ml−1) | ||||
| Arm A | 46 (± 13) | 44 (± 13) | 44 (± 12) | 44 (± 12) |
| Arm B | 46 (± 11) | 44 (± 9) | 43 (± 10) | 44 (± 10) |
| LDL (mg 100 ml−1) | ||||
| Arm A | 88 (± 17) | 86 (± 17) | 86 (± 17) | 84 (± 17) |
| Arm B | 93 (± 21) | 97 (± 20) | 98 (± 21) | 101 (± 23) |
| LDL : HDL ratio | ||||
| Arm A | 3.57 (± 0.74) | 3.69 (± 0.76) | 3.73 (± 0.82) | 3.67 (± 0.78) |
| Arm B | 3.71 (± 0.84) | 3.95 (± 0.88) | 4.12 (± 0.94) | 4.06 (± 0.93) |
| ALT* (u l−1) | ||||
| Arm A | 31 (23–39) | 32 (23–42) | 31 (23–39) | 31 (24–38) |
| Arm B | 30 (24–37) | 31 (26–36) | 30 (24–36) | 29 (24–34) |
| AST* (u l−1) | ||||
| Arm A | 26 (20–31) | 26 (21–31) | 25 (18–33) | 26 (22–30) |
| Arm B | 25 (20–31) | 27 (22–31) | 25 (21–29) | 25 (22–29) |
| CPK* (u l−1) | ||||
| Arm A | 90 (60–119) | 96 (62–130) | 92 (53–131) | 94 (60–128) |
| Arm B | 79 (40–119) | 89 (55–123) | 80 (53–106) | 84 (55–113) |
| Subjective ratings | ||||
| Physical well-being (PCS) | ||||
| Arm A | 47.0 (± 9.1) | 48.0 (± 9.5) | 47.9 (± 7.9) | 48.2 (± 8.0) |
| Arm B | 46.1 (± 9.7) | 47.4 (± 9.5) | 47.4 (± 9.7) | 46.7 (± 8.9) |
| Emotional well-being (MCS) | ||||
| Arm A | 55.5 (± 6.0) | 55.3 (± 6.3) | 57.4 (± 4.5) | 57.4 (± 4.3) |
| Arm B | 54.2 (± 7.2) | 54.5 (± 6.5) | 54.8 (± 6.0) | 54.9 (± 6.3) |
| Myalgia score | ||||
| Arm A | 3.83 (± 0.89) | 3.93 (± 1.02) | 3.65 (± 1.04) | 3.75 (± 0.94) |
| Arm B | 3.80 (± 1.00) | 3.79 (± 1.09) | 3.93 (± 0.92) | 3.81 (± 0.95) |
| Memory score | ||||
| Arm A | 4.20 (± 0.88) | 4.16 (± 0.96) | 4.33 (± 0.67) | 4.34 (± 0.68) |
| Arm B | 4.51 (± 0.63) | 4.50 (± 0.71) | 4.37 (± 0.74) | 4.40 (± 0.68) |
Median and interquartile range.
GFJ compliance
The study subjects were highly compliant. The GFJ bottle count demonstrated 87–100% compliance based on count of empty and residual bottles.
Body weight, blood pressure, and heart rate
Table 2 shows aggregated values for all variables at the four sampling times. Body weight changed minimally with time in both arms. The slight variations reached significance in arm A, but there was no difference between the two arms at corresponding times (Table 3). Systolic blood pressure fell slightly with time, but diastotic blood pressure and heart rate did not charge with time and did not differ between arms A and B (Table 3).
Table 3.
Outcome of non-parametric analysis of changes over time, individual comparison of days 30, 60, and 90 values vs. day 0, and comparison of arms A and B at corresponding times
| Value of F from anova | Outcome of Friedman Non-parametric test | Comparison of changes over day 0 baseline for arm A vs. arm B (Kuskal-Wallis test)* | ||||||
|---|---|---|---|---|---|---|---|---|
| 0 vs. 30 | 0 vs. 60 | 0 vs. 90 | Day 30 | Day 60 | Day 90 | |||
| Body weight | Arm A | 3.91 (P < 0.01) | P < 0.01 | P < 0.03 | ||||
| Arm B | ||||||||
| Systolic blood pressure | Arm A | 4.0 (P < 0.01) | P < 0.002 | P < 0.02 | P < 0.05 | |||
| Arm B | ||||||||
| Diastolic blood pressure | Arm A | 6.48 (P < 0.001) | P < 0.01 | P < 0.001 | P < 0.001 | |||
| Arm B | 3.63 (P < 0.02) | P < 0.002 | P < 0.05 | |||||
| Heart rate | Arm A | P < 0.05 | ||||||
| Arm B | ||||||||
| Serum atorvastatin | Arm A | 3.01 (P < 0.05) | P < 0.01 | P < 0.05 | P < 0.001 | P < 0.01 | ||
| Arm B | 6.91 (P < 0.001) | P < 0.001 | P < 0.001 | |||||
| Total cholesterol | Arm A | P < 0.002 | ||||||
| Arm B | 4.70 (P < 0.005) | P < 0.05 | P < 0.001 | |||||
| Triglycerides | Arm A | |||||||
| Arm B | 7.67 (P < 0.001) | P < 0.05 | P < 0.001 | P < 0.001 | ||||
| HDL | Arm A | 11.2 (P < 0.001) | P < 0.001 | P < 0.001 | P < 0.001 | |||
| Arm B | 12.9 (P < 0.001) | P < 0.001 | P < 0.001 | P < 0.001 | ||||
| LDL | Arm A | P < 0.05 | P < 0.001 | |||||
| Arm B | 6.44 (P < 0.001) | P < 0.02 | P < 0.05 | P < 0.001 | ||||
| LDL : HDL ratio | Arm A | 3.27 (P < 0.05) | P < 0.05 | P < 0.01 | P < 0.01 | P < 0.005 | P < 0.01 | |
| Arm B | 24.4 (P < 0.001) | P < 0.001 | P < 0.001 | P < 0.001 | ||||
| Physical well-being (PCS) | Arm A | |||||||
| Arm B | 4.37 (P < 0.01) | P < 0.005 | P < 0.002 | |||||
| Emotional well-being (MCS) | Arm A | 4.75 (P < 0.005) | P < 0.02 | P < 0.002 | P < 0.002 | P < 0.002 | ||
| Arm B | 4.30 (P < 0.01) | P < 0.02 | P < 0.002 | |||||
| Myalgia score | Arm A | 3.52 (P < 0.02) | ||||||
| Arm B | ||||||||
| Memory score | Arm A | P < 0.05 | ||||||
| Arm B | ||||||||
Serum atorvastatin concentrations at corresponding times were compared as actual values, not changes. No entry indicates lack of statistical significance. Friedman test was applied only if the anova was significant.
Serum atorvastatin concentrations
In arm A, median serum atorvastatin increased relative to the day 0 value by 19% to 26% on days 30, 60, and 90 (Table 2). The change with time was significant, and days 30, and 90 each differed significantly from day 0 (Table 3). In arm B, median serum atorvastatin decreased significantly with time by 12% to 25% on days 30, 60, and 90 compared with day 0 (Table 2). Days 30 and 90 individually differed significantly from day 0 (Table 3). Arm A and arm B differed significantly from each other on days 30 and 90 (Table 3).
Table 4 shows median atorvastatin concentrations, with patients divided according to daily dosage. In general, serum concentrations increased with daily dosage, and changes over baseline associated with GFJ, as well as differences between arms A and B, were similar to those observed for the entire data set aggregated across all doses. However, sample sizes within each group were smaller, particularly at the highest dosage level.
Table 4.
Serum atorvastatin concentrations (ng ml−1) at different daily doses
| Median concentration (with inquartile range) for day: | |||||
|---|---|---|---|---|---|
| Initial daily dose (mg) | Arm | 0 | 30 | 60 | 90 |
| 10 | A | 5.4 (0–10.2) | 7.6 (4.8–10.5) | 7.8 (3.3–11.3) | 7.8 (3.8–10) |
| n = 22 | n = 22 | n = 22 | n = 22 | ||
| 10* | B | 7.6 (5–14.8) | 6.1 (2.9–10.5) | 5.8 (4–12.6) | 7.0 (4–8.3) |
| n = 29 | n = 26 | n = 29 | n = 22 | ||
| 20 | A | 17.6 (9.1–27) | 16.7 (10–22.6) | 12.3 (9.7–22.1) | 14.5 (10.9–20.9) |
| n = 17 | n = 21 | n = 24 | n = 20 | ||
| 20* | B | 11.0 (5.8–26.6) | 9.8 (4.1–15.6) | 11.2 (5.1–18.8) | 9.5 (4.6–16.4) |
| n = 22 | n = 25 | n = 20 | n = 22 | ||
| 40 | A | 23.7 (6–30.4) | 19.5 (12–45.5) | 19.8 (13–35.3) | 21.3 (15.4–26.1) |
| n = 9 | n = 9 | n = 7 | n = 9 | ||
| 40* | B | 11.5 (5.7–20.7) | 8.5 (7.2–12.8) | 9.6 (6.8–18.5) | 5.1 (2.3–8.1) |
| n = 7 | n = 10 | n = 10 | n = 8 | ||
Initial dose reduced by 50% after day 0 in arm B.
Serum lipid responses
Total cholesterol changed little with time in arms A and B (Table 2). The 4% increase in arm B reached significance (Table 3). The two arms differed from each other at day 90 (Table 3). Triglycerides increased by 11% in arm A and by 23% in arm B. Changes over time in arm B were significant (Table 3).
HDL fell slightly though significantly in both arms (Tables 2 and 3). LDL and the LDL : HDL ratio both increased significantly with time in arm B, but changes in arm A were small. Arm B differed significantly from arm A at 60 and 90 days.
Figure 1 shows a graphical representation of the serum lipid responses.
Figure 1.
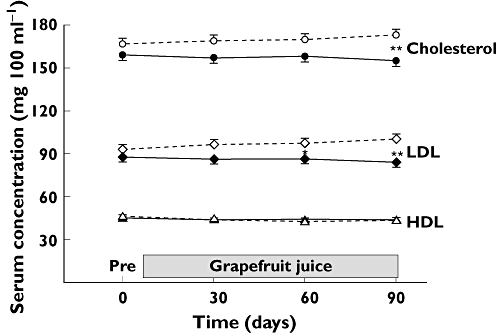
Mean (± SE) values of total cholesterol, low-density lipoproteins (LDL), and high-density lipoproteins (HDL) at corresponding sampling times for patients in arm A and arm B. Asterisks show the outcome of non parametric statistical testing comparing the change over the day 0 baseline values for arm A vs. arm B at corresponding times (* indicates P < 0.05; ** indicates P < 0.002). Arm A ( ); Arm B (
 )
)
Liver function tests and serum CPK
ALT, AST, and CPK changed minimally over the course of the study (Table 2). None of the changes over time reached significance, and arms A and B did not differ from each other.
Quality of Life measures
There were small changes in physical and emotional well-being scores, some of which reached statistical significance (Tables 2 and 3). These changes were in the direction of higher scores.
Myalgia and memory scores
Mean myalgia and memory scores changed minimally with time (Table 2). These ratings were also analyzed by combining scores of 1, 2, and 3 into a category of ‘some’ myalgia or ‘some’ memory loss (Table 5). For the myalgia score, there were no significant variations with time or differences between arms. For the memory score, the percentage of patients rating ‘some’ memory loss on day 0 was significantly higher in arm A than in arm B. However the percentage declined over time in arm A, and the two arms had similar scores as the trial proceeded.
Table 5.
Ratings on myalgia and memory questions*
| Percent of patients with rating of ‘some’ on day: | |||||
|---|---|---|---|---|---|
| 0 | 30 | 60 | 90 | ||
| Myalgia | Arm A | 30.2% | 20.4% | 40.1% | 34.0% |
| Arm B | 29.1% | 34.5% | 27.3% | 32.7% | |
| Memory | Arm A | 25.0% | 20.5% | 12.2% | 12.2% |
| Arm B | 7.3% | 14.6% | 12.7% | 9.1% | |
Scores of 1, 2, or 3 on the 5-point scale were combined and categorized as ‘some’.
Discussion
Atorvastatin is one of the most widely prescribed drugs in the world. Many pharmacy compendia and secondary/tertiary data sources advise patients to avoid GFJ because of the potential interaction. This study was designed to study the safety as well as lipid-lowering effects of the combination of atorvastatin and extended intake of GFJ.
The study population included patients with lipid disorders who had been receiving treatment with atorvastatin at a stable daily dosage for at least 3 months. All patients then initiated daily exposure to a customary quantity of GFJ – 10 ounces (300 ml) of commercially available 100% GFJ, provided from a single source, once daily for a period of 90 days. In addition, half of the patients, as determined by random assignment, reduced their daily dose of atorvastatin by 50%.
Patients in arm A continued on their usual dose of atorvastatin. The addition of daily GFJ caused a statistically significant increase in serum atorvastatin concentrations, with the increase of median concentration in the range of 19% to 26% above the day 0 baseline value. It is probable that the increase in serum atorvastatin concentrations was caused by co-ingestion of GFJ. In any case, the magnitude of the increase was small, and there was no evidence that the change was associated with any increased risk of liver or muscle toxicity. The effect on serum lipids in arm A patients was quantitatively negligible.
In arm B patients, in whom atorvastatin dose was reduced by 50%, there was a significant drop in serum atorvastatin concentrations, with a reduction in median concentration in the range of 12% to 25% compared to the day 0 baseline. This was associated with a significant increase (relative to baseline) in serum cholesterol (by 4%), triglycerides (by 23%), LDL (by 9%), and the LDL : HDL ratio (by 9%). Although a clear relationship between serum atorvastatin concentration and effects on serum lipids is not established, the increase in lipid measures in arm B patients is consistent with the fall in serum atorvastatin concentrations. In any case, it is evident that these changes in lipid profile, while statistically significant, are small or modest in magnitude, of uncertain clinical importance, and could be dealt with by a re-adjustment in atorvastatin dosage. As in arm A patients, there was no evidence of liver or muscle toxicity in arm B patients.
The findings from the GREAT trial demonstrate that, subject to the conditions of the study, a small and statistically significant increase in serum atorvastatin concentrations is associated with co-ingestion of ‘typical’ quantities of GFJ in patients on extended treatment with atorvastatin at stable doses. There is no evidence that the change in serum atorvastatin concentrations is of concern in terms of a risk of liver or muscle toxicity. It is also evident that a meaningful clinical benefit of GFJ co-ingestion, in terms of a more favourable serum lipid profile, is not detectable. The data from arm B patients confirms that a reduction in atorvastatin dosage is not necessary for patients who initiate daily exposure to GFJ. The dose reduction apparently overrides the effect of GFJ co-ingestion, yielding a net reduction in serum atorvastatin concentrations and a small, though statistically significant, adverse effect on the serum lipid profile.
Controlled clinical pharmacokinetic studies of drug interactions often are constructed to document the ‘worst case’ scenario. The present study demonstrates that caution is required in the extrapolation of outcomes of such trials to the actual clinical setting of patients under treatment with a needed medication [2]. One pharmacokinetic study of healthy volunteers indicated a potentially important interaction of GFJ with atorvastatin, but that study involved levels of GFJ exposure substantially higher than what is typical for most consumers [21]. In a second study of GFJ exposure closer to what is typical, the magnitude of the interaction was small or modest [22]. In the current setting of typical GFJ exposure in an actual patient population, the GFJ–atorvastatin interaction was detectable but small, and of minimal clinical importance in terms of therapeutic effectiveness or toxicity.
Competing Interests
This research was supported by an unrestricted grant from the Florida Department of Citrus. David J. Greenblatt has served as a consultant to the Florida Department of Citrus. Otherwise, the authors have no conflicts of interest to declare.
REFERENCES
- 1.Bailey DG, Malcolm JAO, Spence JD. Grapefruit juice–drug interactions. Br J Clin Pharmacol. 1998;46:101–10. doi: 10.1046/j.1365-2125.1998.00764.x. [DOI] [PMC free article] [PubMed] [Google Scholar]
- 2.Hanley MJ, Cancalon P, Widmer WW, Greenblatt DJ. The effect of grapefruit juice on drug disposition. Expert Opin Drug Metab Toxicol. 2011;7:267–86. doi: 10.1517/17425255.2011.553189. [DOI] [PMC free article] [PubMed] [Google Scholar]
- 3.Bailey DG, Dresser GK. Interactions between grapefruit juice and cardiovascular drugs. Am J Cardiovasc Drugs. 2004;4:281–97. doi: 10.2165/00129784-200404050-00002. [DOI] [PubMed] [Google Scholar]
- 4.Saito M, Hirata-Koizumi M, Matsumoto M, Urano T, Hasegawa R. Undesirable effects of citrus juice on the pharmacokinetics of drugs: focus on recent studies. Drug Saf. 2005;28:677–94. doi: 10.2165/00002018-200528080-00003. [DOI] [PubMed] [Google Scholar]
- 5.Mertens-Talcott SU, Zadezensky I, De Castro WV, Derendorf H, Butterweck V. Grapefruit-drug interactions: can interactions with drugs be avoided? J Clin Pharmacol. 2006;46:1390–416. doi: 10.1177/0091270006294277. [DOI] [PubMed] [Google Scholar]
- 6.Greenblatt DJ. Update on drug interactions with grapefruit juice: an evidence-based review. Pharm Times. 2010;76:105–14. Jan. [Google Scholar]
- 7.Farkas D, Greenblatt DJ. Influence of fruit juices on drug disposition: discrepancies between in vitro and clinical studies. Expert Opin Drug Metab Toxicol. 2008;4:381–93. doi: 10.1517/17425255.4.4.381. [DOI] [PubMed] [Google Scholar]
- 8.Greenblatt DJ, He P, von Moltke LL, Court MH. The CYP3 family. In: Ioannides C, editor. Cytochrome P450: Role in the Metabolism and Toxicology of Drugs and Other Xenobiotics. Cambridge: Royal Society of Chemistry; 2008. pp. 354–83. [Google Scholar]
- 9.Williams D, Feely J. Pharmacokinetic-pharmacodynamic drug interactions with HMG-CoA reductase inhibitors. Clin Pharmacokinet. 2002;41:343–70. doi: 10.2165/00003088-200241050-00003. [DOI] [PubMed] [Google Scholar]
- 10.Neuvonen PJ, Niemi M, Backman JT. Drug interactions with lipid-lowering drugs: mechanisms and clinical relevance. Clin Pharmacol Ther. 2006;80:565–81. doi: 10.1016/j.clpt.2006.09.003. [DOI] [PubMed] [Google Scholar]
- 11.Igel M, Sudhop T, von Bergmann K. Metabolism and drug interactions of 3-hydroxy-3-methylglutaryl coenzyme A-reductase inhibitors (statins) Eur J Clin Pharmacol. 2001;57:357–64. doi: 10.1007/s002280100329. [DOI] [PubMed] [Google Scholar]
- 12.Bays HE, Dujovne CA. Drug interactions of lipid-altering drugs. Drug Saf. 1998;19:355–71. doi: 10.2165/00002018-199819050-00003. [DOI] [PubMed] [Google Scholar]
- 13.Bellosta S, Paoletti R, Corsini A. Safety of statins: focus on clinical pharmacokinetics and drug interactions. Circulation. 2004;109(Suppl III):50–7. doi: 10.1161/01.CIR.0000131519.15067.1f. [DOI] [PubMed] [Google Scholar]
- 14.Corsini A, Bellosta S, Baetta R, Fumagalli R, Paoletti R, Bernini F. New insights into the pharmacodynamic and pharmacokinetic properties of statins. Pharmacol Ther. 1999;84:413–28. doi: 10.1016/s0163-7258(99)00045-5. [DOI] [PubMed] [Google Scholar]
- 15.Maron DJ, Fazio S, Linton MF. Current perspectives on statins. Circulation. 2000;101:207–13. doi: 10.1161/01.cir.101.2.207. [DOI] [PubMed] [Google Scholar]
- 16.Lennernäs H. Clinical pharmacokinetics of atorvastatin. Clin Pharmacokinet. 2003;42:1141–60. doi: 10.2165/00003088-200342130-00005. [DOI] [PubMed] [Google Scholar]
- 17.Park JE, Kim KB, Bae SK, Moon BS, Liu KH, Shin JG. Contribution of cytochrome P450 3A4 and 3A5 to the metabolism of atorvastatin. Xenobiotica. 2008;38:1240–51. doi: 10.1080/00498250802334391. [DOI] [PubMed] [Google Scholar]
- 18.Kantola T, Kivisto KT, Neuvonen PJ. Effect of itraconazole on the pharmacokinetics of atorvastatin. Clin Pharmacol Ther. 1998;64:58–65. doi: 10.1016/S0009-9236(98)90023-6. [DOI] [PubMed] [Google Scholar]
- 19.Mazzu AL, Lasseter KC, Shamblen EC, Agarwal V, Lettieri J, Sundaresen P. Itraconazole alters the pharmacokinetics of atorvastatin to a greater extent than either cerivastatin or pravastatin. Clin Pharmacol Ther. 2000;68:391–400. doi: 10.1067/mcp.2000.110537. [DOI] [PubMed] [Google Scholar]
- 20.Amsden GW, Kuye O, Wei GC. A study of the interaction potential of azithromycin and clarithromycin with atorvastatin in healthy volunteers. J Clin Pharmacol. 2002;42:444–9. [PubMed] [Google Scholar]
- 21.Lilja JJ, Kivistö KT, Neuvonen PJ. Grapefruit juice increases serum concentrations of atorvastatin and has no effect on pravastatin. Clin. Pharmacol Ther. 1999;66:118–27. doi: 10.1053/cp.1999.v66.100453001. [DOI] [PubMed] [Google Scholar]
- 22.Fukazawa I, Uchida N, Uchida E, Yasuhara H. Effects of grapefruit juice on pharmacokinetics of atorvastatin and pravastatin in Japanese. Br J Clin Pharmacol. 2004;57:448–55. doi: 10.1046/j.1365-2125.2003.02030.x. [DOI] [PMC free article] [PubMed] [Google Scholar]
- 23.Expert Panel on Detection, Evaluation, and Treatment of High Blood Cholesterol in Adults. Executive Summary of the Third Report of the National Cholesterol Education Program (NCEP) Expert Panel on Detection, Evaluation, and Treatment of High Blood Cholesterol In Adults (Adult Treatment Panel III) JAMA. 2001;285:2486–97. doi: 10.1001/jama.285.19.2486. [DOI] [PubMed] [Google Scholar]
- 24.Pasternak RC, Smith SC, Jr, Bairey-Merz CN, Grundy SM, Cleeman JI, Lenfant C. American College of Cardiology; American Heart Association; National Heart, Lung and Blood Institute. ACC/AHA/NHLBI clinical advisory on the use and safety of statins. J Am Coll Cardiol. 2002;40:567–72. doi: 10.1016/s0735-1097(02)02030-2. [DOI] [PubMed] [Google Scholar]
- 25.Ware JE. The SF-36 Health Survey. Quality of life and pharmacoeconomics. In: Spilker B, editor. Clinical Trials. 2nd edn. Philadelphia, PA: Lippincott-Raven Publishers; 1996. pp. 337–45. [Google Scholar]
- 26.Ware JE. SF-36 Health Survey Update. Available at http://www.sf-36.org (last accessed 13 May 2011) [DOI] [PubMed]