

Abstract
AIMS
To assess the predictive value of a model-based approach for dose selection across paediatric populations in early clinical drug development.
METHODS
Abacavir was selected as a paradigm compound using data across a wide age range. Abacavir pharmacokinetics (PK) in children were analysed separately from infants and toddlers. Two independent models were obtained, and systemic exposure (AUC) was then simulated across populations based on the estimates from each model. Drug exposures in infants and toddlers were predicted using pharmacokinetic parameter distributions obtained from children, and the other way around.
RESULTS
The pharmacokinetic models (a two-compartment PK model for infants and toddlers and a one compartment PK model for children) accurately described the exposure in the population from which they were built. However, neither model predicted exposure in a different population: in infants, the median AUC (95%-CI) was estimated at 7.03 (6.72, 7.48) µg ml−1 h, whilst it was predicted at 5.75 (4.82, 6.26) µg ml−1 h; in children, the estimated median AUC was 6.96 (5.85, 7.91) µg ml−1 h, whilst the predicted value was 6.45 (5.80, 7.01) µg ml−1 h.
CONCLUSIONS
These findings suggest that the assumption of an identical (linear or nonlinear) correlation between pharmacokinetic parameters and demographic factors may not hold true across age groups. Whilst the use of modelling enables accurate characterization of pharmacokinetic properties, extrapolations based on such parameter estimates may have limited value due to differences in the impact of developmental growth across populations.
Keywords: dose adjustment, model-based research, paediatric drug development, paediatric drug prescription, pharmacokinetic bridging
WHAT IS ALREADY KNOWN ABOUT THIS SUBJECT
In paediatric development, initial estimation of the paediatric dose is obtained by extrapolation. This is usually performed using the dosing regimen in another population as reference. However, no consensus on dose selection methodologies has been reached so far.
The paradigm compound identified to illustrate these concepts is a nucleoside reverse transcriptase inhibitor (NRTI) used to treat HIV infection. The recommended paediatric dose of abacavir is 8 mg kg−1 twice daily up to a maximum of 300 mg twice daily.
WHAT THIS STUDY ADDS
Our findings show that the use of a population model may not suffice to predict parameter distributions and drug exposure across paediatric populations.
Estimation of covariate effects is critical, but not sufficient to extrapolate pharmacokinetics from a reference population to another population.
Covariate-parameter correlations may not remain constant beyond the range of observations. Exponential relationships used by allometry do not correct for these discrepancies.
Introduction
Given the requirements of the new paediatric regulation in the EU and the renewal of the paediatric equity act in the USA, a higher demand for paediatric clinical trials can be anticipated. Whilst bridging approaches should be encouraged to prevent unnecessary trials, guidance is lacking about the dosing rationale and how to implement optimally dose titration or adjustment across the paediatric population. One should note that inaccurate dose extrapolation across population groups has implications to the overall paediatric development programme in which rigid protocol designs and fixed dose levels are used. Performing a trial with a sub-optimal dose regimen may lead to wrong conclusions about the exposure–response relationship or about treatment efficacy in a particular population. On the other hand, a higher than required dose may inflate the side effects and toxicity. In either case, incorrect conclusions about the suitable dose in a given paediatric age range may be carried forward when the dose is extrapolated to other groups.
To prevent such a bias, differences in PK parameter distributions across populations rather than differences in body size should be used as a basis for the dose rationale. However, paediatric dose selection is still driven by empiricism [1–4]. Clinical practice assumes linear correlations between body weight (BW) and dose, which results in dosing recommendations in children often expressed as mg kg−1[5–7], irrespective of the changes in physiology across age groups or differences in the pharmacokinetic properties of different drugs and biopharmaceuticals. Other methodologies use age as a scaling factor: the paediatric population is divided into sub-categories (pre-term newborns, term newborns, infants, toddlers, children and adolescents) [8] and the recommended dose is selected according to a child's age [9]. Scaling the dose from adults can also be performed by normalization based on body surface area (BSA), under the assumption that metabolic processes in humans are constant when expressed as a function of BSA [10].
The assumption of a linear relationship between body size and drug exposure or response is not always justifiable. Body size itself may not be a surrogate for the differences in physiology associated with growth during childhood and adolescence. Implicitly and most importantly the wide-spread use of demographic variables imposes unidirectional increase of the absolute dose with body size, which constrains the paediatric dose to be always smaller than in adults, irrespective of the relevance of various pharmaceutical, physiological and disease factors. These views also imply that pharmacokinetics can be interpolated within and extrapolated between populations. Mounting evidence suggests, however, that non-linear relationships must be considered when correlating drug exposure to demographic covariates, and in particular to body weight [11].
Non-linearity may exist between pharmacokinetics and demographic factors, due to the influence of developmental growth and organ maturation. In fact, different examples show the implications of non-linearity for dosing regimens in children [12–14] and how non-linear mixed effects and Bayesian hierarchical modelling can take into account such non-linearity. Recently, we have shown how a parametric approach can be used that incorporates the physiological factors underlying the changes in drug exposure due to developmental growth. Based on parameter distributions, it is then possible to extrapolate doses across populations. In this case, estimation of pharmacokinetic parameter distributions becomes critical to describe accurately individual differences in exposure in paediatric patients [15].
In the current investigation we focus on the dose rationale for first time in children (FTIC), i.e. selection of the safe and effective doses of a drug for a paediatric indication involving a group or population which has not been previously exposed to that drug. In particular, the objective of this paper is to retrospectively evaluate the predictive value of a model-based approach to establish dosing requirements in a paediatric population. Exposures in younger age groups were predicted using pharmacokinetic parameter distributions obtained from the analysis of exposure data in children and adolescents, and vice versa. This scenario reflects a typical problem during clinical development of compounds with a paediatric indication for which deferral may be granted to trials in younger patients. The proposed approach is illustrated for the antiviral drug abacavir, a nucleoside reverse transcriptase inhibitor (NRTI) used to treat HIV infection [16]. According to the ICH E11 guidelines [8], abacavir meets the following requirements for bridging: 1) the pathophysiological processes subsequent to viral infection in adults do not differ significantly from those observed in children, 2) the endpoint for efficacy in clinical trials is the same in both populations, as indicated by the change from baseline in viral load (plasma HIV-1 RNA) and CD4+ T cells count rise [17] and 3) given its mechanism of action, the exposure–effect relationship can be assumed to be independent of age.
Methods
Patients
Paediatric data were obtained from two studies by the Paediatric European Network for the Treatment of AIDS (PENTA), in which abacavir was dosed firstly at 8 mg kg−1 twice daily and then at 16 mg kg−1 once daily. The studies were approved by the ethics committees of each participating institution. Written informed consent was obtained from legal guardians, carers and children where appropriate. PENTA 13 was a two-period, crossover, open-label multicentre pharmacokinetic study. Fourteen children were included in the study [18]. PENTA 15 had the same design, but included 23 infants and toddlers (22 of them had PK data after twice daily dosing.) [19]. For both studies plasma samples for the analysis of abacavir concentrations were collected at steady-state conditions, with each patient contributing with four to nine blood samples. A summary of the demographic variables and treatment regimens for both PENTA trials is shown in Table 1.
Table 1.
Study characteristics and demographics
| PENTA 15 | PENTA 13 | |
|---|---|---|
| [mean (range)] | [mean (range)] | |
| Number of patients | 23 | 14 |
| Ethnicity | 16 African, 4 Caucasian, 2 Other* | African |
| Age (years) | 1.8 (0.43–2.89) | 5.9 (2.14–12.84) |
| Weight (kg) | 11.6 (7.4–15.9) | 23.8 (13.7–60.5) |
| Height (cm) | 81 (62–98) | 115 (89–164) |
| BMI (kg cm−2) | 17.8 (15.0–24.2) | 16.8 (13.8–22.4) |
| Creatinine clearance (dl h−1) | 31.7 (16.4–50.4) | 81 (59–159) |
| Male/Female | 12/11 | 8/6 |
| Normal/Fasted | 8/5* | 14/0 |
| Samples | 4–9 | 9 |
| Administration route | Oral | |
| Dosage form | 20 mg ml−1 solution | |
| Dose | 8–16 mg kg−1 |
indicates missing data.
Adult data were obtained from six clinical studies performed by GlaxoSmithKline [20–25]. One hundred and eleven adult subjects were retrieved from GlaxoSmithKline's clinical database and used as a reference population. Further details on these trials can be found at GSK clinical trial register (http://www.gsk-clinicalstudyregister.com/).
Pharmacokinetic analysis
Nonlinear mixed-effects modelling was used to analyse the pharmacokinetic data in both study populations. The first-order conditional estimation method with interaction, as implemented in NONMEM VI (release 1.0) [26] was used to fit all concentration data described later in this section.
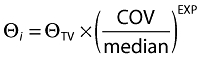
To explore the predictive power of parameter distributions and get further insight into how to best select doses in a staggered paediatric development programme, two independent pharmacokinetic models were developed, one to fit data from children (Model 1) using adult parameter distribution as prior, and the other to fit infants and toddlers' data (Model 2), without priors. The effects of BW, height, age, body mass index, creatinine clearance, gender and fasted/fed status were investigated as potential covariates on clearance, volume and absorption rate constant. Significant correlations between covariates and parameters were incorporated using an exponential relationship for continuous variables, according to the formula:
 |
(1) |
where Θi represents the individual parameter of interest, ΘTV the typical value for the parameter, median is the median of the population, COV the covariate of interest and EXP the exponent.
Priors based on adult parameters were used to stabilize parameter estimation in children using the Wishart distribution for parameter priors [27].
The minimal objective function value (OFV; equal to −2 log likelihood) determined by NONMEM was used as a diagnostic criterion, with a ΔOFV of 3.84 points corresponding to a statistically significant difference between hierarchical models (P = 0.05, χ2 distribution with one degree of freedom). The contribution of each covariate was confirmed by a stepwise backward deletion (ΔOFV = 6.64, P = 0.01, χ2 distribution). In addition, goodness-of-fit plots, including observed (OBS) vs. individual prediction (IPRED), OBS vs. population prediction (PRED), conditional weighted residuals (CWRES) vs. time and CWRES vs. OBS were used for diagnostic purposes [28].
Given that extrapolations are the primary objective of this investigation, special attention was paid to the evaluation of model misspecifications for the random effects. The normalized prediction distribution errors (NPDE) method was applied for diagnostic purposes [29]. This method was implemented using the NPDE add-on software package, which was run in R [30]. Mirror plots from datasets simulated from both models were produced and results compared with the original data.
Evaluating predictive power
The parameter estimates obtained from each model (Model 1 and Model 2) were used to simulate plasma concentrations in a sub-population different from the one analysed during model building. AUC(0,12 h) was selected as endpoint for the purposes of this evaluation. The evidence of similar parameter distributions was the basic criterion for assessing the predictive power of each model. In adults, the reference AUC value for efficacy is 6.02 µg ml−1 h [31]. No reference toxicity values were available in the published literature. Nevertheless, the use of a safety threshold was deemed unnecessary, as the main concern is the occurrence of a hypersensitivity reaction, which appears to be unrelated to abacavir concentrations [32]. We hypothesized that the AUC distribution in infants and toddlers, as extrapolated using Model 1, is comparable with the observed AUC values by Model 2. The same methodology was applied to Model 2 with the objective of predicting AUCs in patients aged 2 to 13 years. For simulation purposes we used the twice daily dose regimen, i.e. 8 mg kg−1.
Enrichment procedure
Given the small group size and skewed distribution of BW in the original datasets, re-sampling was performed to obtain a distribution of BW within the age ranges under evaluation. Data on BW distribution were extracted from the growth charts provided by the National Center for Health Statistics (http://www.cdc.gov/growthcharts/). Datasets were created which included the population in the original studies and 104 simulated patients (56 children and 48 infants and toddlers). Abacavir AUC distributions were then obtained for a total of 140 individuals (70 infants and toddlers and 70 children).
Estimation step
Drug exposure was simulated 100 times for each group of 70 patients using Model 1 and Model 2. Cumulative AUCs were calculated in NONMEM by integrating the amounts in a dummy compartment, according to the equation:
| (2) |
The geometric mean of each individual patient AUC was calculated and summarized as median, 5th and 95th percentiles. These results were then used to assess the model's predictive power.
Extrapolation from children to infants and toddlers
We evaluated whether drug exposure in infants and toddlers can be predicted accurately under the assumption of comparable correlations between pharmacokinetic parameters and covariates across age ranges. Using Model 1, the concentrations in the dataset for infants and toddlers were simulated 100 times. Similarly to the procedures used in the estimation step, the geometric mean of the AUCs for each individual patient was calculated and summarised as median, 5th and 95th percentiles. The AUC distributions obtained in the estimation step were then compared with the extrapolated values.
Extrapolation from infants and toddlers to children
The same methodology was applied to Model 2 to predict drug exposures in children aged 2 to 13 years using the model developed on infants and toddlers. Although in real life this is a less common situation, extrapolating drug exposure from neonates (for whom demographic covariates represent a surrogate for both function and maturation) to children (for whom demographic covariates may only represent differences in function or capacity) might give some insight on the possibility of using demographic covariates as surrogates for ontogeny.
In each scenario, the median, 5th and 95th percentiles of the estimated and extrapolated exposures were compared. A diagram of the data analysis procedures is summarized in Figure 1.
Figure 1.
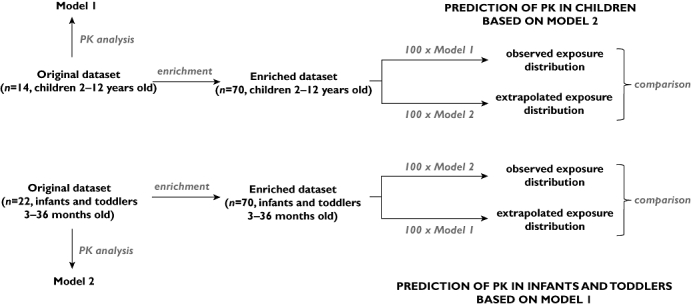
Diagram depicting model building, simulation and extrapolation procedures
Results
PK model in children (Model 1)
The PK of abacavir in children (2–13 years) was described by a one-compartment model with first-order absorption and first-order elimination. Between-subject variability (BSV) was estimated for clearance (CL), volume of distribution (V), absorption constant (Ka) and bioavailability (F). Residual variability was characterized by a proportional error model. The incorporation of BW as covariate on CL and V according to an exponential model showed the highest improvement in fitting. Further details of the parameter estimates and their distribution can be found elsewhere [15].
Bearing in mind the objective of extrapolation across populations, focus was given to the model validation steps, which yield information about the variance structure and variance-covariance matrix. As shown in Figure 2, goodness-of-fit plots reveal that the model provides an accurate description of the data. Visual predictive check (VPC) plots indicate that the data are accurately described for up to 4 h after drug administration, after which the variance seems to be slightly overestimated. Bootstrapping of this model (Table 2) yielded mean parameter distributions similar to the values estimated during data fitting. All parameter estimates fell within 5% of the bootstrapped mean, with the exception of BSV on F. Ninety-eight per cent of the runs were successful.
Figure 2.
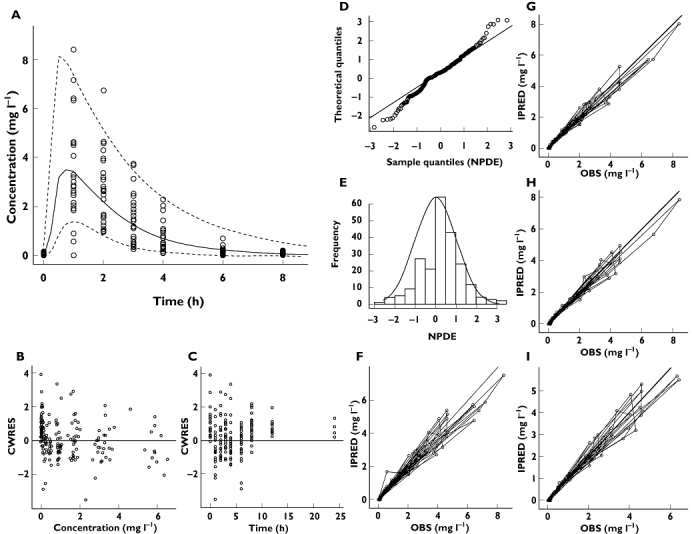
Diagnostic plots of the model based on data from children (Model 1). (A) VPC, (B) conditional weighted residuals vs. predicted concentrations, (C) conditional weighted residuals vs. time, (D, E) NPDE, (F) post hoc predictions vs. observed concentrations, (G, H, I) mirror plots. All diagnostic measures indicate acceptable goodness-of-fit and model performance, except for a slight skewness in the NPDE distribution and overestimation of variance after 4 h (panel A)
Table 2.
Final pharmacokinetic parameter estimates for abacavir, as estimated based on 2–13 year old children (Model 1, left) and on 3–36 month old infants and toddlers (Model 2, right)
| Model 1 | Model 2 | |||
|---|---|---|---|---|
| Bootstrap mean | Bootstrap mean | |||
| Parameters (units) | Mean | (CV%) | Mean | (CV%) |
| Fixed effects | ||||
| CL (l h−1) | 40.6 | 39.6 (5.4) | – | – |
| CL/F (l h−1) | – | – | 13.4 | 13.2 (6.9) |
| V (l) | 69.1 | 68.5 (4.5) | – | – |
| Vc (l) | – | – | 4.94 | 4.45 (34) |
| Vp (l) | – | – | 8.12 | 8.25 (18) |
| Q (l h−1) | – | – | 1.25 | 1.26 (21) |
| Ka (h−1) | 3.58 | 3.57 | 0.758 | 0.754 (6.1) |
| F (%) | 0.83 FIX | 0.83 | – | – |
| Exponent on CL | 0.722 | 0.694 (11) | 1.14 | 1.16 (26) |
| Exponent on V | 0.810 | 0.798 (11) | – | – |
| Inter-individual variability, % | ||||
| CL | 27 | 27 (11) | 29 | 28 (41) |
| V | 11 | 11 (6.9) | – | – |
| Ka | 98 | 93 (13) | – | – |
| F | 37 | 50 (64) | – | – |
| Vp | – | – | 40 | 41 (42) |
| Q | – | – | 31 | 51 (169) |
| Residual error, % | ||||
| ε | 3.6 | 3.6 (37) | 14 | 14 (15) |
CL, clearance; CL/F, apparent oral clearance; V, volume of distribution; Vc, central volume of distribution; Vp, peripheral volume of distribution; Q, inter-compartmental clearance; Ka, absorption rate constant; F, bioavailability.
Of particular interest were the mirror plots which showed that the model was able to simulate data with a variance structure similar to the original data. In addition, NPDE summaries indicated that the discrepancy between predicted and observed values can be assumed to be normally distributed. In spite of minor misspecification of the variance, overall these diagnostic techniques confirm that Model 1 is suitable for the purposes of data simulation (Figure 2).
PK model in infants and toddlers (Model 2)
The PK of abacavir in infants and toddlers (3–36 months) was characterized by a two-compartment model with first-order absorption and first-order elimination. BSV was identified on CL, peripheral volume and inter-compartmental CL. In addition, inter-occasion variability was also identified on CL. Residual variability was described by a proportional model. In contrast to the previous model, BW was found to be a significant covariate on CL only.
As shown in Figure 3, goodness-of-fit plots indicate that the model accurately describes the observed data. In addition, mirror plots revealed that the variance was well defined, with the simulated datasets reproducing the dispersion pattern observed in the original data. NPDE confirmed that the difference between predicted and observed values was normally distributed. Bootstrapping results also confirmed the precision of the parameter estimates obtained during the data fitting (Table 2).
Figure 3.
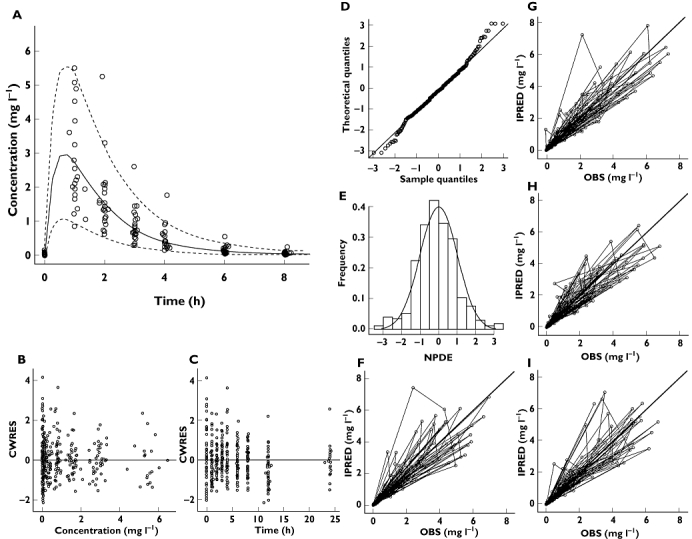
Diagnostic plots of the model based on data from infants and toddlers (Model 2). (A) VPC, (B) conditional weighted residuals vs. predicted concentrations, (C) conditional weighted residuals vs. time, (D, E) NPDE, (F) post hoc predictions vs. observed concentrations, (G, H, I) mirror plots. All diagnostic measures indicate acceptable goodness-of-fit and model performance
Extrapolation of abacavir exposure from children to infants and toddlers
To evaluate the use of a model-based approach in prospective drug development, the pharmacokinetic parameter estimates from each model were used to predict drug exposure, in terms of the area under the curve [AUC(0,12 h)], in the other population. Pharmacokinetics in infants and toddlers were extrapolated from the model built on data from children and vice versa. The population selected for the purposes of simulation and extrapolation was defined in such a way that covariate factors could be accounted for in a balanced manner.
The AUC distribution was expressed as median, 5th and 95th percentiles. AUC values in infants and toddlers, as estimated by Model 2, were 7.03 (6.72, 7.48) µg ml−1 h with all values above the target AUC observed in adults (6.02 µg ml−1 h). In contrast, predictions by Model 1 were generally lower: the median AUC was 5.75 (4.82, 6.26) µg ml−1 h. This difference was statistically significant (Wilcoxon-Mann-Whitney test, P < 0.001), with only 17% of the values reaching the proposed efficacy threshold. Figure 4 shows the discrepancies between predicted and observed AUCs in infants and toddlers, as extrapolated from the model based on children (Model 1).
Figure 4.
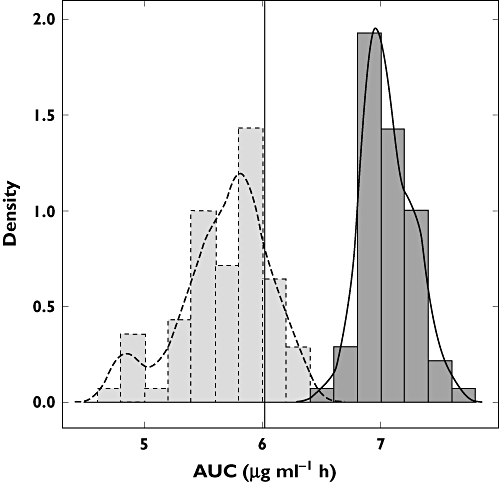
Exposure distribution in infants and toddlers (3–36 months) as estimated by Model 2 (dark grey, solid line), and as predicted by Model 1 (light grey, dashed line). The black vertical line represents the target exposure (6.02 µg ml−1 h)
Extrapolation of abacavir exposure from infants and toddlers to children
The AUC distribution in children aged 2−13 years, as estimated by Model 1, yielded a median of 6.96 (5.85, 7.91) µg ml−1 h, whilst predictions from Model 2 resulted in values of 6.45 (5.80, 7.01) µg ml−1 h. This difference was also statistically significant (Wilcoxon-Mann-Whitney test, P < 0.001), with all values above the efficacy threshold defined in adults. Similarly, predictions by Model 2 showed that target exposure was reached in 88% of the cases. Figure 5 presents the observed AUC distributions in children and the corresponding predictions by the model developed from data in infants and toddlers (Model 2).
Figure 5.
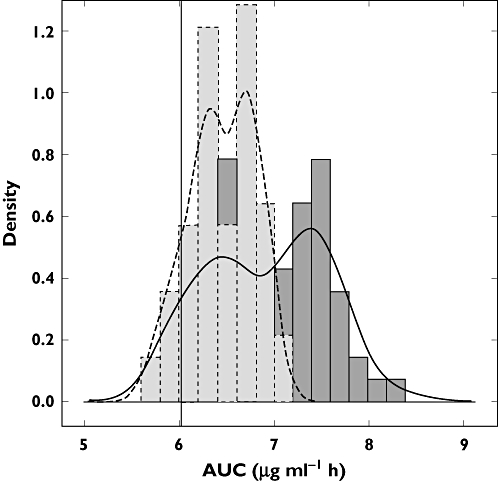
Exposure distribution in children (2–13 years old) as estimated by Model 1 (dark grey, solid line), and as predicted by Model 2 (light grey, dashed line). The black vertical line represents the target exposure (6.02 µg ml−1 h)
Discussion
Bridging strategies
One of the challenges in paediatric research protocols is to identify the dose or dose range to be used for the first time in a new population. In drug development, bridging opportunities exist for paediatric indications when no relevant differences can be anticipated in disease, disease processes or PKPD relationships. In these circumstances, bridging should ensure appropriate drug exposure in the target population without the need for dose finding studies. Some initial estimation of the paediatric dose should be obtained via extrapolation approaches. However, empiricism must be avoided [4]. This is particularly important as the implementation of suitable bridging studies may eliminate the need for formal efficacy trials.
In defining paediatric dosing recommendations, one must identify which demographic or physiological factor(s) (i.e. covariates) best describe the changes occurring during developmental growth, which can easily be used for the purposes of dose adjustment in a new population. This requirement may prove challenging if staggering of the target population according to age groups and disease prevalence is stipulated by protocol. This implies that any covariate analysis must be performed under the assumption that the correlation between parameter and covariate holds true for the overall population or that assumptions can be made about changes in these correlations beyond the age range from which they have been derived.
Our results support the current dosage in children and adults (8 mg kg−1 with a maximum of 300 mg for children and 300 mg for adults twice daily): when estimated by Model 1, 100% of derived exposures are above the reference threshold (6.02 µg ml−1 h). The same consideration can be applied to the age group regarding infants and toddlers, for which the current dosing regimen yields exposure levels comparable with adults as well.
Model-based dose selection
In a recent publication we have indicated some of the advantages of a model-based approach to design bridging studies, analyse pharmacokinetic data and derive dosing recommendations for the paediatric population [15]. Furthermore, the use of PKPD relationships as a basis for bridging also explains a wide range of scenarios in which body size and developmental growth alone are not sufficient to define dosing requirements. Although the current investigation is limited to a single paradigm compound, the findings clearly illustrate the implications and challenges for drug developers in early clinical trials. Estimation of the effect of covariates reflecting developmental growth and subsequent use of simulations based on estimated parameter distributions is critical, but not sufficient for characterizing potential differences across a population. The dosing rationale for paediatric populations must be defined on a case by case basis, taking into account pharmacokinetic and pharmacodynamic factors.
On the other hand, from a methodological perspective the use of parameter distributions from a reference population to extrapolate drug exposure and dosing requirements in a new population should be independent of the group used as reference population, i.e. model-based extrapolations should be bidirectional. Unfortunately, this requirement has not been fully met for abacavir and is likely to reflect the difficulties with dose selection for other drugs as well. Extrapolation from children to infants and toddlers yielded predicted AUCs (5.75 µg ml−1 h) which were smaller than the estimated population values (7.03 µg ml−1 h). At a first glance, this small difference could be considered clinically irrelevant. However, from a clinical pharmacology perspective, the objective of a bridging exercise is to define a dosing regimen that warrants an exposure range or distribution comparable with what has been observed in the reference population. With this in mind, the lower exposure in infants and toddlers would suggest the need for an adjustment of the dosing regimen. Using a model built on data from children the target exposure would be met only in 17% of the younger patients. According to model parameter predictions, a drastic increase of the dose would be required to ensure exposure remains comparable with adults in most of the toddlers and infants. This contrasts with the data observed in the clinical studies, which show that no dose adjustment is required. A similar problem occurs when model parameter distributions from infants and toddlers are used to extrapolate exposures in older children: target exposure is achieved in 88% of the patients. Again, one could decide to increase the dose to guarantee the target exposure in all patients, whilst the appropriate exposure is obtained with the current dosing recommendation.
In summary, both models accurately described the pharmacokinetics in the population upon which they were built. However, both models failed to predict exposure (AUC) distribution in the other population, preventing straightforward extrapolations and recommendations across populations. Whilst extrapolation of exposure in children from model parameters in infant and toddlers results in trivial differences, the same cannot be said about extrapolations in the opposite direction. The predicted exposure in infants and toddlers from model parameters in children results in large differences between the predicted and observed AUC, indicating that the covariate-parameter correlation observed in children does not appear to describe the influence of developmental factors which occur during growth in the younger group of infants and toddlers.
Differences in parameter-covariate correlations
Our results also illustrate that extrapolation of exposure across different populations or groups cannot rely on the assumption that covariate-parameter interactions remain constant beyond the range of observations. Re-parameterization of the drug disposition process may be required to mechanistically describe changes in exposure associated with ontogeny and growth. Information on the maturation profiles of the metabolic pathways that determine drug elimination may be required. Thus far, parameters associated with organ function or reflecting physiological status remain formally time invariant. These findings call for caution when applying modelling and simulation techniques for the purposes of extrapolation. All standard diagnostic criteria (post hoc predictions vs. observed concentrations, conditional weighted residuals vs. predicted concentrations, visual predictive check, mirror plots and NPDE) concurred in the validation of the models, but they were not sensitive to differences in parameter-covariate correlations. This also highlights why size cannot be taken for granted as a surrogate measure of function and as such used linearly across populations.
The simulation of a new population assumes that not only the pharmacokinetic model (structural model), but also the correlations between parameters and covariates (i.e. the covariate model) are applicable. This may be appropriate as long as the new population can be considered as part of the same parameter distributions (i.e. part of the reference population). When this requirement cannot be warranted, additional considerations may be necessary to enable accurate dose selection and adjustment during clinical development. Without such a prerequisite, one cannot exclude the risk of sub-optimal dosing or toxicity due to the effect of ontogeny of metabolic pathways, as for example in neonates and toddlers.
Clearly, limitations exist even when modelling and simulation are used to support clinical drug development. Parametric modelling approaches, which provide accurate estimates for the parameters of interest may not be sufficient for extrapolation purposes [33]. Deeper understanding of the factors affecting pharmacokinetics is required for accurate model building. Physiologically-based pharmacokinetic modelling may be useful as much as parameterization of the ontogeny of enzymatic systems associated with drug metabolism. In other words, trying to predict drug disposition in individuals beyond the range of current observations requires a more mechanistic approach compared with what is currently possible using compartmental modelling. Demographic covariates may not be suitable surrogates for describing the maturation process and changes in physiological function which take place during developmental growth. An analogy can be made to dose adjustment requirements in special populations (e.g. renal failure): the dose is adapted irrespective of any demographic covariate. Instead, the decision to adjust the dose relies primarily on organ function rather than on size [34, 35]. Often, in these cases, information from metabolic probes is used as the basis for the potential adaptation of the dose [36]. A similar approach would be desirable in paediatric research.
In conclusion, model-based approaches should represent best practice for the analysis and design of paediatric clinical trials. Decisions regarding dosing rationale should be based on parameter estimates and their distributions, rather than on empirical extrapolations. However, we show that despite statistical validation, the use of a population pharmacokinetic model may not suffice to predict parameter distribution and drug exposure in a new population, with clear implications for the selection of a dosing regimen beyond the observed population. Current methods for covariate model building do not provide the means to incorporate variation in covariate-parameter correlations across populations. Models for simulation are not necessarily the same as models for estimation. Bayesian Model Averaging concepts could be considered as an alternative approach to deal with the current limitations of paediatric data analysis [37], improving extrapolation and predictive performance [38, 39]. Dose adjustment in new populations cannot therefore rely on model predictions only. A more complex bridging strategy is required, in which the population approach represents the first step.
Acknowledgments
We thank all the children, families and staff from the centres participating in the PENTA 13 and 15 studies. We acknowledge the MRC Clinical Trials Unit, London, UK and INSERM SC10, Paris, France for conducting the studies and Alina Bergshoeff from the Department of Pharmacy, Radboud University Nijmegen Medical Centre, the Netherlands for the analysis of drug concentrations in plasma samples. The authors also thank Stefano Canti for his assistance with the figure formatting.
PENTA is a Co-ordinated Action of the European Commission (EC), supported by the Sixth Framework contract LSHP-CT-2006-018865 and Fifth Framework Program contract QLK2-2000-00150. PENTA activities are also supported by the PENTA Foundation and PENTA LABNET (EC Seventh Framework contract 201057). Financial support for PENTA 13 and 15 was also received from GlaxoSmithKline, UK.
Competing Interests
DB has received fees for speaking, funds for research and fees for consulting from GlaxoSmithKline. There are no other competing interests to declare.
REFERENCES
- 1.Mathis L, Rodriguez W. Drug therapy in pediatrics: a developing field. Dermatol Ther. 2009;22:257–61. doi: 10.1111/j.1529-8019.2009.01239.x. [DOI] [PubMed] [Google Scholar]
- 2.Anderson T, Khan NK, Tassinari MS, Hurtt ME. Comparative juvenile safety testing of new therapeutic candidates: relevance of laboratory animal data to children. J Toxicol Sci. 2009;34(Suppl 2):SP209–SP215. doi: 10.2131/jts.34.sp209. [DOI] [PubMed] [Google Scholar]
- 3.Ward RM, Benitz WE, Benjamin DK, Jr, Blackmon L, Giacoia GP, Hudak M, Lasky T, Rodriguez W, Selen A. Criteria supporting the study of drugs in the newborn. Clin Ther. 2006;28:1385–98. doi: 10.1016/j.clinthera.2006.09.007. [DOI] [PubMed] [Google Scholar]
- 4.Cella M, Knibbe C, Danhof M, Della Pasqua O. What is the right dose for children? Br J Clin Pharmacol. 2010;70:597–603. doi: 10.1111/j.1365-2125.2009.03591.x. [DOI] [PMC free article] [PubMed] [Google Scholar]
- 5.Duggan ST, Scott LJ. Intravenous paracetamol (acetaminophen) Drugs. 2009;69:101–13. doi: 10.2165/00003495-200969010-00007. [DOI] [PubMed] [Google Scholar]
- 6.Nassetta L, Kimberlin D, Whitley R. Treatment of congenital cytomegalovirus infection: implications for future therapeutic strategies. J Antimicrob Chemother. 2009;63:862–7. doi: 10.1093/jac/dkp083. [DOI] [PMC free article] [PubMed] [Google Scholar]
- 7.Stumpf JL. Deferasirox. Am J Health Syst Pharm. 2007;64:606–16. doi: 10.2146/ajhp060405. [DOI] [PubMed] [Google Scholar]
- 8.European Medicines Agency. ICH Topic E11: clinical investigation of medicinal products in the paediatric population. 2001. CPMP/ICH/2711/99.
- 9.Yokoi T. Essentials for starting a pediatric clinical study (1): Pharmacokinetics in children. J Toxicol Sci. 2009;34(Suppl 2):SP307–12. doi: 10.2131/jts.34.sp307. [DOI] [PubMed] [Google Scholar]
- 10.Lack JA, Stuart-Taylor ME. Calculation of drug dosage and body surface area of children. Br J Anaesth. 1997;78:601–5. doi: 10.1093/bja/78.5.601. [DOI] [PubMed] [Google Scholar]
- 11.Mahmood I. Prediction of drug clearance in children: impact of allometric exponents, body weight, and age. Ther Drug Monit. 2007;29:271–8. doi: 10.1097/FTD.0b013e318042d3c4. [DOI] [PubMed] [Google Scholar]
- 12.Holford NH. A size standard for pharmacokinetics. Clin Pharmacokinet. 1996;30:329–32. doi: 10.2165/00003088-199630050-00001. [DOI] [PubMed] [Google Scholar]
- 13.Mahmood I. Prediction of drug clearance in children from adults: a comparison of several allometric methods. Br J Clin Pharmacol. 2006;61:545–57. doi: 10.1111/j.1365-2125.2006.02622.x. [DOI] [PMC free article] [PubMed] [Google Scholar]
- 14.Anderson BJ, Holford NH. Mechanism-based concepts of size and maturity in pharmacokinetics. Annu Rev Pharmacol Toxicol. 2008;48:303–32. doi: 10.1146/annurev.pharmtox.48.113006.094708. [DOI] [PubMed] [Google Scholar]
- 15.Cella M, Gorter de Vries F, Burger D, Danhof M, Della Pasqua O. A model-based approach to dose selection in early pediatric development. Clin Pharmacol Ther. 2010;87:294–302. doi: 10.1038/clpt.2009.234. [DOI] [PubMed] [Google Scholar]
- 16.Simmons P. Abacavir sulfate (Ziagen) Res Initiat Treat Action. 1999;5:8–10. [PubMed] [Google Scholar]
- 17.Waters L, Moyle G. Abacavir/lamivudine combination in the treatment of HIV-1 infection: a review. Expert Opin Pharmacother. 2006;7:2571–80. doi: 10.1517/14656566.7.18.2571. [DOI] [PubMed] [Google Scholar]
- 18.Bergshoeff A, Burger D, Verweij C, Farrelly L, Flynn J, Le PM, Walker S, Novelli V, Lyall H, Khoo S, Gibb D. Plasma pharmacokinetics of once- versus twice-daily lamivudine and abacavir: simplification of combination treatment in HIV-1-infected children (PENTA-13) Antivir Ther. 2005;10:239–46. [PubMed] [Google Scholar]
- 19.Paediatric European Network for Treatment of AIDS (PENTA) Pharmacokinetic study of once-daily versus twice-daily abacavir and lamivudine in HIV type-1-infected children aged 3-<36 months. Antivir Ther. 2010;15:297–305. doi: 10.3851/IMP1532. [DOI] [PMC free article] [PubMed] [Google Scholar]
- 20.A study to compare the pharmacokinetics of, and tolerability to, a single, oral, 600 mg dose of 1592U89 in HIV positive subjects with and without liver disease. 2000. Study No. APV CNAB1006 (Clinical Study Protocol, GlaxoWellcome)
- 21.A study to determine the absolute bioavailability of an oral tablet formulation of 1592U89 in HIV-1 infected subjects. 1998. Clinical Study Protocol, GlaxoWellcome.
- 22.A study to assess the bioequivalence of the 300 mg 1592U89 hemisulfate tablet and the 100 mg 1592U89 succinate caplet, the effect of food upon bioavailability of the 300 mg tablet and the bioavailability of the 300 mg tablet relative to the new oral 1592U89 hemisulfate solution in HIV-1 infected subjects. 1998. Clinical Study Protocol, GlaxoWellcome.
- 23.A study to investigate whether there is a pharmacokinetic interaction between 1592U89 and ethanol following their co-administration to HIV infected subjects. 1998. Clinical Study Protocol, GlaxoWellcome.
- 24.A study to evaluate the single dose and steady state pharmacokinetics/dynamics of 1592U89 and its active moiety, 1144U88 5′-triphosphate, following six different dosing regimens of 1592U89 in HIV-1 infected subjects. 2000. Clinical Study Protocol, GlaxoWellcome.
- 25.A phase II study to evaluate the safety and efficacy of different regimens of 1592U89 monotherapy upon selected immunological and virological markers of HIV-1 infection in antiretroviral therapy naïve patients. 1998. Clinical Study Protocol, GlaxoWellcome.
- 26.Boeckman A, Sheiner A, Beal S. NONMEM 6. Ellicott City, MD: GloboMax, ICON Development Solutions; 2007. [Google Scholar]
- 27.Langdon G, Gueorguieva I, Aarons L, Karlsson M. Linking preclinical and clinical whole-body physiologically based pharmacokinetic models with prior distributions in NONMEM. Eur J Clin Pharmacol. 2007;63:485–98. doi: 10.1007/s00228-007-0264-x. [DOI] [PubMed] [Google Scholar]
- 28.Hooker AC, Staatz CE, Karlsson MO. Conditional weighted residuals (CWRES): a model diagnostic for the FOCE method. Pharm Res. 2007;24:2187–97. doi: 10.1007/s11095-007-9361-x. [DOI] [PubMed] [Google Scholar]
- 29.Comets E, Brendel K, Mentre F. Computing normalised prediction distribution errors to evaluate nonlinear mixed-effect models: the NPDE add-on package for R. Comput Methods Programs Biomed. 2008;90:154–66. doi: 10.1016/j.cmpb.2007.12.002. [DOI] [PubMed] [Google Scholar]
- 30.R Development Core Team. 2010. R: A language and environment for statistical computing. R Foundation for statistical computing, Vienna, Austria. ISBN 3-900051-07-0, URL http://www.R-project.org.
- 31.European Medicines Agency. EPAR for authorised medicinal products for human use: Ziagen. Available at http://www.ema.europa.eu/humandocs/Humans/EPAR/ziagen/ziagen.htm (last accessed 8 July 2010)
- 32.Mallal S, Phillips E, Carosi G, Molina JM, Workman C, Tomazic J, Jagel-Guedes E, Rugina S, Kozyrev O, Cid JF, Hay P, Nolan D, Hughes S, Hughes A, Ryan S, Fitch N, Thorborn D, Benbow A. HLA-B*5701 screening for hypersensitivity to abacavir. N Engl J Med. 2008;358:568–79. doi: 10.1056/NEJMoa0706135. [DOI] [PubMed] [Google Scholar]
- 33.Santen G, Horrigan J, Danhof M, Della Pasqua O. From trial and error to trial simulation. Part 2: an appraisal of current beliefs in the design and analysis of clinical trials for antidepressant drugs. Clin Pharmacol Ther. 2009;86:255–62. doi: 10.1038/clpt.2009.107. [DOI] [PubMed] [Google Scholar]
- 34.Bouman CS. Dosing of antimicrobial agents in critically-ill patients with acute kidney injury and continuous venvenous haemofiltration. Acta Clin Belg Suppl. 2007;2:365–70. doi: 10.1179/acb.2007.082. [DOI] [PubMed] [Google Scholar]
- 35.Verbeeck RK, Musuamba FT. Pharmacokinetics and dosage adjustment in patients with renal dysfunction. Eur J Clin Pharmacol. 2009;65:757–73. doi: 10.1007/s00228-009-0678-8. [DOI] [PubMed] [Google Scholar]
- 36.Klotz U. Antiarrhythmics: elimination and dosage considerations in hepatic impairment. Clin Pharmacokinet. 2007;46:985–96. doi: 10.2165/00003088-200746120-00002. [DOI] [PubMed] [Google Scholar]
- 37.Lunn DJ. Automated covariate selection and Bayesian model averaging in population PK/PD models. J Pharmacokinet Pharmacodyn. 2008;35:85–100. doi: 10.1007/s10928-007-9077-x. [DOI] [PubMed] [Google Scholar]
- 38.Keiding N, Budtz-Jorgensen E. The precautionary principle and statistical approaches to uncertainty. Int J Occup Med Environ Health. 2004;17:147–51. [PubMed] [Google Scholar]
- 39.Wang D, Zhang W, Bakhai A. Comparison of Bayesian model averaging and stepwise methods for model selection in logistic regression. Stat Med. 2004;23:3451–67. doi: 10.1002/sim.1930. [DOI] [PubMed] [Google Scholar]