

Abstract
Chromatin modifications, such as reversible histone acetylation, play a key role in the regulation of T cell development and function. However, the role of individual histone deacetylases (HDACs) in T cells is less well understood. In this article, we show by conditional gene targeting that T cell-specific loss of HDAC1 led to an increased inflammatory response in an in vivo allergic airway inflammation model. Mice with HDAC1-deficient T cells displayed an increase in all critical parameters in this Th2-type asthma model, such as eosinophil recruitment into the lung, mucus hypersecretion, parenchymal lung inflammation, and enhanced airway resistance. This correlated with enhanced Th2 cytokine production in HDAC1-deficient T cells isolated from diseased mice. In vitro-polarized HDAC1-deficient Th2 cells showed a similar enhancement of IL-4 expression, which was evident already at day 3 of Th2 differentiation cultures and restricted to T cell subsets that underwent several rounds of cell divisions. HDAC1 was recruited to the Il4 gene locus in ex vivo isolated nonstimulated CD4+ T cells, indicating a direct control of the Il4 gene locus. Our data provide genetic evidence that HDAC1 is an essential HDAC that controls the magnitude of an inflammatory response by modulating cytokine expression in effector T cells.
During T cell development and effector differentiation, cell fate decisions are made, and cell lineage-specific gene expression patterns are established and maintained. Epigenetic mechanisms, such as histone and DNA modifications, play a crucial role in this process. For instance, reversible changes in histone acetylation patterns accompany many important processes, ranging from VDJ recombination and CD4/CD8 cell fate decision during T cell development to the induction of cytokine expression during Th1/Th2 effector differentiation (1–5).
Modification of core histones by lysine acetylation is controlled by histone acetyltransferases and histone deacetylases (HDACs), which are considered transcriptional coactivators and corepressors, respectively. Eighteen HDACs subdivided into three classes have been identified in mammalian organisms (6, 7); however, dissecting individual roles for each member of the HDAC family in specific cell lineages and tissues remains a major scientific challenge. Several mammalian deacetylases, including HDAC1, HDAC2, HDAC3, HDAC7, and HDAC9, have been implicated in different T cell functions, and the application of HDAC inhibitors revealed important immunological processes that are dependent on the activity of HDACs (8, 9). Control of regulatory T cell development and function mediated by the transcriptional repressor FoxP3 involves HDAC7 and HDAC9, and interaction of HDAC9 and FoxP3 is antagonized by TCR stimulation (10, 11). The class I deacetylases HDAC1 and HDAC2 are highly expressed in thymus and spleen, and HDAC1-associated factors, such as Ikaros, Aiolos, and Sin3A, play important roles during T cell development (12, 13). These findings suggest a potential function of these epigenetic regulators in T cell-related processes, although the precise role of HDAC1 in T cell development and function has not been determined.
We originally identified HDAC1, the founding member of the mammalian HDAC family, as an IL-2–induced gene in a cytolytic mouse T cell line (14). Loss of HDAC1 resulted in severe developmental problems and impaired proliferation in mouse embryos, causing embryonic lethality before embryonic day 10.5 (15, 16). In this study, we analyzed the role of HDAC1 on T cell development and function. Conditional deletion of HDAC1 in the T cell lineage using Cd4-Cre deleter strains revealed that HDAC1 is dispensable for late T cell development and the generation of the peripheral T cell pool. However, the T cell-specific loss of HDAC1 resulted in an increase in all critical parameters in a Th2-type allergic airway inflammation model, such as eosinophil recruitment into the lung, mucus hypersecretion, and parenchymal lung inflammation. HDAC1-deficient Th2 cells maintained their characteristic cytokine profile; however, they produced increased amounts of Th2-type cytokines, which led to enhanced allergic airway inflammation. The increase in IL-4 production in HDAC1-deficient CD4+ T cells was observed at day 3 of Th2-polarizing cultures and was restricted to CD4+ T cells that underwent several rounds of cell division. HDAC1 bound to the Il4 gene locus in nonstimulated CD4+ T cells, suggesting a direct regulation of the Il4 gene locus in nonactivated Th cells. Similarly to the enhanced Th2 cytokine expression in Th2 cells, HDAC1-deficient Th1 cells produced elevated levels of IFN-γ. Together, our data indicate that HDAC1 activity is essential for the regulation of the cytokine response in Th1 and Th2 effector cells and that HDAC1 modulates the severity of immune-mediated diseases.
Materials and Methods
Mice
The generation of the conditional Hdac1 allele has been described (17). Cd4-Cre mice (18) were kindly provided by Dr. Chris Wilson (University of Washington, Seattle, WA). All mice were backcrossed onto C57BL/6 for at least five generations. Animal experiments were performed according to protocols approved by the Federal Austrian Ministry for Science and Research. The following primers were used for genotyping: A, Hdac1-F, 5′-GGA CTC GCC CCA AAA CAC TC-3′; B, Hdac1-R, 5′-CAA AGA TGG GGC TGG AAG GCT AAG-3′; C, Hdac1 Δ:5′-GTT ACG TCA ATG ACATCGTCCT-3′; Cd4-Cre: Cre-F1 5′-TCT CTG TGG CTG GCA GTT TCT CCA-3′; and Cre-R1 5′-TCA AGG CCA GAC TAG GCT GCC TAT-3′.
Flow cytometric analysis and Abs
Cells were isolated and stained according to standard procedures. Cells were acquired on a FACSCalibur flow cytometer (BD Biosciences, San Jose, CA) and analyzed using Cell Quest Software. The following Abs were used: FITC–anti-B220 (clone RA3-6B2), allophycocyanin–anti-B220 (clone RA3-6B2), TC–anti-CD4 (clone CT-CD4), PE–anti-CD8 (clone CD8 B9.11), PE–anti-CD8α (CT-CD8a), FITC–anti-CD3 (clone 500-A2), PE–anti-CD5 (clone 53-7.3), BIO–anti-CD8α (CT-CD8a), BIO–anti-CD11b, BIO–anti-CD11c, BIO–anti-CD45R, BIO–anti–Ly-6G (RB6-8C5), BIO–anti-Ter119, BIO–anti-NK, Alexa Fluor 647–anti-CD3 (clone 500A2), FITC–anti-CD3 (clone 145-2C11), PE–anti-CD44 (clone IM7), and Fc-block (all from BD Pharmingen, San Diego, CA), as well as PE–anti-CD25 (clone PC61.5), allophycocyanin–anti-CD62L (clone MEL-14), and Alexa Fluor 647–anti-FoxP3 (clone FJK-16a) (all from eBioscience, San Diego, CA).
T cell purification
CD4+ T cells were isolated from lymph nodes and spleens of Hdac1F and Hdac1Δ mice. Pooled cell suspensions were incubated with biotinylated anti-CD8α, anti-CD11b, anti-CD11c, anti-CD45R, anti–Ly-6G, anti-Ter119, and anti-NK Abs in PBS supplemented with 2% FBS. The CD4+ T cells were then purified by negative depletion using streptavidin beads (BD Pharmingen), according to the manufacturer’s instructions.
Th cell differentiation and analysis of cytokine production and cell division
Th2-polarization and cytokine measurements were previously described (19). For Th1 differentiation, 0.5 × 10⁶ cells/well were activated with anti-CD3/CD28 and cultured in the presence of 20 U/ml IL-2, 5 ng/ml IL12, and 1 μg/ml anti–IL-4. CD4+ T cell cultures were split 1:2 on day 3 after activation. After 6 d in culture, cells were purified over a Lymphoprep gradient and restimulated (5 × 10⁵ cells/ml) with plate-bound anti-CD3ε (0.1 μg/ml). Supernatant for cytokine quantification was collected 12 h later. IL-4, IFN-γ, IL-5, IL-10, IL-13, and IL-2 levels were determined using ELISA kits from BD Pharmingen, according to the manufacturer’s instructions.
Simultaneous analysis of proliferation and cytokine production in differentiating Th cells was essentially performed as described (20). Briefly, purified CD4+ T cells were labeled with CFSE (Molecular Probes, Eugene, OR) by incubating 1 × 10⁷ cells/ml in PBS with 10 mM CFSE for 8 min at room temperature. The CFSE-labeling reaction was stopped by adding 5 ml FCS. CD4+ T cells were washed twice with 10 ml cell-culture medium. For Th2 polarization, 0.1 μg/ml anti-CD3ε, 0.5 μg/ml anti-CD28, 1 μg/ml anti–IL-12, 3.3 μg/ml anti–IFN-γ, 10 U/ml rIL-2, and 5 U/ml rIL-4 were added to the cell-culture medium. At day 3 of differentiation, cells were restimulated with PMA (50 ng/ml) and ionomycin (500 ng/ml) for 4 h in the presence of GolgiStop (BD). Cells were stained with TC–anti-CD4, fixed and permeabilized with Cytofix/Cytoperm solution (BD Pharmingen), and subsequently stained with FITC–anti–IFN-γ, PE–anti–IL-4, allophycocyanin–anti–IL-2, or with the respective isotype controls. Cells were acquired on a FACSCalibur (BD Biosciences), and data were analyzed with CellQuest Pro software (BD Biosciences). Some samples were analyzed on a FACSCanto (BD Biosciences), and data were evaluated with FACSDiva software (BD Biosciences).
Immunoblot analysis
Single-cell suspensions of Hdac1F and Hdac1Δ thymocytes and splenocytes were isolated and stained with appropriate Abs, according to standard procedures. Cell sorts were performed on a FACSAria (BD Biosciences). Sorted cells were washed in PBS and resuspended in lysis buffer (20 mM Tris-HCl [pH 8], 138 mM NaCl, 10 mM EDTA, 100 mM NaF, 1% Nonidet-P40, and 10% glycerol) containing protease inhibitors (Roche, Basel, Switzerland). Lysates were snap-frozen in liquid nitrogen and stored at −80°C. PAGE and immunoblot analysis were performed according to standard protocols. The following Abs were used: anti-HDAC1 (06720), anti-HDAC2 (clone 3F3), anti-HDAC3 (7030), anti-HDAC6, anti-HDAC7 (all from Upstate Biotechnology, Lake Placid, NY or Millipore, Bedford, MA), anti-HDAC9 (Abcam, Cambridge, U.K.), and anti-actin (AC-74; Sigma-Aldrich, St. Louis, MO).
OVA-induced allergic asthma and ex vivo stimulation of splenocytes
Mice were sensitized with 20 μg OVA (Sigma-Aldrich) i.p. emulsified in 2 mg aluminum hydroxide in a total volume of 200 μl on days 0 and 5. One week later, mice were aerosol challenged with OVA (1% in PBS) twice daily for 2 consecutive days. Two days after the last challenge (day 15), the lungs were lavaged with 1 ml sterile PBS, bronchoalveolar lavage fluid (BAL) cells were enumerated, and cell differentials were determined. Paraffin-embedded sections were stained with H&E, periodic-acid Schiff reagent, and Luna stains. OVA-specific IgG1 was measured by standard ELISA. Plates were first incubated with OVA (10 μg/ml) overnight at 4°C and blocked with PBS-BSA (2% w/v [pH 7.4]) for 2 h before adding sera. OD readings were taken at 450 nm following incubations with anti-mouse–IgG1–biotin (SouthernBioTech, Birmingham, AL), streptavidin-HRP, and tetramethylbenzidine substrate (Sigma-Aldrich).
For the analysis of splenic CD4+ T cell responses, spleens were isolated 2 d after the last challenge (day 15). Single-cell suspensions were made, and CD8+ T cells were depleted. Approximately 5 × 10⁵ splenocytes (that contained 105 CD4+ T cells) were restimulated with 100 μg/ml OVA. Cytokines in the supernatant were determined after 72 h by ELISA.
Determination of airway resistance and airway compliance
Airway resistance and dynamic lung compliance were measured using a Finepoint Series RC site (Buxco Research Systems, Wilmington, NC), according to the manufacturer’s guidelines. In short, mice were anesthetized with an i.p. injection of ketamine/xylazine. The trachea was exposed and cannulated with a metal tube and connected to a ventilator; the esophagus was intubated with an ethanol (20%)-filled tube. Baseline signals for resistance and dynamic compliance were recorded, and mice were exposed to aerosolized 0.9% NaCl containing increasing doses of methacholine (0, 5, or 10 mg/ml). Results for airway resistance and compliance are expressed relative to baseline (baseline set to 1).
Isolation and restimulation of lung T cells from diseased mice
Lungs were removed following perfusion with 15 ml ice-cold PBS via the left ventricle of the heart, and single-cell suspensions were prepared by collagenase (Invitrogen, Carlsbad, CA) and DNase I (Sigma-Aldrich) treatment (150 U/ml collagenase D and 50 U/ml DNase I). Digested lung tissue was gently dispersed by passage through a 40-μm-pore nylon tissue strainer (BD Biosciences); the resultant single-cell suspension was treated with Pharm Lyse buffer (BD Biosciences) to remove any residual RBCs, washed twice, and dead cells were removed by a Lympholyte gradient (Cedarlane Laboratories, Hornby, ON, Canada). Lung cells (1.5 × 10⁶) were restimulated with PMA (75 ng/ml; Sigma-Aldrich) and ionomycin (750 ng/ml; Sigma-Aldrich) in the presence of GolgiStop (BD Biosciences) for 5 h at 37°C. Alternatively, splenocytes from CD45.1+ mice were homogenized, treated with Pharm Lyse buffer (BD Biosciences), γ-irradiated with 3000 rad, and incubated overnight at 37°C with 200 μg/ml OVA at 1.5 × 10⁶ cells/ml. Subsequently, 1.5 × 10⁶ OVA-loaded splenocytes were added to 1.5 × 10⁶ lung cells, and the mixed-cell populations were incubated for 8 h at 37°C. GolgiStop was added during the last 5 h of incubation. Lung cells stimulated with PMA/ionomycin or with OVA-loaded splenocytes were stained with FITC–anti-CD45.2, PE–Cy7–anti-CD44, PerCP–Cy5.5–anti-CD4, and V450–anti-CD8α (all from BD Biosciences). The cells were then fixed with 2% paraformaldehyde and permeabilized using Perm Wash buffer (BD Biosciences), according to the manufacturer’s protocol. Cells were washed with 2% FCS/PBS, and intracellular cytokine expression was detected using allophycocyanin–anti–IL-4 (BD Biosciences) or PE–anti–IL-5 and A647–anti–IL-13 (eBioscience). Data were acquired on an LSR II flow cytometer and analyzed using FlowJo software (Tree Star, Ashland, OR).
Chromatin immunoprecipitation assays
Chromatin immunoprecipitation (ChIP) was performed as previously described (21), with some modifications. Purified splenic and lymph node CD4+ T cells (5 × 10⁶ for a single precipitation) were resuspended in PBS and cross-linked in 1% formaldehyde for 10 min at 37°C. Cross-linking was stopped by the addition of glycine to final concentration of 125 mM; cells were washed and lysed, and chromatin was sonicated, as described (21). Chromatin was diluted 1:10 in dilution buffer, precleared, and precipitated overnight with anti-HDAC1 Ab. The next day, chromatin-Ab complexes were harvested by incubation with 30 μl protein A-Sepharose beads (50% slurry, 100 μg/ml salmon sperm DNA, 500 μg/ml BSA) or with 50 μl magnetic Dynabeads Protein A (Invitrogen) blocked with 1 mg/ml BSA in dilution buffer while rocking at 4°C for 2 h. The beads were washed, and chromatin-Ab complexes were eluted from the protein A-Sepharose beads using 2% NaDodSO4, 0.1 M NaHCO3, and 10 mM DTT. After de–cross-linking and proteinase K digestion, DNA was extracted with phenol-chloroform, precipitated with ethanol, and dissolved in water. The abundance of distinct DNA fragments was quantified by semiquantitative PCR, and PCR products were resolved by 2% agarose gel electrophoresis. Alternatively to semiquantitative PCR, the analysis of precipitated material was done by quantitative real-time PCR using the iCycler iQ system from Bio-Rad (Hercules, CA) and 2× SensiMix SYBR and fluorescein from Peqlab (Erlangen, Germany). Primer pairs used for ChIP assays were β-actin, 5′-TGC CAT CAA CGA CCC CTT CAT T-3′, 5′-CAC CGG CCT CAC CCC ATT TG-3′; amplicon 1, 5′-GCC AGA ACA TCA GGG TTA GTT-3′, 5′-CAG CCT GGA CTA CAT TGG AC-3′; amplicon 2, 5′-ATC AGA ACA TCA CGT CGT CT-3′, 5′-ATG CCA ACC TGA AGA ACT AAC-3′; amplicon 3, 5′-CTC TCC TGC CTC TCT TAA TTC-3′, 5′-CTG ATG CCA CCT TAG TAA GTG-3′; amplicon 4, 5′-AGG CAT TTA TCC ATG AGG TAC-3′, 5′-CAG CCT CTG ATT CGATCA A-3′; amplicon 5, 5′-AGA GTG CCA AGT CAC TGT TAC-3′, 5′-CTG TGA GTA CTT CGT GCA G-3′; amplicon 6, 5′-CCC CAC CAC AAC TAT TAG G-3′, 5′-CCC CAC TTG GTT ATT TAT GAC-3′; amplicon 7, 5′-GGG TGT GAA TAA GCC ATA TTG-3′, 5′-CCC AGC GTT TAC ATG AGC-3′; amplicon 8, 5′-GCC TGT AGG GAC CAT ACG A-3′, 5′-GCC TTG CTT GAT ACG GTA TCT-3′; amplicon 9, 5′-AGA CCT TCT CGC ATC CTA GAC-3′, 5′-GGC AAT GAG TAC CTC GAC AG-3′; amplicon 10, 5′-GCC TTG CTG AGA GTT TCT TTT GC-3′, 5′-TTG GGG ACA GAG GAT GCC TTA C-3′; and amplicon 11, 5′-GCA GTC ACC CAG AGC GCC AT-3′, 5′-CAG ATA ATG CCC AAC AAA GC-3′.
Results
Normal T cell development in the absence of HDAC1
To test the role of HDAC1 in T cell development and function, we took advantage of a conditional Hdac1 allele that we previously published (17). Hdac1F/F (for simplicity we refer to them as Hdac1F) mice are fertile and born at the expected Mendelian frequency, indicating that the loxP site insertions flanking exon 6 did not interfere with HDAC1 expression (17). To address whether deletion of HDAC1 alters peripheral T cell function, Hdac1F mice were crossed with Cd4-Cre deleter mice, which initiate deletion from the double-negative 3 stage on (Fig. 1) (22). There were no apparent T cell developmental defects in the Hdac1F × Cd4-Cre mice (for simplicity, we refer to them as Hdac1Δ)(Fig.2A). All of the major thymocyte subsets were present in normal numbers (Fig. 2B) and CD3, CD5, and CD69 surface marker expression on single-positive (SP) thymocytes was similar in Hdac1F and Hdac1Δ SP cells (data not shown). Immunoblot analysis revealed wild-type (wt) HDAC1 protein levels in Hdac1Δ double-positive (DP) cells but diminished levels in CD4SP thymocytes (Fig. 2C), suggesting that HDAC1 remains stable in DP cells and is progressively reduced during positive selection upon Cd4-Cre-mediated deletion. In peripheral wt (Hdac1F) CD4+ and CD8+ T cells, as well as Hdac1Δ B220+ B cells, HDAC1 expression is detectable, whereas Hdac1Δ CD4+ and CD8+ T cells did not show detectable levels of HDAC1. Furthermore, we observed upregulation of HDAC2 but not of HDAC3, HDAC6, HDAC7, or HDAC9 in Hdac1Δ mice (Fig. 2C). Loss of HDAC1 expression during late stages of thymocyte development and in peripheral T cells did not lead to alterations in peripheral CD4+ and CD8+ T cell distribution (Fig. 2D, 2E) and numbers (Fig. 2F). In addition, there was no difference in the distribution of naive (CD44loCD62L+) and effector/memory (CD44hi CD62L−)CD4+ T cell subsets (Fig. 2G), and there were normal numbers of FoxP3+CD4+CD25+ regulatory T cells (Fig. 2H).
FIGURE 1.
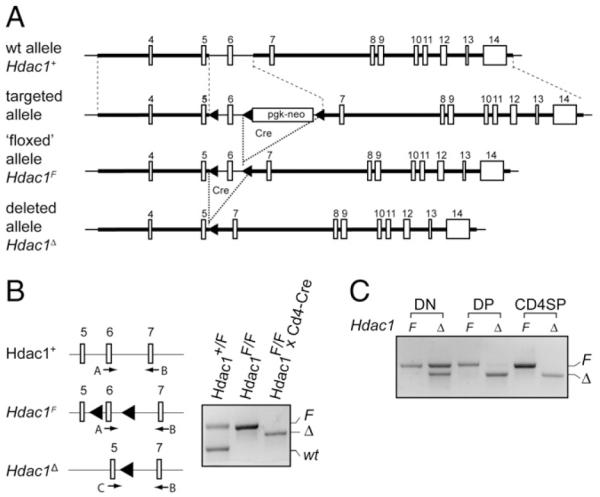
Targeting strategy for the generation of a conditional Hdac1 allele. A, Schematic map of the endogenous Hdac1 locus (upper part, Hdac1+), the targeted Hdac1 locus after homologous recombination (upper middle part), the targeted Hdac1 locus after Cre recombinase-mediated deletion of the neomycin cassette (lower middle part; “floxed” allele, Hdac1F), and the Hdac1 locus after Cre-mediated deletion of exon 6 (lower part, Hdac1D), as previously shown (17). The filled arrowheads indicate loxP sites. B, PCR analysis of DNA isolated from Hdac1+/F (wt), Hdac1F (F), or Hdac1Δ (D) CD4+ T cells. The location of the genotyping primers A, B, and C is shown at the left. All three primers were used in one PCR reaction to detect the various alleles. wt, 487 bp; F, 567 bp; Δ, 535 bp. C, PCR analysis of DNA isolated from Hdac1F (F) and Hdac1Δ (Δ) double-negative, DP, and CD4 SP thymocytes.
FIGURE 2.

Conditional deletion of HDAC1 using transgenic Cd4-Cre does not affect thymocyte development or the generation of peripheral T cells. A, CD4/CD8 expression on thymocytes from Hdac1F and Hdac1Δ mice. B, Total thymocytes and thymocyte subset cell numbers in Hdac1F (n = 4) and Hdac1Δ (n = 7) mice. Data are mean ± SD. C, Immunoblot analysis showing the expression of HDAC1, HDAC2, HDAC3, HDAC6, HDAC7, and HDAC9 in sorted DP and CD4SP thymocytes, in splenic CD4+ T cells, CD8+ T cells, and B220+ B cells from Hdac1F and Hdac1Δ mice. Whole-cell lysates from 3 × 10⁶ cells were used for each population. β-actin levels were used as loading control. Data are representative of two independent experiments. D, CD3/B220 expression profiles of Hdac1F and Hdac1Δ splenocytes. E, CD4/CD8 expression profiles of Hdac1F and Hdac1Δ splenocytes. F, Cell numbers of total splenocytes and of CD3+, B220+, CD3+CD4+, and CD3+CD8+ subsets in Hdac1F (n = 4) and Hdac1Δ (n = 5) mice. Data are mean ± SD. G, CD44/CD62L expression pattern on peripheral splenic CD4+ T cells from Hdac1F and Hdac1Δ mice. H, CD25/Foxp3 expression pattern on peripheral splenic CD4+ T cells from Hdac1F and Hdac1Δ mice. A, D and E, Data are representative of at least four Hdac1F and 7 Hdac1Δ mice. The numbers indicate the percentage of cells in the quadrant. G and H, Data are representative of three mice analyzed. The numbers indicate the percentage of cells in the indicated regions.
Increased allergic airway inflammation and enhanced Th2 cytokine production in the absence of HDAC1
HDACs have been implicated in asthma and allergic diseases (23, 24). The HDAC inhibitor trichostatin A (TSA) and the class III HDAC inhibitor sirtinol attenuate airway inflammation in a murine model of allergic asthma (25, 26) which displays several features of a Th2-type reaction and characteristic IL-5–dependent infiltration of eosinophils into the lung (27). To analyze whether HDAC1 activity in T cells regulates allergic airway inflammation, we tested whether loss of HDAC1 influences the extent of the inflammatory response. Hdac1F and Hdac1Δ mice were primed i.p. on days 0 and 5 with OVA and challenged with aerosolized OVA on days 12 and 13 (28). Two days later, mice were analyzed for lung inflammation and mucus production. Total inflammatory cells in the airways (BAL) were increased in Hdac1Δ mice compared with Hdac1F mice as the result of an enhanced infiltration of eosinophils into the BAL, airways, and peripheral lung (Fig. 3A, 3B). There was marked mucus hypersecretion (Fig. 3C, 3D) and parenchymal lung inflammatory infiltrates containing eosinophils (Fig. 3E). Furthermore, the analysis of serum OVA-specific IgG1 levels revealed Ag specificity (Fig. 3F). Moreover, Hdac1Δ mice showed enhanced airway resistance (Fig. 3G) and reduced airway compliance (Fig. 3H) compared with Hdac1F mice. Together, these data suggest a negative regulatory role for HDAC1 in the generation of airway inflammation.
FIGURE 3.

Enhanced allergic airway disease in HDAC1-deficient mice. Hdac1F and Hdac1Δ mice were immunized i.p. twice with OVA, followed by OVA aerosol challenges (OVA; n = 5). Untreated Hdac1F and Hdac1Δ mice were used as control (con; n = 3). A, BAL differential cell count. Mean ± SEM are shown. B, Eosinophil numbers at specified areas of lung parenchyma. Luna-stained lung tissue sections were counted with a 100× oil-immersion objective. C, Representative photomicrographs of lung sections. Arrows indicate fuchsia-stained mucus in epithelial goblet cells. Scale bar, 50 μm; original magnification ×400. D, Grading of mucus production. The distribution of goblet cells in the central and peripheral airways was scored on periodic-acid Schiff reagent-stained sections. Grade 0, no goblet cells; grade 1, >20%; grade 2, 20–40%; grade 3, 41–60%; grade 4, 61–80%; and grade 5; >80% goblet cells. E, Representative photomicrographs of H&E-stained lung tissue sections. Areas of highest-density inflammation are shown. Arrows indicate infiltrates. Scale bar, 200 μm; original magnification ×100. F, OVA-specific IgG1 titers of sera harvested 2 d after the last OVA-aerosol challenge. Mean ± SEM is shown. Data in A–F are representative of three independent experiments. Airway resistance (G) and dynamic compliance (H) in response to MCh. The bsl value was set as 1, and values relative to baseline are shown. Data show summary of eight independent mice per genotype. *p < 0.05; **p < 0.01, unpaired Student t test. AW, airways; bsl, baseline; BV, blood vessel; CA, central airways; CL, central lung; con, control; E, eosinophil; L, lymphocyte; M, macrophage; MCh, metacholine; MU, mucus; N, neutrophil; PA, peripheral airways; PL, peripheral lung.
To characterize the CD4+ T cell response of diseased mice, lung T cells were isolated 48 h after the last OVA aerosol challenge. The T cells were restimulated with OVA-pulsed irradiated splenic APCs or with PMA/ionomycin. Under both conditions, enhanced Th2 cytokine production of lung CD4+ T cells in the absence of HDAC1 was observed (Fig. 4A–C), although we were able to detect IL-4 expression only upon PMA/ionomycin restimulation (Fig. 4C). Enhanced IL-4 and IL-5 cytokine production was also detected when CD8+ T cell-depleted splenocytes isolated from diseased Hdac1F and Hdac1Δ mice were restimulated with OVA (Fig. 4D), whereas IL-13 levels were similar (Fig. 4D). No IFN-γ production above control levels was detected in splenocytes or Ag-restimulated lung CD4+ T cells of diseased Hdac1F and Hdac1Δ mice (data not shown). Because Th2 cytokines are clearly linked with the induction and maintenance of airway inflammation (29), these data suggest that enhanced Th2 cytokine production is responsible for enhanced airway inflammation in Hdac1Δ mice.
FIGURE 4.

Enhanced Th2 cytokine production in diseased Hdac1Δ mice. A, Lung cells from imm or nonimmunized con Hdac1F and Hdac1Δ mice (CD45.2+) were isolated and stimulated for 8 h with gamma-irradiated CD45.1+ OVA-loaded splenocytes, as described in Materials and Methods. Dot plots show representative CD44 versus intracellular IL-5 (left panel) or IL-13 (right panel) on gated CD4+CD45.2+ cells. Numbers in the quadrants indicate the percentage of cells in the respective quadrant. B, Summary of all individual CD4+CD45.2+ lung cells analyzed as described in A. Experiments were performed in two independent batches with at least three mice per experiment. Each dot represents a mouse. The p values were calculated using an unpaired Student t test. C, Lung cells from imm or nonimmunized Hdac1F and Hdac1Δ mice were isolated and stimulated for 5 h with PMA/ionomycin as described in Materials and Methods. Dot plots show CD44 versus intracellular IL-4 (upper panel), IL-5 (middle panel), or IL-13 (lower panel) expression on CD4+ CD45.2+ cells. Each dot plot shows the pool of lung cells isolated from three mice (lung cells from mice were pooled prior to activation and staining). One representative experiment of two is shown. D, IL-4, IL-5, and IL-13 cytokine production of OVA-restimulated CD8+ T cell-depleted splenocytes from imm or nonimmunized con Hdac1F and Hdac1Δ mice. Cytokine levels in the supernatant were determined 72 h after restimulation. Mean ± SEM are shown. Data are the summary of three (for IL-4 and Il-5) or two (for IL-13) independent experiments with at least four mice per experiment for diseased mice (n = 13 for IL-4 and IL-5; n = 9 for IL-13) and at least two mice per experiment for control mice (n = 7 for IL-4 and IL-5; n = 5 for IL-13). *p < 0.05, unpaired Student t test. Δ, Hdac1Δ; con, control; F, Hdac1F ; imm, immunized and diseased; n.s., not significant.
HDAC1-deficient in vitro-polarized Th1 and Th2 T cells produce increased amounts of cytokines
The establishment and maintenance of the cytokine-expression pattern during Th effector differentiation is regulated at the epigenetic level and is accompanied by an increase in a Th1 and Th2 lineage-specific histone acetylation pattern at the Ifng and Il4 gene loci, respectively (30, 31). To investigate whether enhanced cytokine levels can also be detected upon in vitro activation of HDAC1-deficient T cells, peripheral CD4+ T cells were isolated from Hdac1F and Hdac1Δ mice and polarized into Th2 lineages. The analysis of the cytokine-expression profile revealed that Hdac1Δ Th2 cells still expressed IL-4 but not IFN-γ (Fig. 5A), thus indicating that the helper lineage-specific cytokine-expression pattern is maintained in the absence of HDAC1. However, the levels of IL-4, IL-5, IL-10, and IL-13 in Th2 cultures were higher in Hdac1Δ Th cells compared with Hdac1F cells (Fig. 5A), in agreement with the enhanced Th2 cytokine levels observed in diseased Hdac1Δ mice (Fig. 4). Similarly, Hdac1Δ Th1 cultures produced enhanced levels of IFN-γ and maintained a Th1-type cytokine profile (Fig. 5B). This indicates an essential role for HDAC1 in controlling expression levels of Th lineage-specific cytokines.
FIGURE 5.

Th1 and Th2 cells show augmented cytokine production in the absence of HDAC1. Relative cytokine levels in the supernatant of polarized Th2 (A) and Th1 (B) cells. In each experiment, Hdac1F cytokine levels were set as 1 (= 100%), and the relative level of Hdac1Δ Th2 or Th1 T cells was calculated. Each dot represents one independent experiment. Cytokine levels were determined with ELISA. The p values were calculated using a Wilcoxon signed-rank test. The cytokine levels in individual batches of Hdac1F Th1 cultures were in the range of 9.9–1420 ng/ml for IFN-γ and 1.5–2.7 ng/ml for IL-13. For Hdac1F Th2 cultures, the cytokines levels were in the range of 5.1–21.9 ng/ml for IL-4, 0.6–2.3 ng/ml for IL-5, 0.7–17 ng/ml for IL-10, and 4.5–10.9 ng/ml for IL-13. n.d., not detectable.
To determine the kinetics of cytokine production in the absence of HDAC1, CD4+ T cells were isolated from Hdac1F and Hdac1Δ mice, labeled with CFSE, and stimulated with anti-CD3 plus anti-CD28 under Th2-polarizing conditions for 3 d. Under these conditions, only a small subset of wt (Hdac1F) CD4+ T cells started to produce IL-4, whereas there was a 3–4-fold increase in the percentage of IL-4–producing cells within the Hdac1Δ CD4+ T cell population (Fig. 6A, 6B, upper panels). In contrast, IL-2 levels were similar between Hdac1Δ and Hdac1F T cells (Fig. 6A, 6B, middle panels). Thus, our data indicate that HDAC1 might be the major HDAC regulating the epigenetic status of the activated IL-4 locus to ensure appropriate cytokine levels. In line with previous data (20, 32) we also observed that IL-4 production was restricted to cells that underwent several rounds of cell divisions (Fig. 6A, 6B, upper panels). This may imply that cell proliferation is required to remove other repressive epigenetic marks, such as DNA methylation, from the Th2 cytokine loci (5). In addition to the enhanced IL-4 production, Hdac1Δ T cells activated under Th2-polarizing conditions displayed increased proliferation, because the percentage of Hdac1Δ CD4+ T cells that underwent more than four divisions was greater compared with Hdac1F CD4+ T cells (Fig. 6A, 6B, lower panels). Similar to enhanced IL-4 expression in Hdac1Δ Th2-polarizing cultures, we observed enhanced IFN-γ expression in Hdac1Δ Th1-polarizing cultures (data not shown).
FIGURE 6.

Elevated cytokine expression after 3 d of Th2-polarizing conditions. A, CFSE-labeled Hdac1F and Hdac1Δ CD4+ T cells were cultured under Th2-polarizing conditions for 3 d and restimulated with PMA/ionomycin for 4 h. Intracellular IL-4 (upper panels) and IL-2 (middle panels) cytokine expression was determined. The rectangle outlined in bold in the dot plots indicates gating regions to determine the percentage (the numbers next to the rectangle) of cytokine-positive CD4+ T cells, whereas the vertical lines in the rectangle separate the populations that underwent zero, one, two, three, four, and five rounds of cell division. The numbers above the CFSE graph (lower panels) indicate the percentage of cells that underwent zero, one, two, three, four, and five cell divisions. B, Summary of all experiments (n = 6) performed as described in A. The percentage of IL-4– and IL-2–expressing CD4+ T cells after zero, one, two, three, four, and five cell divisions are shown in the upper and middle panel, respectively, whereas the percentage of CD4+ T cells that underwent zero, one, two, three, four, and five cell divisions is shown in the lower panel. The p values were calculated using the Student t test (paired, two-tailed). Δ, Hdac1Δ CD4+ T cells; F, Hdac1F CD4+ T cells.
HDAC1 is recruited to the Th2 cytokine locus
As described above, conditional deletion of HDAC1 in the T cell lineage resulted in increased levels of Th1- and Th2-type cytokines in differentiating and in polarized effector T cells. This suggests that HDAC1 limits the extent of cytokine production upon activation of T cells. HDAC1 is part of multiprotein repressive chromatin remodeling complexes that are recruited to target genes (6). Thus, the lack of HDAC1 activity might impair the repressive activity of such complexes. To determine whether HDAC1-containing remodeling complexes bind to the Il4 gene locus, ChIP assays with non-stimulated wt (Hdac1F) CD4+ T cells and as a control with Hdac1Δ CD4+ T cells were performed. Several known DNase I hypersensitivity sites (HSs) at the Il4 gene locus (33, 34) were tested as potential candidate target regions. This led to the identification of multiple HDAC1 recruitment sites at the Il4 gene locus and the surrounding cytokine genes in Hdac1F CD4+ T cells (Fig. 7), suggesting a direct control of the Il4 gene locus by HDAC1.
FIGURE 7.

HDAC1 binds to several cis-regulatory sites at the Th2 gene complex in nonstimulated CD4+ T cells. A, Upper panel, Map of the Il4 and Il13 gene loci indicating the location of exons, the identified DNase I HSs, and the neighboring Kif3a and Rad50 genes (45). Horizontal arrows above the genes indicate the transcriptional orientation. Lower panel, Semi-quantitative PCR analysis of chromatin immunopre-cipitated with an HDAC1 Ab from sorted primary F and Δ CD4+ T cells. The location of the 11 amplicons within known HSs spanning the Il4 and Il13 genes are indicated by the lines. The precipitation is compared with the 1:80 dilution of input DNA. One representative PCR amplification (from experiment 1) of three independent ChIP assays is shown, and the summary for all experiments is shown below. Boxed amplicons indicate similar results observed in all three ChIP experiments. B, Quantitative real-time PCR analysis of chromatin immunoprecipitated with an HDAC1 Ab from sorted primary Hdac1F (F) and Hdac1Δ (Δ) CD4+ T cells. The location of the 11 amplicons is shown in A. Data represent the summary of two independent experiments. +, binding; −, no binding; Δ, Hdac1Δ; F, Hdac1F; nd, not done.
Discussion
Reversible changes in histone acetylation patterns accompany many important processes in T cells. Eighteen HDACs have been identified in mammalian organisms (6, 7), and it remains a major scientific challenge to dissect the individual roles for each member of the HDAC family in specific cell lineages and tissues. In this study, we used conditional gene targeting to investigate the role of HDAC1 in T cells. We observed that HDAC1 deletion in T cells enhances allergic airway inflammation by modulating cytokine production in Th1/Th2 effector T cells. Thus, our study indicates a crucial negative regulatory role for HDAC1 in T cells.
One important finding of our study was that T cell-specific loss of HDAC1 leads to enhanced allergic airway inflammation. HDACs were implicated previously in lung inflammation (23). Patients suffering from chronic obstructive pulmonary disease display reduced HDAC activity and show decreased HDAC2 expression levels in peripheral lung and alveolar macrophages (35). Reduced HDAC activities and HDAC2 expression were also observed in bronchial biopsies of asthmatic patients (36). Anti-inflammatory drugs, such as glucocorticoids, reduce inflammation via glucocorticoid receptor-mediated recruitment of HDAC2 and the downregulation of target genes (37). Thus, reduced expression of HDAC2 in certain lung diseases may increase inflammatory gene expression. In contrast, treatment of patients with the anti-inflammatory drug theophylline increases HDAC activity and, therefore, decreases the inflammatory response in asthma (38). Our data provide genetic evidence that HDAC1 regulates the extent of the inflammatory response by modulating T cell function. Thus, HDAC1 and HDAC2 may negatively regulate lung disease, although they may act in different cell subsets. Given that HDAC2 is upregulated in HDAC1-deficient T cells, it is possible that the entire impact of HDAC1 loss on airway inflammation is partially masked by increased HDAC2 levels. A partial redundancy of HDAC1 and HDAC2 functions was observed for the control of cardiac morphogenesis (16), adipogenesis (39), neuronal development (40), cell proliferation (17), and transcription (41). Whether HDAC2 activity is also important in T cells in controlling the inflammatory response will be an important aspect of future studies. However, the HDAC inhibitor TSA attenuates allergic airway inflammation in mice by reducing T cell infiltration and Th2 cytokine production (25). In addition, inhibition of the class III HDAC sirtuin 1 leads to attenuated allergic airway inflammation (26). Thus, other TSA-sensitive and -insensitive members of the HDAC family that may be expressed in T cells, as well as in other cell types (e.g., alveolar macrophages), are involved in the pathophysiology of allergic airway inflammation.
The differentiation of CD4+ T cells into Th1 or Th2 effector cells is a complex process that is accompanied by several epigenetic changes at the Ifng and Il4 cytokine loci (3). TCR/CD28-mediated triggering of CD4+ T cells leads to a rapid increase in histone acetylation at the Ifng and Il4 cytokine loci and low-level, unbiased transcription of IL-4 and IFN-γ (30, 31). Subsequently, cytokine signaling and the activities of the transcriptional regulators T-bet and GATA-3 are required to increase and maintain lineage-specific epigenetic modification at the Ifng and Il4 loci, respectively, to allow high-level lineage-specific Th1 and Th2 cytokine expression. In parallel, histone acetylation of the lineage-inappropriate cytokine loci decreases in the presence of the polarizing cytokines, leading, together with de novo DNA methylation, to complete transcriptional silencing (3, 5). Therefore, the increase in lineage-specific cytokine expression in lung CD4+ T cells in Hdac1Δ mice and in HDAC1-deficient Th1 and Th2 cells indicates an essential role for HDAC1 in controlling cytokine-expression levels in differentiated effector T cells. Our finding is substantiated by a recent study showing a genome-wide association of HDAC1 with promoters of active genes in CD4+ T cells, suggesting that HDAC1 fine-tunes gene expression instead of keeping silent genes repressed (42). We observed increased expression of IL-4 already at day 3 in Th2-polarizing cultures. Thus, the demonstration that HDAC1 bound to the Il4 gene locus in nonactivated naive CD4+ T cells suggests a critical role for HDAC1 during the early phase of effector differentiation in restricting cytokine transcription to low levels. In support of our data, it was shown that treatment of differentiating T cells with the HDAC inhibitor butyrate resulted in increased numbers of IL-4–expressing differentiating CD4+ effector cells reminiscent of activated, differentiated HDAC1-deficient cells (20). This indicates that HDAC1 might be the major HDAC regulating the epigenetic status of the activated cytokine loci, thus ensuring appropriate levels of the respective cytokines, although we cannot rule out that HDAC1 influences cytokine expression indirectly (e.g., by changing the expression of an important transcription factor that controls the Th2 cytokine locus). Moreover, the finding of increased Th2 cytokine levels in vivo provides an explanation for the enhanced clinical parameters in the allergic airway inflammation model in conditional HDAC1-deficient mice.
In agreement with other studies (20, 32), we observed that cytokines were expressed only in those cell subsets that have undergone several rounds of cell division. This may imply that cell proliferation is required to remove other repressive epigenetic marks, such as DNA methylation, from the Th2 cytokine loci. The enhanced IL-4 production in HDAC1-deficient Th2 cells partially resembles the phenotype of T cells deficient for the methyl CpG-binding domain protein-2 (MBD2) (32) or of DNA methyltransferase 1-deficient T cells (18). MBD2 was suggested as a potential link between DNA methylation and silent chromatin (43). Further, MBD2 was shown to interact with a HDAC1 corepressor complex (44), thus also providing a potential link between DNA methylation and histone deacetylation. In contrast to HDAC1-deficient CD4+ T cells, Mbd2−/− CD4+ T cells show aberrant expression of IL-4 in activated T cells that have not yet divided, and Mbd2−/− Th1 cells produce significant amounts of IL-4 (32). Thus, despite increased levels of cytokine expression in MBD2- and HDAC1-deficient CD4+ T cells, only the loss of MBD2 triggers lineage-inappropriate cytokine expression. This suggests a functional hierarchy of HDAC1 and MBD2 in the regulation of the Th2-cytokine loci.
Taken together, our study provides genetic evidence that HDAC1 activity in T cells regulates the extent of allergic airway inflammation. Moreover, our data show that activation of the Th1 and Th2 cytokine loci is counterbalanced by HDAC1, indicating a specific role for HDAC1 in modulating the cytokine-expression program during effector differentiation. This may indicate a potential therapeutic usage of specific HDAC1 inhibitors in clinical settings that require enhanced immune responses and inflammation.
Acknowledgments
Work in the laboratory of W.E. was supported by the START program (Grant Y-163) of the Austrian Science Fund and the Austrian Ministry of Science and Research, by the Austrian Science Fund (SFB-F2305 and P19930), by the Austrian Science Fund/Medical University of Vienna doctoral program (DK W1212) “Inflammation and Immunity,” and by the Vienna Science and Technology Fund (LS09-031). Work in the laboratory of C.S. was supported by the Austrian Science Fund (P18746 and P16443) and the Genome Research in Austria project “Epigenetic Plasticity of the Mammalian Genome” (Austrian Ministry of Science and Research). Work in the laboratory of P.M. was supported by the Novartis Research Foundation. R.G. was a fellow of the Vienna Biocenter International Ph.D. program supported by the Austrian Science Fund.
Abbreviations used in this paper
- AW
airways
- BAL
bronchoalveolar lavage
- bsl
baseline
- BV
blood vessel
- CA
central airways
- ChIP
chromatin immunoprecipitation
- CL
central lung
- con
control
- DP
double-positive
- E
eosinophil
- HDAC
histone deacetylase
- HS
hypersensitivity site
- imm
immunized and diseased
- L
lymphocyte
- M
macrophage
- MBD2
methyl CpG-binding domain protein-2
- MCh
metacholine
- MU
mucus
- N
neutrophil
- nd
not done
- n.d.
not detectable
- n.s.
not significant
- PA
peripheral airways
- PL
peripheral lung
- SP
single-positive
- TS
trichostatin A
- wt
wild-type
Footnotes
Disclosures The authors have no financial conflicts of interest.
References
- 1.Kioussis D, Ellmeier W. Chromatin and CD4, CD8A and CD8B gene expression during thymic differentiation. Nat. Rev. Immunol. 2002;2:909–919. doi: 10.1038/nri952. [DOI] [PubMed] [Google Scholar]
- 2.Taniuchi I, Ellmeier W, Littman DR. The CD4/CD8 lineage choice: new insights into epigenetic regulation during T cell development. Adv. Immunol. 2004;83:55–89. doi: 10.1016/S0065-2776(04)83002-5. [DOI] [PubMed] [Google Scholar]
- 3.Ansel KM, Djuretic I, Tanasa B, Rao A. Regulation of Th2 differentiation and Il4 locus accessibility. Annu. Rev. Immunol. 2006;24:607–656. doi: 10.1146/annurev.immunol.23.021704.115821. [DOI] [PubMed] [Google Scholar]
- 4.Krangel MS. T cell development: better living through chromatin. Nat. Immunol. 2007;8:687–694. doi: 10.1038/ni1484. [DOI] [PubMed] [Google Scholar]
- 5.Wilson CB, Rowell E, Sekimata M. Epigenetic control of T-helper-cell differentiation. Nat. Rev. Immunol. 2009;9:91–105. doi: 10.1038/nri2487. [DOI] [PubMed] [Google Scholar]
- 6.Brunmeir R, Lagger S, Seiser C. Histone deacetylase HDAC1/HDAC2-controlled embryonic development and cell differentiation. Int. J. Dev. Biol. 2009;53:275–289. doi: 10.1387/ijdb.082649rb. [DOI] [PubMed] [Google Scholar]
- 7.Haberland M, Montgomery RL, Olson EN. The many roles of histone deacetylases in development and physiology: implications for disease and therapy. Nat. Rev. Genet. 2009;10:32–42. doi: 10.1038/nrg2485. [DOI] [PMC free article] [PubMed] [Google Scholar]
- 8.Moreira JM, Scheipers P, Sørensen P. The histone deacetylase inhibitor Trichostatin A modulates CD4+ T cell responses. BMC Cancer. 2003;3:30. doi: 10.1186/1471-2407-3-30. [DOI] [PMC free article] [PubMed] [Google Scholar]
- 9.Brogdon JL, Xu Y, Szabo SJ, An S, Buxton F, Cohen D, Huang Q. Histone deacetylase activities are required for innate immune cell control of Th1 but not Th2 effector cell function. Blood. 2007;109:1123–1130. doi: 10.1182/blood-2006-04-019711. [DOI] [PubMed] [Google Scholar]
- 10.Li B, Samanta A, Song X, Iacono KT, Bembas K, Tao R, Basu S, Riley JL, Hancock WW, Shen Y, et al. FOXP3 interactions with histone acetyltransferase and class II histone deacetylases are required for repression. Proc. Natl. Acad. Sci. USA. 2007;104:4571–4576. doi: 10.1073/pnas.0700298104. [DOI] [PMC free article] [PubMed] [Google Scholar]
- 11.Tao R, Hancock WW. Resistance of Foxp3+ regulatory T cells to Nur77-induced apoptosis promotes allograft survival. PLoS ONE. 2008;3:e2321. doi: 10.1371/journal.pone.0002321. [DOI] [PMC free article] [PubMed] [Google Scholar]
- 12.Cowley SM, Iritani BM, Mendrysa SM, Xu T, Cheng PF, Yada J, Liggitt HD, Eisenman RN. The mSin3A chromatin-modifying complex is essential for embryogenesis and T-cell development. Mol. Cell. Biol. 2005;25:6990–7004. doi: 10.1128/MCB.25.16.6990-7004.2005. [DOI] [PMC free article] [PubMed] [Google Scholar]
- 13.Koipally J, Renold A, Kim J, Georgopoulos K. Repression by Ikaros and Aiolos is mediated through histone deacetylase complexes. EMBO J. 1999;18:3090–3100. doi: 10.1093/emboj/18.11.3090. [DOI] [PMC free article] [PubMed] [Google Scholar]
- 14.Bartl S, Taplick J, Lagger G, Khier H, Kuchler K, Seiser C. Identification of mouse histone deacetylase 1 as a growth factor-inducible gene. Mol. Cell. Biol. 1997;17:5033–5043. doi: 10.1128/mcb.17.9.5033. [DOI] [PMC free article] [PubMed] [Google Scholar]
- 15.Lagger G, O’Carroll D, Rembold M, Khier H, Tischler J, Weitzer G, Schuettengruber B, Hauser C, Brunmeir R, Jenuwein T, Seiser C. Essential function of histone deacetylase 1 in proliferation control and CDK inhibitor repression. EMBO J. 2002;21:2672–2681. doi: 10.1093/emboj/21.11.2672. [DOI] [PMC free article] [PubMed] [Google Scholar]
- 16.Montgomery RL, Davis CA, Potthoff MJ, Haberland M, Fielitz J, Qi X, Hill JA, Richardson JA, Olson EN. Histone deacetylases 1 and 2 redundantly regulate cardiac morphogenesis, growth, and contractility. Genes Dev. 2007;21:1790–1802. doi: 10.1101/gad.1563807. [DOI] [PMC free article] [PubMed] [Google Scholar]
- 17.Yamaguchi T, Cubizolles F, Zhang Y, Reichert N, Kohler H, Seiser C, Matthias P. Histone deacetylases 1 and 2 act in concert to promote the G1- to-S progression. Genes Dev. 2010;24:455–469. doi: 10.1101/gad.552310. [DOI] [PMC free article] [PubMed] [Google Scholar]
- 18.Lee PP, Fitzpatrick DR, Beard C, Jessup HK, Lehar S, Makar KW, Pérez-Melgosa M, Sweetser MT, Schlissel MS, Nguyen S, et al. A critical role for Dnmt1 and DNA methylation in T cell development, function, and survival. Immunity. 2001;15:763–774. doi: 10.1016/s1074-7613(01)00227-8. [DOI] [PubMed] [Google Scholar]
- 19.Raberger J, Boucheron N, Sakaguchi S, Penninger JM, Ellmeier W. Impaired T-cell development in the absence of Vav1 and Itk. Eur. J. Immunol. 2008;38:3530–3542. doi: 10.1002/eji.200838388. [DOI] [PubMed] [Google Scholar]
- 20.Bird JJ, Brown DR, Mullen AC, Moskowitz NH, Mahowald MA, Sider JR, Gajewski TF, Wang CR, Reiner SL. Helper T cell differentiation is controlled by the cell cycle. Immunity. 1998;9:229–237. doi: 10.1016/s1074-7613(00)80605-6. [DOI] [PubMed] [Google Scholar]
- 21.Hauser C, Schuettengruber B, Bartl S, Lagger G, Seiser C. Activation of the mouse histone deacetylase 1 gene by cooperative histone phosphorylation and acetylation. Mol. Cell. Biol. 2002;22:7820–7830. doi: 10.1128/MCB.22.22.7820-7830.2002. [DOI] [PMC free article] [PubMed] [Google Scholar]
- 22.Wolfer A, Bakker T, Wilson A, Nicolas M, Ioannidis V, Littman DR, Lee PP, Wilson CB, Held W, MacDonald HR, Radtke F. Inactivation of Notch 1 in immature thymocytes does not perturb CD4 or CD8T cell development. Nat. Immunol. 2001;2:235–241. doi: 10.1038/85294. [DOI] [PubMed] [Google Scholar]
- 23.Adcock IM, Tsaprouni L, Bhavsar P, Ito K. Epigenetic regulation of airway inflammation. Curr. Opin. Immunol. 2007;19:694–700. doi: 10.1016/j.coi.2007.07.016. [DOI] [PubMed] [Google Scholar]
- 24.Bhavsar P, Ahmad T, Adcock IM. The role of histone deacetylases in asthma and allergic diseases. J. Allergy Clin. Immunol. 2008;121:580–584. doi: 10.1016/j.jaci.2007.12.1156. [DOI] [PubMed] [Google Scholar]
- 25.Choi JH, Oh SW, Kang MS, Kwon HJ, Oh GT, Kim DY. Trichostatin A attenuates airway inflammation in mouse asthma model. Clin. Exp. Allergy. 2005;35:89–96. doi: 10.1111/j.1365-2222.2004.02006.x. [DOI] [PubMed] [Google Scholar]
- 26.Kim SR, Lee KS, Park SJ, Min KH, Choe YH, Moon H, Yoo WH, Chae HJ, Han MK, Lee YC. Involvement of sirtuin 1 in airway inflammation and hyperresponsiveness of allergic airway disease. J. Allergy Clin. Immunol. 2010;125:449–460. doi: 10.1016/j.jaci.2009.08.009. [DOI] [PubMed] [Google Scholar]
- 27.Epstein MM. Targeting memory Th2 cells for the treatment of allergic asthma. Pharmacol. Ther. 2006;109:107–136. doi: 10.1016/j.pharmthera.2005.06.006. [DOI] [PubMed] [Google Scholar]
- 28.Jungsuwadee P, Dekan G, Stingl G, Epstein MM. Recurrent aerosol antigen exposure induces distinct patterns of experimental allergic asthma in mice. Clin. Immunol. 2002;102:145–153. doi: 10.1006/clim.2001.5157. [DOI] [PubMed] [Google Scholar]
- 29.Finkelman FD, Hogan SP, Hershey GK, Rothenberg ME, Wills-Karp M. Importance of cytokines in murine allergic airway disease and human asthma. J. Immunol. 2010;184:1663–1674. doi: 10.4049/jimmunol.0902185. [DOI] [PMC free article] [PubMed] [Google Scholar]
- 30.Avni O, Lee D, Macian F, Szabo SJ, Glimcher LH, Rao A. T(H) cell differentiation is accompanied by dynamic changes in histone acetylation of cytokine genes. Nat. Immunol. 2002;3:643–651. doi: 10.1038/ni808. [DOI] [PubMed] [Google Scholar]
- 31.Fields PE, Kim ST, Flavell RA. Cutting edge: changes in histone acetylation at the IL-4 and IFN-gamma loci accompany Th1/Th2 differentiation. J. Immunol. 2002;169:647–650. doi: 10.4049/jimmunol.169.2.647. [DOI] [PubMed] [Google Scholar]
- 32.Hutchins AS, Mullen AC, Lee HW, Sykes KJ, High FA, Hendrich BD, Bird AP, Reiner SL. Gene silencing quantitatively controls the function of a developmental trans-activator. Mol. Cell. 2002;10:81–91. doi: 10.1016/s1097-2765(02)00564-6. [DOI] [PubMed] [Google Scholar]
- 33.Agarwal S, Rao A. Modulation of chromatin structure regulates cytokine gene expression during T cell differentiation. Immunity. 1998;9:765–775. doi: 10.1016/s1074-7613(00)80642-1. [DOI] [PubMed] [Google Scholar]
- 34.Takemoto N, Koyano-Nakagawa N, Yokota T, Arai N, Miyatake S, Arai K. Th2-specific DNase I-hypersensitive sites in the murine IL-13 and IL-4 intergenic region. Int. Immunol. 1998;10:1981–1985. doi: 10.1093/intimm/10.12.1981. [DOI] [PubMed] [Google Scholar]
- 35.Ito K, Ito M, Elliott WM, Cosio B, Caramori G, Kon OM, Barczyk A, Hayashi S, Adcock IM, Hogg JC, Barnes PJ. Decreased histone deacetylase activity in chronic obstructive pulmonary disease. N. Engl. J. Med. 2005;352:1967–1976. doi: 10.1056/NEJMoa041892. [DOI] [PubMed] [Google Scholar]
- 36.Ito K, Caramori G, Lim S, Oates T, Chung KF, Barnes PJ, Adcock IM. Expression and activity of histone deacetylases in human asthmatic airways. Am. J. Respir. Crit. Care Med. 2002;166:392–396. doi: 10.1164/rccm.2110060. [DOI] [PubMed] [Google Scholar]
- 37.Barnes PJ, Adcock IM. Glucocorticoid resistance in inflammatory diseases. Lancet. 2009;373:1905–1917. doi: 10.1016/S0140-6736(09)60326-3. [DOI] [PubMed] [Google Scholar]
- 38.Ito K, Lim S, Caramori G, Cosio B, Chung KF, Adcock IM, Barnes PJ. A molecular mechanism of action of theophylline: Induction of histone deacetylase activity to decrease inflammatory gene expression. Proc. Natl. Acad. Sci. USA. 2002;99:8921–8926. doi: 10.1073/pnas.132556899. [DOI] [PMC free article] [PubMed] [Google Scholar]
- 39.Haberland M, Carrer M, Mokalled MH, Montgomery RL, Olson EN. Redundant control of adipogenesis by histone deacetylases 1 and 2. J. Biol. Chem. 2010;285:14663–14670. doi: 10.1074/jbc.M109.081679. [DOI] [PMC free article] [PubMed] [Google Scholar]
- 40.Montgomery RL, Hsieh J, Barbosa AC, Richardson JA, Olson EN. Histone deacetylases 1 and 2 control the progression of neural precursors to neurons during brain development. Proc. Natl. Acad. Sci. USA. 2009;106:7876–7881. doi: 10.1073/pnas.0902750106. [DOI] [PMC free article] [PubMed] [Google Scholar]
- 41.Zupkovitz G, Tischler J, Posch M, Sadzak I, Ramsauer K, Egger G, Grausenburger R, Schweifer N, Chiocca S, Decker T, Seiser C. Negative and positive regulation of gene expression by mouse histone deacetylase 1. Mol. Cell. Biol. 2006;26:7913–7928. doi: 10.1128/MCB.01220-06. [DOI] [PMC free article] [PubMed] [Google Scholar]
- 42.Wang Z, Zang C, Cui K, Schones DE, Barski A, Peng W, Zhao K. Genome-wide mapping of HATs and HDACs reveals distinct functions in active and inactive genes. Cell. 2009;138:1019–1031. doi: 10.1016/j.cell.2009.06.049. [DOI] [PMC free article] [PubMed] [Google Scholar]
- 43.Hendrich B, Guy J, Ramsahoye B, Wilson VA, Bird A. Closely related proteins MBD2 and MBD3 play distinctive but interacting roles in mouse development. Genes Dev. 2001;15:710–723. doi: 10.1101/gad.194101. [DOI] [PMC free article] [PubMed] [Google Scholar]
- 44.Ng HH, Zhang Y, Hendrich B, Johnson CA, Turner BM, Erdjument-Bromage H, Tempst P, Reinberg D, Bird A. MBD2 is a transcriptional repressor belonging to the MeCP1 histone deacetylase complex. Nat. Genet. 1999;23:58–61. doi: 10.1038/12659. [DOI] [PubMed] [Google Scholar]
- 45.Koyanagi M, Baguet A, Martens J, Margueron R, Jenuwein T, Bix M. EZH2 and histone 3 trimethyl lysine 27 associated with Il4 and Il13 gene silencing in Th1 cells. J. Biol. Chem. 2005;280:31470–31477. doi: 10.1074/jbc.M504766200. [DOI] [PubMed] [Google Scholar]