

Abstract
Neuronal oxidative phosphorylation (OXPHOS) deficiency has been associated with a variety of neurodegenerative diseases, including Parkinson's disease and Huntington's disease. However, it is not clear how mitochondrial dysfunction alone can lead to a preferential elimination of certain neuronal populations in vivo. We compared different types of neuronal populations undergoing the same OXPHOS deficiency to determine their relative susceptibility and mechanisms responsible for selective neuron vulnerability.
We used a mouse model expressing a mitochondria-targeted restriction enzyme, PstI or mito-PstI. The expression of mito-PstI induces double-strand breaks in the mitochondrial DNA (mtDNA), leading to OXPHOS deficiency, mostly due to mtDNA depletion. We targeted mito-PstI expression to the cortex, hippocampus, and striatum under the CaMKII-α promoter. Animals undergoing long-term expression of mito-PstI displayed a selective worsening of the striatum over cortical and hippocampal areas. Mito-PstI expression and mtDNA depletion were not worse in the striatum, but the latter showed the most severe defects in mitochondrial membrane potential, response to calcium, and survival.
These results showed that the striatum is particularly sensitive to defects in OXPHOS possibly due to an increased reliance on OXPHOS function in this area and differences in response to physiological stimuli. These results may help explain the neuropathological features associated with Huntington's disease, which have been associated with OXPHOS defects.
Introduction
Neurodegenerative diseases encompass an age-related regional and selective loss of specific neural cell populations that causes behavioral and mental decline depending on the extent and location of the cells that were lost. Mitochondrial dysfunction has now been closely associated with neurodegenerative diseases and neurodegenerative events (Schon and Manfredi, 2003; Lin and Beal, 2006; Mattson et al., 2008; Pickrell and Moraes, 2010).
These particular insults to the mitochondria have stemmed from different causes, including mutations in huntingtin protein, mitochondrial toxins, and stroke, causing oxygen/glucose deprivation. Huntington's disease preferentially targets medium spiny, striatal neurons, affecting mitochondria by inhibiting various oxidative phosphorylation (OXPHOS) complexes, stalling mitochondrial dynamics, and downregulating peroxisome proliferator-activated receptor γ coactivator 1-α (PGC-1α), a mitochondrial biogenesis transcription controller (Cui et al., 2006; Fukui and Moraes, 2007; Orr et al., 2008; Wang et al., 2009). Exposure to mitochondrial toxins that inhibit complexes I and II, such as rotenone and 3-nitropropionic acid, respectively, causes degeneration of the striatum (Guyot et al., 1997; Betarbet et al., 2000). Finally, middle cerebral artery and focal ischemia models also report a sensitivity of the striatum due to mitochondrial membrane potential alterations and decreased availability for energy sources in these experimental paradigms (Berthet et al., 2009; Lee et al., 2009).
In this study, we investigated region-specific susceptibilities to a neuronal OXPHOS deficiency and explored possible mechanisms for this preferential sensitivity in vivo. We used a transgenic mouse model expressing low steady-state protein levels of PstI endonuclease targeted to the mtDNA, mito-PstI. Mito-PstI causes double-strand breaks in the mtDNA, depleting the levels of mtDNA over time. This results in a chronic OXPHOS deficiency by reducing the availability of mtDNA encoded subunits. We report here that mice with this neuron-specific mtDNA depletion undergo severe striatal degeneration due to regionally distinct mitochondrial properties.
Materials and Methods
Animals.
The generation of Mito-PstI transgenic mice has been previously described (Fukui and Moraes, 2009). In brief, a mammalianized version of the bacterial PstI gene was positioned behind a 5′ mitochondrial targeting sequence from human COX VIII (cytochrome c oxidase subunit VIII). The intervening sequence 8 (IVS8) was introduced between the tetracycline response element (TRE) promoter sequence and the mito-PstI coding sequence. Mice were crossed with C57BL/6J mice for colony maintenance. The nuclear background was mostly C57BL/6J (F4) for male animals used for behavioral testing, containing smaller genetic contributions from SJLF1 and CBA. Male animals for biochemical analysis were pure C57BL/6J mito-PstI (F10) animals crossed with CaMKIIα-tTA animals of the same background (The Jackson Laboratory).
All mice procedures were performed according to a protocol approved by the University of Miami Institutional Animal Care and Use Committee. Mice were housed in a virus-antigen-free facility at the University of Miami: Division of Veterinary Resources in a 12 h light/dark cycle at room temperature and fed ad libitum with a standard rodent diet.
Western blotting.
Protein extracts were prepared from the cortical, hippocampal, striatal, and cerebellar neuroanatomical regions that were homogenized with a hand-held rotor (VWR) in PBS containing a protease inhibitor mixture (Roche). Samples were then snap frozen in liquid nitrogen and stored in −80°C until used. Upon use, SDS was added to the homogenate at the final concentration of 4%. Homogenates were then centrifuged at 14,000 × g and the supernatant was collected for analysis. Proteins were quantified using Dc Protein Assay kit using Lowry HS methodology (Bio-Rad). Proteins were run on either a 12% SDS-acrylamide gel or 4–20% SDS-polyacrylamide gradient gel (Bio-Rad) depending on the predicted molecular weight. The gel was blotted on polyvinylidene fluoride membrane (Bio-Rad) or nitrocellulose (Bio-Rad).
Membranes were blocked in 1:1 Odyssey blocking solution (LI-COR Biosciences) for 1 h at room temperature. Primary antibodies used were anti-PstI 1:1000 dilution (generated from our own laboratory), OXPHOS rodent mixture 1:1000 (Mitosciences), α-tubulin 1: 2000 (Sigma), β-III tubulin 1:1000 (AbCam), glial fibrillary acidic protein (GFAP) 1:1000 (Cell Signaling Technology), SDHA 1:1000 (Mitosciences), and actin 1:5000 (Sigma). Primary antibody was incubated overnight at 4°C. Secondary antibodies used were infrared-conjugated antibodies anti-rabbit-700/anti-mouse-800 (Rockland) at 1:3000 to 1:5000 concentrations. Secondary antibodies were incubated for 1 h at room temperature. Blots with infrared secondary antibodies were visualized with Odyssey Infrared Imaging System (LI-COR Biosciences). Optical density measurements were taken by default software supplied by LI-COR on blots.
mRNA isolation and reverse transcriptase PCR.
Animals were deeply anesthetized using isoflurane, killed by cervical dislocation, and brains were quickly isolated. The isolated brains were further dissected into the cerebral cortex, hippocampus, striatum, and cerebellum, and were submerged in RNAlater (Ambion). Tissues were homogenized with a hand-held rotor homogenizer (VWR), and homogenates were run through QiaShredder columns (Qiagen). RNA was extracted from lysates using RNeasy Plus Mini Kit (Qiagen). We used 500 ng to 1 μg of RNA for a reverse-transcription reaction using the Superscript III kit (Invitrogen).
Isolation of mitochondria.
Mitochondria was isolated as previously described (Kirkinezos et al., 2005) with small modifications. Anesthetized animals were killed immediately and regionally dissected brain regions were homogenized in a Dounce glass homogenizer (8–10 strokes) in SEE buffer (250 mm sucrose, 10 mm HEPES, pH 7.4, 0.5 mm EDTA, pH 7.4, and 0.5 mm EGTA) with the addition of 50 mg/ml bovine serum albumin (BSA) and protease inhibitor mixture (Roche) before use. The homogenate was spun on a Sorvall Superspeed RC2-B centrifuge at 4°C at 2000 × g for 5 min. The supernatant was removed and spun at 12,000 × g for 8 min. The pellet was resuspended in SEE buffer and respun. A final spin of the resuspended pellet was performed in 250 mm sucrose. The final pellet was resuspended in mitochondria incubation buffer, pH 7.2 (130 mm KCl, 2 mm KH2PO4, 2 mm MgCl2, 10 mm HEPES, and 1 mm EDTA). Proteins in the final suspension were measured using the Bradford methodology with a BSA standard curve using Bio-Rad Protein Assay dye (Bio-Rad).
TMRE flow cytometry.
Thirty micrograms of mitochondria isolated by the above-mentioned procedure was aliquoted and spun at 15,000 × g on a bench-top centrifuge (Eppendorf 5424). The supernatant was removed, and the pellet resuspended in 75 nm tetramethylrhodamine, ethyl ester, perchlorate (TMRE, nonquenching mode) dye diluted in modified Ringer's media with the addition of 250 mm sucrose. Freshly prepared 20 mm glutamic acid and 4 mm malic acid were added to the reaction and incubated for 10 min at 37°C in the dark. In some experimental groups, 2 μm CCCP or 0.3 μmol of Ca2+ per milligram of protein were also added to the final reaction. The supernatant was aspirated after centrifugation, and the pellet resuspended in 7.5 nm TMRE dye diluted and prepared as stated above. Ten thousand events for each sample were read at absorbance/emissions = 488/560 nm on LSR Fortessa (BD Biosciences). All samples were treated with CCCP to determine the values of a complete loss of membrane potential.
Spectrophotometer assays.
OXPHOS assays have been previously described (Barrientos, 2002). In summary, homogenates from cortex, hippocampus, striatum, and cerebellum were prepared using a hand-held rotor to homogenize tissue in PBS plus protease inhibitor mixture (Roche) on ice. Cytochrome c (2 mm) reduced with sodium dithionite was added to homogenates in a buffer (10 mm KH2PO4, 1 mg/ml BSA, and 120 mm lauryl maltoside). Samples were read at 550–580 nm with the slope reading taken for 2 min at 37°C. Potassium cyanide (240 μm) was used to inhibit the reaction to ensure slope was specific to COX. Readings were normalized by protein concentration determined by Bradford methodology.
Homogenates for citrate synthase were added to a buffer [50 mm Tris-HCl, pH 7.5, 20 mm acetyl CoA, 10 mm 5,5′-dithiobis (2-nitrobenzoic acid), and 0.2% Triton X-100] and performed at 412 nm with 50 mm oxaloacetate to start the reaction. Readings were obtained for 5 min at 30°C. Normalization was again to protein concentration.
Real-time PCR.
Maxima SYBR Green/ROX qPCR Master Mix (Fermentas) was used according to the manufacturer's directions to perform real-time PCR. Primers used for the cDNA quantification were as follows: PGC-1α (5′-CTGCGGGATGATGGAGACA, 5′-AGCAGCGAAAGCGTCACA), PGC-1β (5′-TGGCCCAGATACACTGACTATG, 5′-TGGGCCTCTTTCAGTAAGCT), and β-actin (5′-TGACAGGATGCAGAAGGAGAT, 5′-GCGCTCAGGAGGAGCAAT). The following primer pairs were used for the quantification of mtDNA copy number in total DNA (extracted with phenol: chloroform): ND1 (5′-CAGCCTGACCCATAGCCATA, 5′-ATTCTCCTTCTGTCAGGTCGAA), and GAPDH (5′-GCAGTGGCAAAGTGGAGATT, 5′-GAATTTGCCGTGAGTGGAGT). Comparative Ct method was used to determine the relative abundance of mtDNA or genes of interest (Schmittgen and Livak, 2008).
In situ COX activity histochemistry.
Mice were transcardially perfused with ice-cold PBS, pH 7.4, containing 4% paraformaldehyde and 4% sucrose. Brains were quickly isolated and submerged in 4% paraformaldehyde at 4°C for 1 h and then cryoprotected by increasing concentrations of sucrose solutions (10%, 20%, and then 30%) prepared in PBS. The cryoprotected brains were positioned in a plastic block (Polysciences), submerged in the OCT compound solution (TissueTek) diluted with an equal volume of 25% sucrose, and quickly frozen by submerging the plastic block into 2-methylbutane cooled in liquid nitrogen. Twenty-micrometer-thick sections were cut on a cryostat and warmed.
For neuroanatomical evaluation of brains, sections were stained with cresyl violet solution (0.1%) for 3 min, dehydrated with increasing concentrations of ethanol, and cleared with xylenes before mounting with Sub-X mounting medium (Surgipath). Images were captured with an Olympus Bx51 microscope at 4× or 60× magnification.
COX histochemistry was performed using 0.05% 3,3′-diaminobenzidine (DAB), 0.02% cytochrome c, and 4% sucrose for 3 h in the dark at 37°C. After incubation, sections were washed with deionized water, dehydrated, cleared with xylenes, mounted, and imaged as described above.
RotaRod.
Motor coordination was evaluated with the RotaRod equipment (IITC Life Sciences) designed for mice. Animals were tested on a monthly basis with four runs on a given day with two runs for practice. The final two runs were recorded and combined to find the average latency to fall. A resting period of 45 min between each run was given. Animals were required to position limbs to stay on a rotating rod accelerating from 6 to 20 rpm over a 300 s time period. Mice that had completed the task received a final latency time of 300 s.
Radial six-arm water maze.
The spatial memory behavioral test modified for mice has been previously described (Rodenas-Ruano et al., 2006). Male animals were trained and tested over a 1 week period. The hidden platform remained stationary in one arm for the duration of the test. The starting arm releasing the animal was randomized. A 60 s maximum time allotment was given for animals to locate and swim to the platform. Mice who failed to find the platform were directed to it after the 60 s. A 30 s rest was given before the animal was again randomly placed in another arm. Data collection for wrong corridor selection and latency to reach the platform occurred on the fourth and fifth test days.
Magnetic resonance imaging.
MRI data were obtained at the 4.7 Tesla Animal MRI Research Facilities at the Miller School of Medicine of the University of Miami.
Statistical analysis for behavior.
Mito-PstI mice (PstI+/tTA+, n = 9) and their control counterparts (PstI+/tTA−, n = 11) were weighed every 2 weeks and subjected to behavioral characterization. The comparison of weight data was performed using one-way ANOVA. Data from spatial memory and motor coordination tasks were analyzed using a two-tailed, unpaired Student's t test. Differences were considered significant when p < 0.05.
Results
Characterization of neuronal expression of mito-PstI in transgenic mice
Mito-PstI mice had the expression of mito-PstI regulated by a minimal promoter containing a TRE (Fukui and Moraes, 2009). We mated these Mito-PstI+ transgenic mice with mice expressing tetracycline transactivator (tTA) protein under the control of CaMKIIα promoter (tTA+ mice). Subsequent matings produced male animals that were positive for both alleles (mito-PstI+/tTA+) (Fig. 1A). For simplicity, we refer to these double transgenic mice as “Mito-PstI mice.” In this tet-off system, in the absence of doxycycline, tTA protein expressed under the CamKIIα promoter binds to TRE and induces the expression of mito-PstI. Male siblings, which are positive for either allele (mito-PstI+/tTA− or mito-PstI-/tTA+), do not express mito-PstI protein and therefore were used as controls. The transgenic line used in this study (line 5752) differed from the line described in our previous report (line 5751); Although the mito-PstI was expressed in the same region-specific manner in both lines, line 5752 expresses ∼15-fold lower levels of mito-PstI protein than line 5751 (Fukui and Moraes, 2009). Animals (tet-off) were continuously induced from birth and kept on the standard rodent diet. The PstI restriction sites on the mtDNA reside at nucleotide positions 8420 and 12,238 (Fig. 1B).
Figure 1.
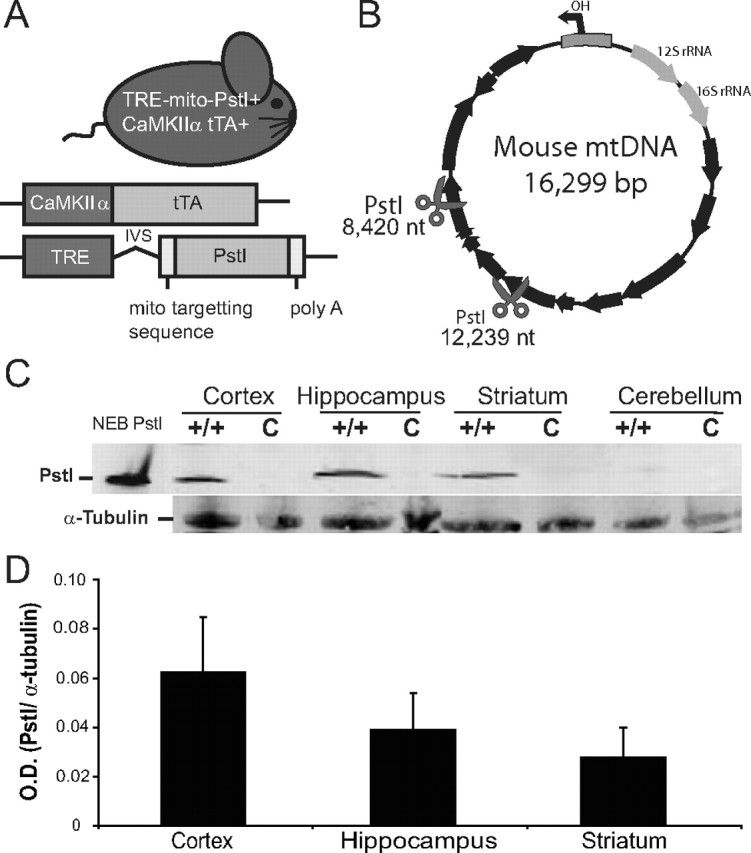
Mito-PstI mouse expresses mitochondrial-targeted restriction endonuclease in the CNS. A, Schematic representation of the experimental mito-PstI mouse and the transgenic constructs it harbors. B, Representative mtDNA map showing the targeted sites of PstI at 8420 and 12,239 nt (scissors). Black arrows denote protein-coding genes. C, Western blots of brain lysates using antibodies probing for mito-PstI protein expressed in four regions of the CNS (cortex, hippocampus, striatum, and cerebellum) of 2-month-old mito-PstI (+/+) or control (c) animals. α-Tubulin immunoreactivity was used to ensure equal protein loading. D, Quantification of the optical density (O.D.) of immunoblotted PstI protein levels from mito-PstI mice. Results are normalized against α-tubulin immunoreactivity. Values are mean ± SEM (n = 3, NS).
Before comparing differences in regional vulnerability in the Mito-PstI model, we determined whether there was a regional difference in the expression of mito-PstI protein. Using Western blot analysis, we detected mito-PstI protein in the cortex, hippocampus, and striatum but very little in the cerebellum (Fig. 1C). Expression was absent in controls. We also observed no significant differences in the steady-state levels of mito-PstI when quantified and compared across regions (Fig. 1D).
Expression of mito-PstI in forebrain neurons leads to a progressive neurodegenerative phenotype
At birth, animals from all genotypes appeared normal and litters showed expected Mendelian ratios. Mito-PstI animals began showing slower weight gain at 2 months with an obvious smaller appearance at 10–14 months as compared to control animals (Fig. 2A). There were no differences in lifespan up to 16 months of age. At 16 months, the remaining Mito-PstI and controls of this group were killed for biochemical analysis.
Figure 2.
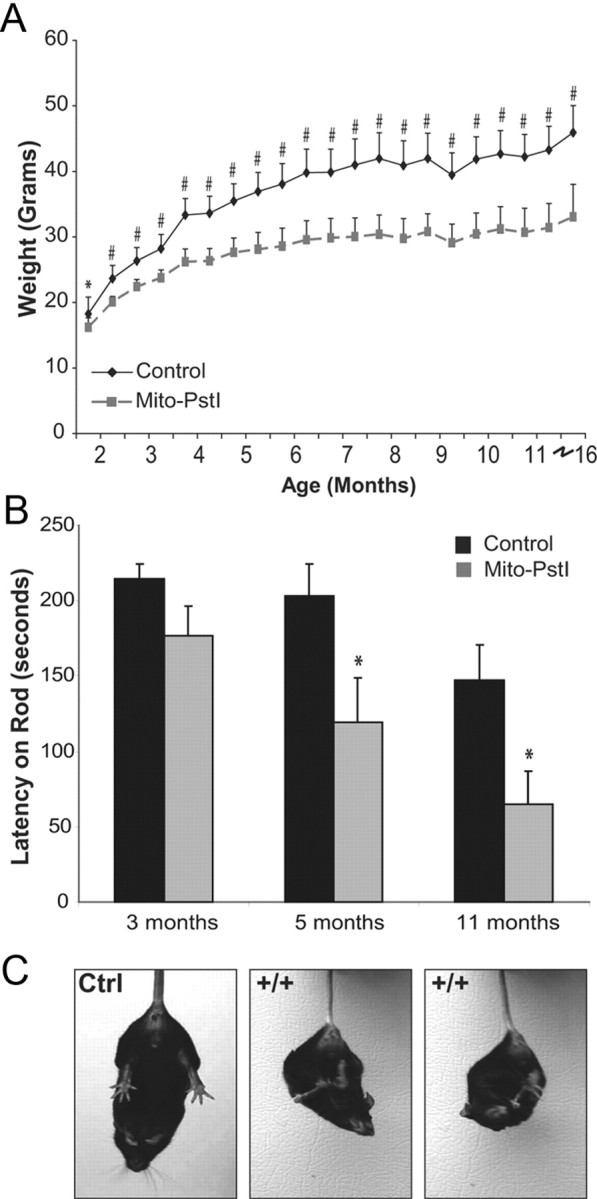
Mito-PstI mice displayed abnormal motor behaviors indicative of a progressive neurodegenerative pathology. A, Mito-PstI mice had significantly less body weight than controls. By the end of the study, Mito-PstI animals were approximately half the weight of controls. B, RotaRod behavioral testing revealed that Mito-PstI mice showed deficits on the ability to coordinate movement and balance on a rotating rod. Mito-PstI mice had shorter latency times when tested as compared to controls at 5 and 11 month time points. C, Mito-PstI mice display an abnormal clasping phenotype during a gravitational tail hang. Controls showed a proper limb extension behavior for escape. Phenotype appears at ∼6–7 months of age and persists for the rest of life. Values are mean ± SEM (control n = 11, mito-PstI = 9, *p < 0.05, #p < 0.001).
Mito-PstI mice presented no overt phenotypic abnormalities until 6–8 months. At this time, Mito-PstI animals displayed an abnormal limb-clasping phenotype during a gravitational tail hang (Fig. 2C). Control animals displayed a normal escape response when hung upside down, in which the limbs were extended outwards for protection from threat of a fall. Although the neural basis of this abnormal phenotype has not been elucidated, it has been reported in other mouse models that exhibit striatal degeneration (Hara et al., 2006; Komatsu et al., 2006).
Due to this limb-clasping phenotype, we tested Mito-PstI mice at 3, 5, and 11 months of age for their ability to coordinate limb positioning on the RotaRod. Mito-PstI and control mice performed with equal abilities at the 3 month time point; however, Mito-PstI animals performed progressively worse in their ability to stay on the rotating rod at the 5 and 11 month time points (Fig. 2B). These findings of restricted weight gain, abnormal clasping, and poor motor skill performance suggested that Mito-PstI animals had a progressive age-related neurodegeneration of the locomotive centers of the brain.
Because mito-PstI expression was also observed in the hippocampus, we tested 14-month-old Mito-PstI mice for their spatial memory and learning abilities in a radial water maze paradigm. Mice expressing mito-PstI performed poorly when compared to age-matched controls. The time to find the hidden platform was approximately four times longer for the Mito-PstI mice, and Mito-PstI mice committed significantly more errors in choosing the correct arm (p < 0.001, not shown).
Mito-PstI expression causes massive neurodegeneration of the striatum and cortical atrophy
These behavioral phenotypes suggested the Mito-PstI mice had progressive neurodegenerative events occurring in the CNS, most prominently affecting neuroanatomical regions that control movement.
We began analysis at 2 months of age, before the motor phenotypes. There appeared to be no disturbances in the cortex and hippocampus at this time point. Brains from young (2-month-old) Mito-PstI animals had normal gross morphology and neuroanatomy of these areas; however, in sagittal sections, striatal tissue appeared less dense (Fig. 3A).
Figure 3.
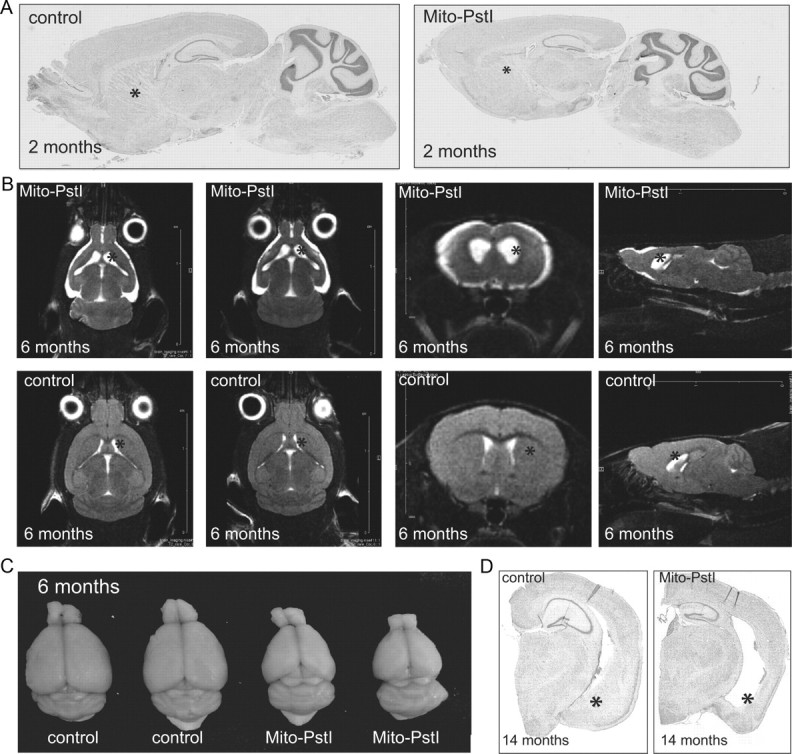
Mito-PstI mice have an age-related neurodegeneration with a preferential degeneration of the striatum. A, Parasagittal Nissl-stained histological sections of 2-month-old animals. B, Nuclear magnetic resonance imaging of 6- to 7-month-old control and mito-PstI mice in vivo reveal ongoing degeneration with ablation of the striatum with cortical atrophy. The striatum is denoted by asterisks. White areas represent CSF (n = 2/group). C, Gross morphology reveals abnormal brain size and appearance of mito-PstI animals as compared to control at 6–7 months of age. Control brain weight was ∼0.42–0.45 g, and mito-PstI weight was ∼0.27–0.30 g. D, Nissl staining of coronal sections reveals that, at 14 months of age, degeneration in the mito-PstI occurs in the ventral aspects of the striatum (denoted by asterisks), which is absent in controls.
We then analyzed various phenotypes from the time when the limb-clasping phenotype was first observed. To better determine the general brain morphology in vivo during this degenerative process, Mito-PstI and control animals underwent MRI imaging at 6–8 months of age. Scans revealed that Mito-PstI animals' striatum had atrophied and to a lesser extent also the cortex that were replaced by fluid, likely CSF (Fig. 3B). The widening of the lateral ventricles completely replaced areas of the dorsal striatum and ablated the shape of the striatum in ventral aspects. These CNS changes appeared even less severe in the hippocampus at this time point (Fig. 3B). Gross brain anatomy was altered with a visible atrophy of the cortex and decrease in brain weight and size (Fig. 3C).
This degeneration proved to be progressive, as it worsened in Mito-PstI animals killed at 14 months of age. Histological analysis with cresyl violet revealed that Mito-PstI brains at both of these age groups had shrinkage of the cortical layer and hippocampus and complete absence of the ventral striatum/amygdala region (Fig. 3D). As previously mentioned, the dorsal striatum was completely absent. These results confirmed the suspected progressive neurodegeneration of the regions expressing mito-PstI. They also revealed that the striatum was more severely affected than other brain regions and was disrupted earlier in this neuronal OXPHOS-deficiency model.
Mito-PstI expression causes a depletion of mtDNA leading to an OXPHOS deficiency
The expression of mito-PstI leads to double-strand breaks in the mtDNA, disrupting the synthesis of mtDNA-encoded proteins for OXPHOS (Srivastava and Moraes, 2005; Fukui and Moraes, 2009). To measure the extent of mtDNA depletion in the different neuroanatomical regions, we tested animals at 2 months of age, before the neurodegeneration became too severe to adequately assess mito-PstI-induced changes in the striatum. We observed a significant ∼30% depletion of mtDNA in the cerebral cortex and an ∼40% decrease in the hippocampus and striatum in Mito-PstI mice at this age (Fig. 4A). There were no significant changes in the levels of mtDNA in the cerebellum of Mito-PstI mice.
Figure 4.
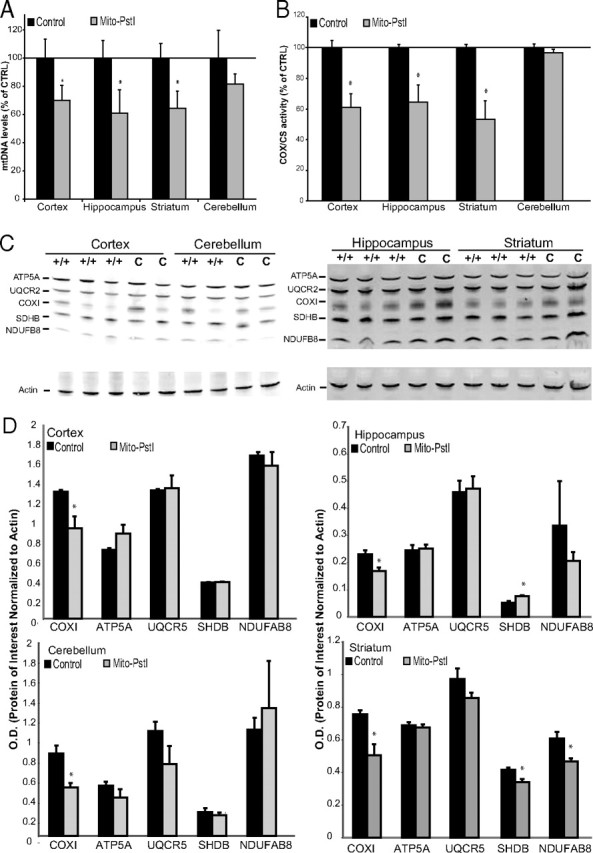
Mito-PstI expression causes an mtDNA depletion that leads to an OXPHOS deficiency. A, Real-time PCR measuring the levels of mtDNA against the nuclear gene GAPDH. Isolated DNA was extracted from cortex, hippocampus, striatum, and cerebellum from 2-month-old control and Mito-PstI animals and used as the template. Values are mean ± SEM (n = 4–5/group, *p < 0.05). Each sample was run in triplicate. B, Ratios of enzymatic COX activity to CS activity comparing control and Mito-PstI animals in different CNS regions at 2 months of age. Values are mean ± SEM (n = 4–5/group, *p < 0.05). Results are shown as a percentage of the control. C, Representative Western blot analyses showing OXPHOS protein subunits from cortical, hippocampal, cerebellar, and striatal lysates [Complex V ATPase subunit α (ATP5A), Complex III Core 2 (UQCR2), Complex IV (COXI), Complex II subunit 30 kDa (SDHB), and Complex I (NDUFB8)] between 2 month control (C) and Mito-PstI (+/+) animals (n = 2–3/group). Actin immunoreactivity was used as a control to ensure equal protein loading. D, Optical density measurements of the protein of interest normalized to the signal from actin between 2 month control and Mito-PstI animals (n = 3/group). *p < 0.05.
To determine the impact that this mtDNA depletion on OXPHOS function, we performed spectrophotometric enzymatic assays assessing the activity of cytochrome c oxidase (COX) (also called complex IV). MtDNA encodes three subunits of COX (Anderson et al., 1981). Therefore, we reasoned that the activity of this enzyme complex would be affected due to the reduction of mtDNA. Citrate synthase (CS) is an enzyme in the citric acid cycle, and its activity is not reduced by a reduction in OXPHOS. Therefore, the activity of this enzyme is related to the amount of mitochondria in each homogenate preparation and COX/CS can give a better estimate of COX activity per mitochondrial mass (Wiegand and Remington, 1986). At 2 months, there was a 40% decrease in the COX/CS ratio in the cortex and hippocampus and a 50% decrease in the striatum of Mito-PstI mice compared to controls (Fig. 4B). In situ COX enzymatic activities showed a defect in cerebral cortex, hippocampus, and striatum, confirming spectrophotometer results (data not shown).
We performed Western blots to determine the steady-state levels of representative subunits of the different OXPHOS complexes. In the striatum, we detected significant decreases in protein levels for subunits of complexes I, II, and IV (Fig. 4C,D). Decreases in COXI, a subunit of complex IV coded by mtDNA, was observed in cortex, hippocampus, and cerebellum. However, there was a significant increase in SDHB in the hippocampus (Fig. 4C,D). No major changes in the other OXPHOS subunits tested were detected in these three regions (Fig. 4C,D). These results suggest that multiple OXPHOS complexes containing mtDNA-encoded subunits were affected in striatum, whereas in the other brain regions we could detect a decrease only in the complex IV subunit, with a possible compensatory increase of mitochondrial levels in hippocampus.
Determining the approximate cell population makeup in different neuroanatomical regions
Although the mito-PstI transgene is only expressed in neurons, the neuroanatomical regions of interest are made up of other non-neuronal cell types, the majority of which being astrocytes. We wanted to determine the relative profile of the homogenate cell pools we were analyzing.
We performed Western blot analysis using Abs against β-III tubulin (a neuronal-specific cytoskeletal protein) and GFAP (an astrocytic cytoskeletal protein) as markers to determine whether the ratios of neuronal or astrocytic-immunopositive cells were grossly altered in 6-month-old Mito-PstI animals. Striatum had a higher relative β-III tubulin signal than cortex (Fig. 5B–D). These results suggest that there are more neuronal processes/cell bodies in the striatum than in homogenates from the other two regions. The GFAP signals from all the brain regions were not markedly different; however, animals that expressed mito-PstI had an increase in GFAP signal, suggestive of astrogliosis (Fig. 5A,C,D).
Figure 5.
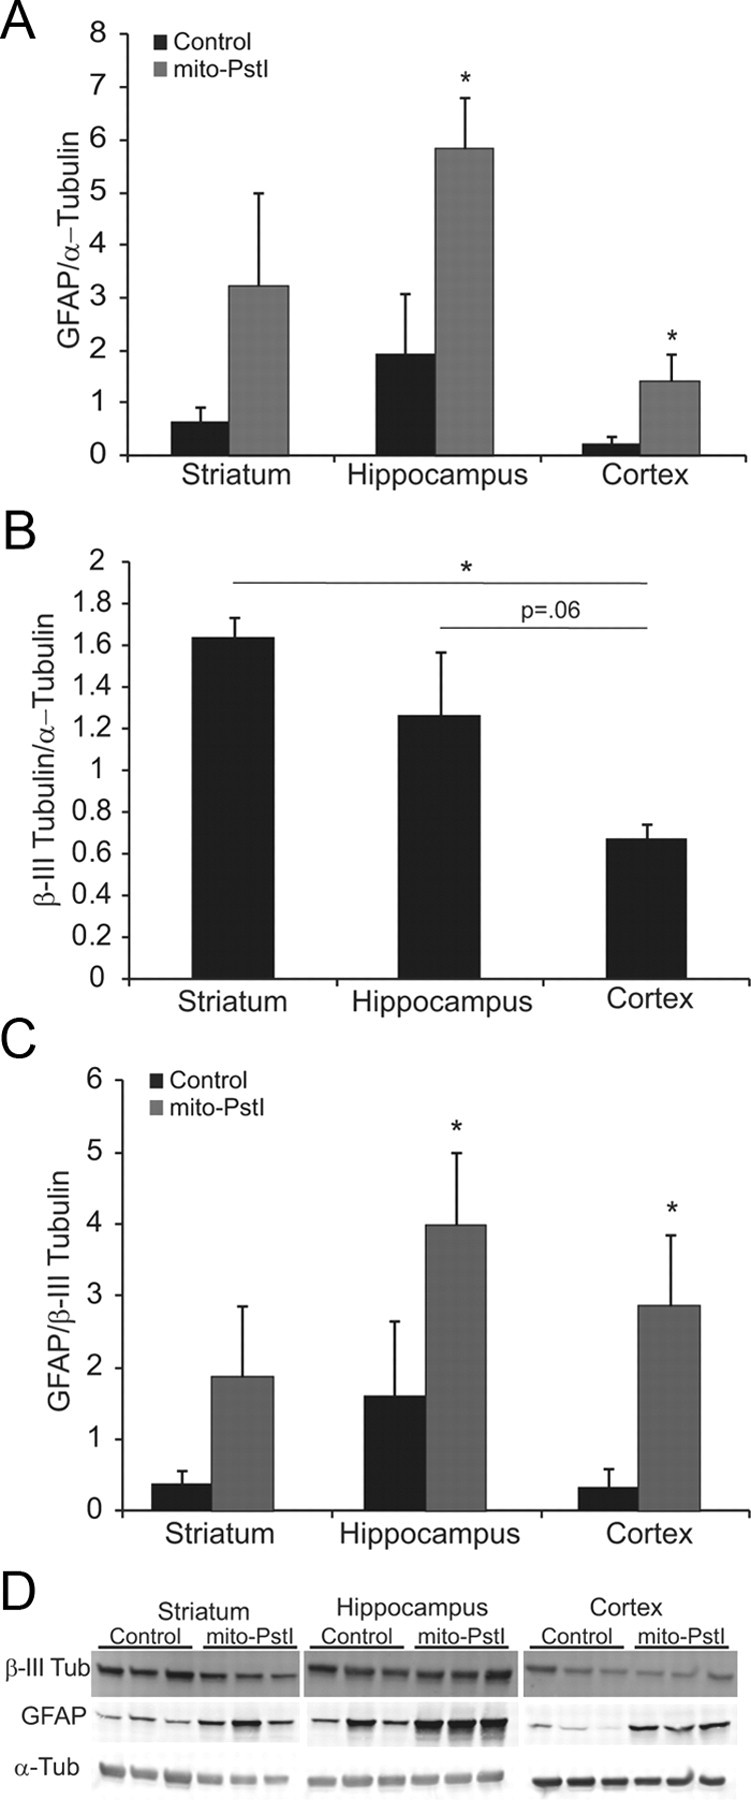
Striatum is enriched in neuronal-derived cells. A, Ratio of the optical density of immunoreactive GFAP/α-tubulin from Western blots of striatal, cortical, and hippocampal homogenates from 6-month-old animals. B, Ratio of the optical density of immunoreactive β-III tubulin/α-tubulin of Western blots of striatal, cortical, and hippocampal homogenates from 6-month-old animals. C, Ratio of the optical density of immunoreactive GFAP/β-III tubulin Western blots of striatal, cortical, and hippocampal homogenates from 6-month-old animals. D, Western blots from where quantitations were performed. Error bars represent SD; *p < 0.05, n = 3.
Mitochondrial bioenergetics are relatively higher in the striatum of wild-type mice
After excluding the possibilities that there could be preferential mito-PstI expression or selective impairment of OXPHOS activity in the striatum, we began to explore the reason for an increased reliance on mitochondrial OXPHOS function in the striatal area. When measuring COX and CS activities in wild-type mice, we observed that different brain regions exhibit distinct activities of COX and CS (Fig. 6A). It appeared that, in wild-type mice, striatum and cerebellum had both higher OXPHOS activity (inferred from the COX activity) and higher mitochondrial mass (assessed by CS activity) when compared to hippocampus and cerebral cortex.
Figure 6.
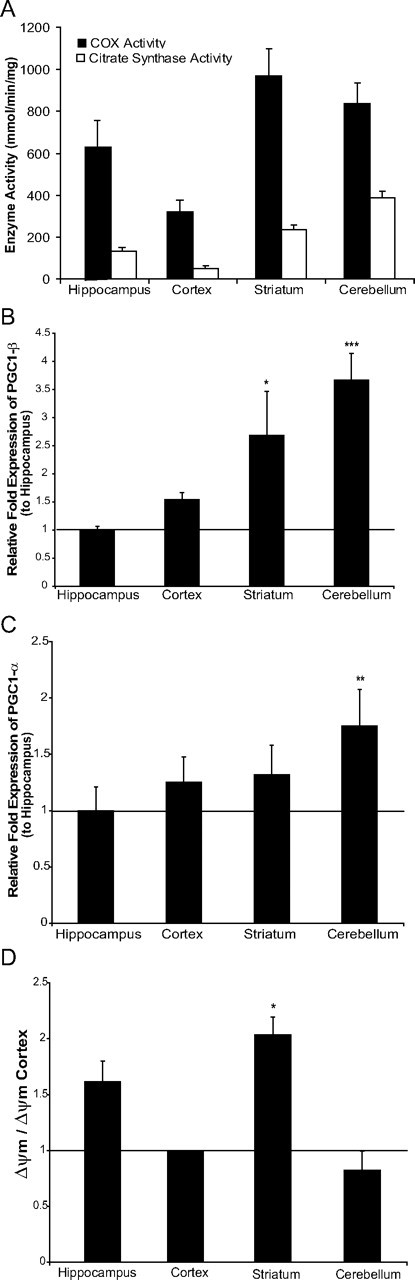
Striatum has a relatively high mitochondrial bioenergetics. A, COX activity and CS spectrophotometer assays comparing the activity per milligram of protein in cortex, hippocampus, striatum, and cerebellum. Values are mean ± SEM (n = 4–5/group). Significance of comparisons between regions for COX activity was as follows: cortex versus hippocampus, p = 0.0015; hippocampus versus striatum, p = 0.013; striatum versus cortex, p = 0.0012; cerebellum versus cortex, p = 0.041; cerebellum versus hippocampus, NS; cerebellum versus striatum, NS. Significance of comparisons between regions for CS activity was as follows: cortex versus hippocampus, p = 0.0044; hippocampus versus striatum, p = 0.0017; striatum versus cortex, p = 0.00011; cerebellum versus cortex, p = 8.27 × 10⁻⁶; cerebellum versus hippocampus, p = 6.80 × 10⁻⁶; cerebellum versus striatum, p = 0.00049. B, Relative fold expression of PGC-1β levels compared to hippocampus when normalized to β-actin expression. Values are mean ± SEM (control n = 4–5, mito-PstI = 4–5, *p < 0.05, ***p < 0.001). C, Relative fold expression of PGC-1α levels compared to hippocampus when normalized to β-actin expression. Values are mean ± SEM (control n = 4–5, mito-PstI = 4–5, **p < 0.01). D, Region-specific mean of fluorescence of isolated mitochondria stained with TMRE. Values are mean ± SEM (control n = 4–5, mito-PstI = 4–5, *p < 0.05).
PGC-1α and PGC-1β have been shown to control mitochondrial levels, density, and function in neurons (Wareski et al., 2009). Quantification of PGC-1β levels in different brain regions showed that striatum and cerebellum had relatively high PGC-1β levels (Fig. 6B). PGC-1β and PGC-1α had similar expression patterns (Fig. 6C).
To determine whether there were differences in basal levels of mitochondrial membrane potential (ΔΨm) across regions, we isolated and analyzed mitochondria from different brain regions of wild-type mice by TMRE-FACS. We observed a significantly higher ΔΨm in striatal-derived mitochondria than in cortical-derived mitochondria (Fig. 6D). These results suggest that not all regions of the brain have the same mitochondrial physiology. The differential expression of PGC-1 transcription coactivators in different brain regions may explain such regional differences in the property of mitochondria, especially in the striatum.
Striatal mitochondria is more sensitive to calcium
We wanted to determine whether the striatum mitochondria were more sensitive to a calcium stimulus as previously reported (Brustovetsky et al., 2003). In the cortex and hippocampus, a relatively low concentration of calcium increased the TMRE fluorescence (Fig. 7A,B,E). In contrast, the calcium stimulus reduced the ΔΨm in the striatum (Fig. 7C,E). There were no changes elicited in the cerebellum (Fig. 7D,E).
Figure 7.
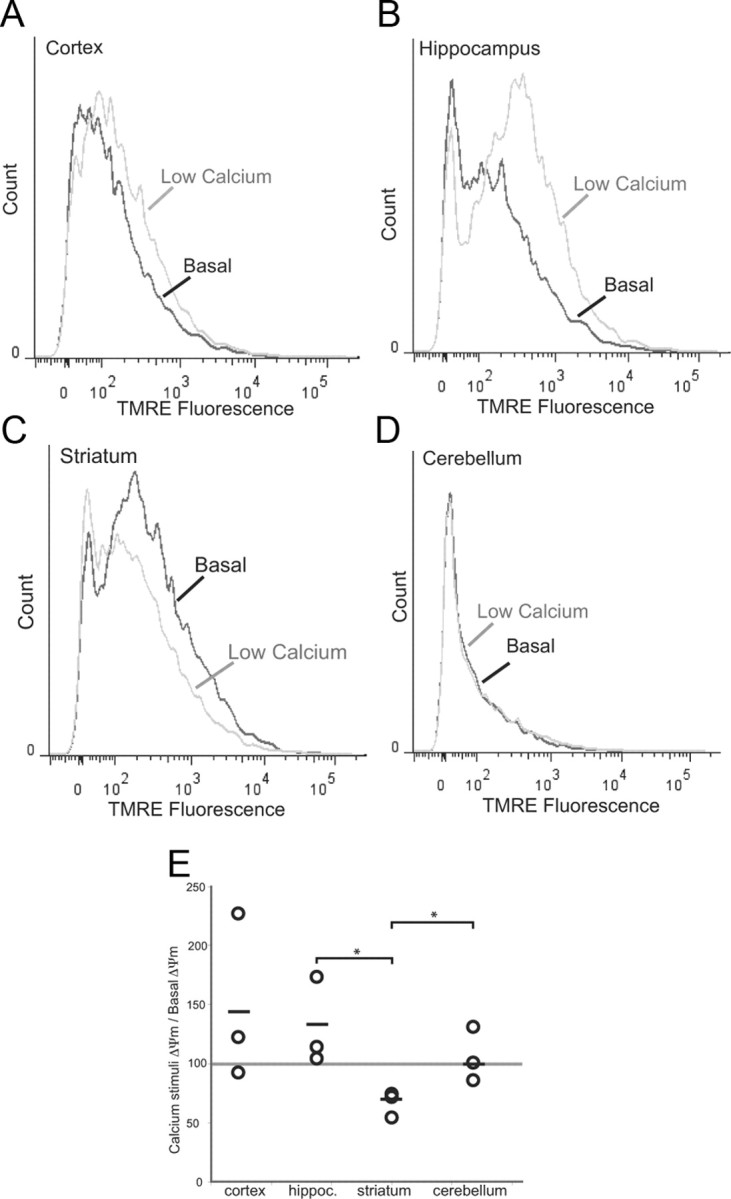
Mitochondrial membrane potential from striatum mitochondria of wild-type mice is highly sensitive to calcium stimulation. Histograms depicting TMRE fluorescence of mitochondria from a 2-month-old wild-type mouse at basal conditions or treated with calcium (0.3 μmol/mg protein). A, Cortex. B, Hippocampus. C, Striatum. D, Cerebellum. E, Plotted changes in (ΔΨm[Ca2+]/ΔΨm basal) from cortex, hippocampus, striatum, and cerebellum. Circles represent individual animals (n = 3). Horizontal line represents mean. *p < 0.05.
Membrane potential and calcium sensitivity are preferentially impaired in the striatum of Mito-PstI mice
We also compared the ΔΨm between 2-month-old control and Mito-PstI animals across different brain regions. Although the ΔΨm was reduced in all brain regions expressing mito-PstI, it was significantly worse in the striatum (Fig. 8A–D). We also wanted to determine whether the mito-PstI striatal mitochondria that retained high ΔΨm were still very sensitive to calcium. We observed that the Ca2+ stimulus had no effect on cortical or even a slight stimulatory effect on hippocampal Mito-PstI mitochondria, but it further reduced the TMRE fluorescence of the mitochondria from the Mito-PstI striatum (Fig. 8E). This suggests that the ΔΨm of Mito-PstI striatal mitochondria was more sensitive to disruptions than the ones in cortical and hippocampal regions.
Figure 8.
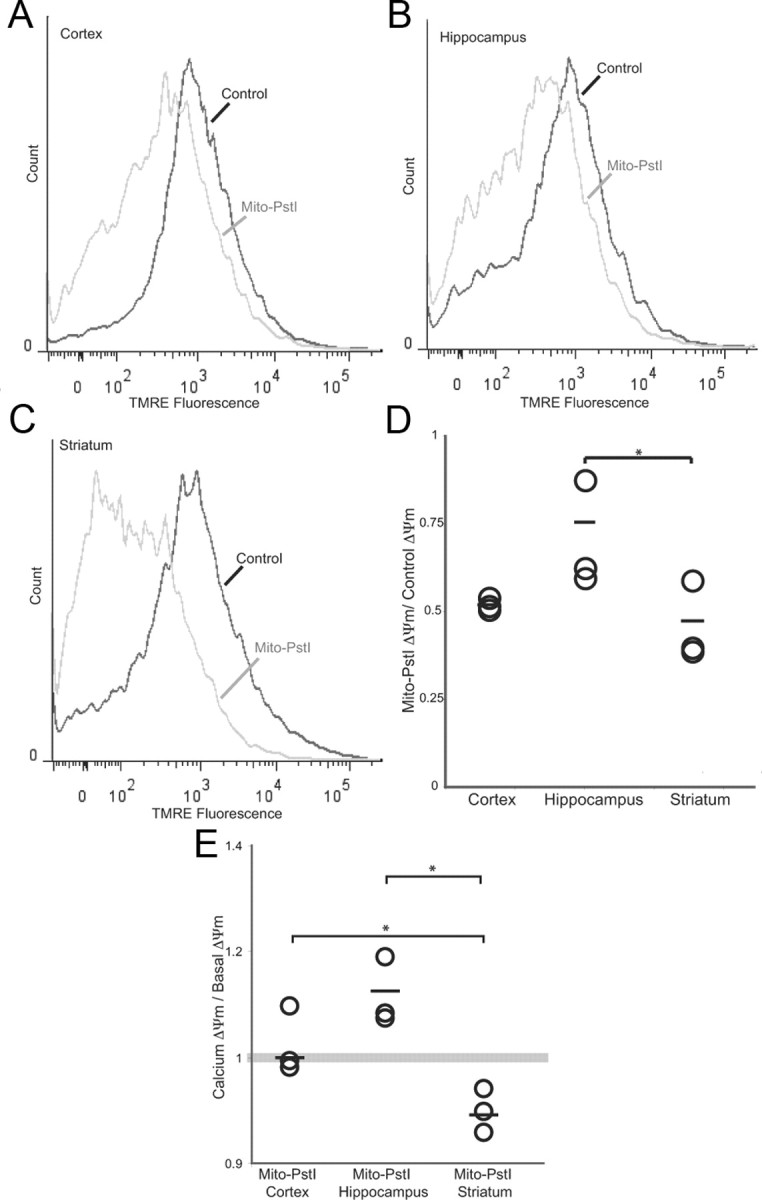
Basal ΔΨm is particularly decreased in the striatum of mito-PstI mice. Histograms depicting TMRE fluorescence of mitochondria from 2-month-old wild-type and Mito-PstI mice mouse at basal conditions. A, Cortex. B, Hippocampus. C, Striatum. D, Plotted changes in Mito-PstI ΔΨm/wild-type ΔΨm of cortex, hippocampus, and striatum. Circles represent individual animals (n = 3). Horizontal line represents mean. *p < 0.05. E, Plotted changes of the ratio of ΔΨm of mitochondria treated with low calcium to basal ΔΨm of the cortex, hippocampus, and striatum of Mito-PstI animals. Geometric fluorescence values were determined when gating for high ΔΨm mitochondria. Circles represent individual animals (n = 3). Horizontal line represents mean. *p < 0.05.
Discussion
We report a mouse model with an OXPHOS dysfunction-associated progressive neurodegenerative phenotype characterized by vulnerability of the striatum. To our knowledge, such differences in mitochondrial function and response to dysfunction in distinct neuroanatomical regions in vivo have not been previously described. We compared cortex, hippocampus, and striatum with a similar insult, namely, mtDNA damage by mito-PstI expression. All regions with mito-PstI expression were affected with progressive neurodegenerative pathology. However, the striatum was particularly susceptible, with an almost complete ablation of this neuroanatomical region. Because the striatum is rich in neuronal projections, soma counting cannot fully reflect the loss of neurons. However, the higher susceptibility of striatum neurons is also reflected by the fact that mito-PstI-positive neurons still exist in cortex and hippocampal samples at 14 months of age (data not shown), a time point when striatum can no longer be harvested due to its ablation. Nonetheless, the cellular heterogeneity of homogenates does provide a limitation, which should be taken into consideration when interpreting the results.
We did not observe this preferential susceptibility in a previously reported transgenic line expressing higher levels of mito-PstI (line 5751). In that model, the CaMKIIα-driven expression of mito-PstI caused an acute and massive depletion of mtDNA leading to premature death at 3–4 months of age (Fukui and Moraes, 2009). In this high mito-PstI expression model (15-fold higher than the model described here), we still see a widening of the lateral ventricles and degeneration of the striatum (data not shown); however, it is likely that the speed of degeneration did not allow us to notice that the striatum was both first affected and completely ablated before death.
Previous publications have also suggested regional and neuronal differences in susceptibility to OXPHOS deficiency. PGC-1α null mice had regional-specific spongiform neurodegeneration occurring in the striatum and to a lesser extent the cortex and hippocampus, even though the absence of the gene was ubiquitous (Lin et al., 2004; Leone et al., 2005). PGC-1α expression occurs in the cerebral cortex, hippocampus, cerebellum, striatum, and thalamus, particularly in GABAergic neuronal subtypes (Cowell et al., 2007). This subtype of neurons is enriched in the striatum as medium spiny neurons. In Huntington's disease, mutant huntingtin has been shown to transcriptionally repress PGC-1α, leading to mitochondrial dysfunction by interfering with cAMP-responsive element-binding protein (CREB) (Cui et al., 2006). CREB conditional knock-outs targeted to CAMKIIα-expressing neurons also show massive degeneration and atrophy of the striatum and CA1 region of the hippocampus, resembling the degeneration patterns seen in the PGC-1α null mice (Mantamadiotis et al., 2002). Our model also parallels this type of striatal degeneration, with cortex and hippocampus being affected later in the disease process. A report of another genetically manipulated model of mitochondria OXPHOS dysfunction [neuronal-specific transcription factor A (TFAM) null mouse] did not describe a preferential striatal defect. However, there was substantial degeneration of the striatum, in addition to that observed in the neocortex and hippocampus (Sörensen et al., 2001; Dufour et al., 2008). Most recently, a study looking at the genetic and siRNA ablation of Coenzyme Q in Caenorhabditis elegans noted a particular and specific vulnerability and degeneration of only GABAergic neurons (Earls et al., 2010).
Due to the nonhomogenous cell populations in brain, in vivo results can be difficult to interpret. A nonhomogenous cell population in the brain can mask OXPHOS deficits and mtDNA quantities, as not all cell types express mito-PstI, potentially leading to an underestimation of the defects in neurons. Although Western blots showed that striatum does have relatively higher levels of the neuronal marker βIII tubulin, we detected comparable levels of mito-PstI expression, mtDNA depletion, and COX deficiency in cortex, hippocampus, and striatum in 2-month-old Mito-PstI mice. Therefore, it appears that under chronic OXPHOS deficiencies, striatal neurons are more sensitive than hippocampal or cortical neurons.
Why do different brain regions have different susceptibility to OXPHOS defects? We envision at least two possibilities: (1) OXPHOS enzymes in the striatum are more sensitive to the reduction in mtDNA coded subunits. Curiously, complex II subunits were also decreased in the striatum, and we do not have an explanation for this observation. (2) We showed that wild-type cortex, hippocampus, striatum, and cerebellum have differences in mitochondrial enzymes activity and ΔΨm, with striatum showing relatively higher levels of these markers. These differences may be related to the cellular composition, but may be also related to the higher PGC-1α and β expression in the striatum. This increased dependence on OXPHOS, perhaps to maintain a high ΔΨm (see below), could make the striatum more sensitive to partial defects.
Other studies have also shown that mitochondria from different regions react differently to calcium stress. Studies using primary cultures showed an increased vulnerability of striatal-derived neurons and astrocytes to calcium when comparing to cells derived from the cerebral cortex (Oliveira and Gonçalves, 2009). Work from Dubinsky's group found that striatal mitochondria isolated from rats were more sensitive than cortical mitochondria in their response to calcium, perhaps due to increased amounts of cyclophilin D, a mitochondrial permeability transition pore component (Brustovetsky et al., 2003; LaFrance et al., 2005). Our study also showed a depolarization of ΔΨm when striatal mitochondria from wild-type and Mito-PstI animals are treated with low calcium levels. This calcium concentration did not promote a collapse in ΔΨm in cortical and hippocampal mitochondria, but rather increased ΔΨm, probably because of an activation of mitochondrial dehydrogenases (Brookes et al., 2004).
We also found significant astrogliosis in the cortex and hippocampus but not in the striatum of Mito-PstI mice. This finding raises the possibility that astrocytes may provide bioenergetic support to OXPHOS-disrupted neurons (Kasischke et al., 2004).
We propose the following model to explain the relatively high striatal susceptibility to an OXPHOS defect (Fig. 9). The striatum mitochondria have intrinsically higher OXPHOS function, and a higher basal ΔΨm, which is prone to collapse when OXPHOS activity is reduced. Because the rate of Ca2+ uptake depends on a robust proton motive force, we propose that under these conditions of low OXPHOS, cytosolic Ca2+ levels would increase, leading to cell death. The mitochondrial permeability transition does not need to be evoked, although it may be involved as the striatum ΔΨm is very sensitive to Ca2+ as well. In either case, toxic levels of Ca2+ would accumulate preferentially in the cytosol of striatal neurons.
Figure 9.

Proposed mechanism for the striatum vulnerability to OXPHOS defects. The upper panels depict a model under normal conditions. Control striatal mitochondria would have robust OXPHOS function, membrane potential, and would be more sensitive to a calcium stimulus as compared to cortical/hippocampal mitochondria. The lower panels depict the consequences of mito-PstI expression. Mito-PstI leads to mtDNA damage and decreases in OXPHOS. OXPHOS-dependent ΔΨm is relatively high in the striatum, and the OXPHOS defect leads to a marked collapse in ΔΨm with a consequent impairment in Ca2+ buffering. This leads to increased cytosolic Ca2+, which activates Ca2+-sensitive proteases causing neuronal death. Astrocytosis, observed mostly in cortex and hippocampus after mito-PstI expression, may have a protective effect by supplying neurons with metabolic substrates (e.g., lactate) or other prosurvival factors.
In summary, we have created a novel mouse model of mtDNA depletion by expressing relatively low levels of mito-PstI in CNS neurons, which leads to a chronic OXPHOS deficiency. This mouse model develops a progressive neurodegenerative phenotype with a preferential degeneration of the striatum. These results shed new light into how mitochondria contribute to regional differences in neurodegenerative pathologies such as in Huntington's disease and stroke.
Footnotes
This work was supported in part by National Institutes of Health Grants R01AG036871, R01EY010804, and R56NS041777 (C.T.M.) and National Institutes of Health Grants T32NS007492 and T32NS007459 and a Lois Pope LIFE Fellowship (A.M.P.). We thank Dr. John Barrett (University of Miami) for critically reading the manuscript, Dr. Kyle Padgett for the MRI images, and the Flow Cytometry Core at the UM Sylvester Comprehensive Cancer Center for assistance.
The authors declare no competing financial interests.
References
- Anderson S, Bankier AT, Barrell BG, de Bruijn MH, Coulson AR, Drouin J, Eperon IC, Nierlich DP, Roe BA, Sanger F, Schreier PH, Smith AJ, Staden R, Young IG. Sequence and organization of the human mitochondrial genome. Nature. 1981;290:457–465. doi: 10.1038/290457a0. [DOI] [PubMed] [Google Scholar]
- Barrientos A. In vivo and in organello assessment of OXPHOS activities. Methods. 2002;26:307–316. doi: 10.1016/S1046-2023(02)00036-1. [DOI] [PubMed] [Google Scholar]
- Berthet C, Lei H, Thevenet J, Gruetter R, Magistretti PJ, Hirt L. Neuroprotective role of lactate after cerebral ischemia. J Cereb Blood Flow Metab. 2009;29:1780–1789. doi: 10.1038/jcbfm.2009.97. [DOI] [PubMed] [Google Scholar]
- Betarbet R, Sherer TB, MacKenzie G, Garcia-Osuna M, Panov AV, Greenamyre JT. Chronic systemic pesticide exposure reproduces features of Parkinson's disease. Nat Neurosci. 2000;3:1301–1306. doi: 10.1038/81834. [DOI] [PubMed] [Google Scholar]
- Brookes PS, Yoon Y, Robotham JL, Anders MW, Sheu SS. Calcium, ATP, and ROS: a mitochondrial love-hate triangle. Am J Physiol Cell Physiol. 2004;287:C817–833. doi: 10.1152/ajpcell.00139.2004. [DOI] [PubMed] [Google Scholar]
- Brustovetsky N, Brustovetsky T, Purl KJ, Capano M, Crompton M, Dubinsky JM. Increased susceptibility of striatal mitochondria to calcium-induced permeability transition. J Neurosci. 2003;23:4858–4867. doi: 10.1523/JNEUROSCI.23-12-04858.2003. [DOI] [PMC free article] [PubMed] [Google Scholar]
- Cowell RM, Blake KR, Russell JW. Localization of the transcriptional coactivator PGC-1alpha to GABAergic neurons during maturation of the rat brain. J Comp Neurol. 2007;502:1–18. doi: 10.1002/cne.21211. [DOI] [PubMed] [Google Scholar]
- Cui L, Jeong H, Borovecki F, Parkhurst CN, Tanese N, Krainc D. Transcriptional repression of PGC-1alpha by mutant huntingtin leads to mitochondrial dysfunction and neurodegeneration. Cell. 2006;127:59–69. doi: 10.1016/j.cell.2006.09.015. [DOI] [PubMed] [Google Scholar]
- Dufour E, Terzioglu M, Sterky FH, Sörensen L, Galter D, Olson L, Wilbertz J, Larsson NG. Age-associated mosaic respiratory chain deficiency causes trans-neuronal degeneration. Hum Mol Genet. 2008;17:1418–1426. doi: 10.1093/hmg/ddn030. [DOI] [PMC free article] [PubMed] [Google Scholar]
- Earls LR, Hacker ML, Watson JD, Miller DM., 3rd Coenzyme Q protects Caenorhabditis elegans GABA neurons from calcium-dependent degeneration. Proc Natl Acad Sci U S A. 2010;107:14460–14465. doi: 10.1073/pnas.0910630107. [DOI] [PMC free article] [PubMed] [Google Scholar]
- Fukui H, Moraes CT. Extended polyglutamine repeats trigger a feedback loop involving the mitochondrial complex III, the proteasome and huntingtin aggregates. Hum Mol Genet. 2007;16:783–797. doi: 10.1093/hmg/ddm023. [DOI] [PubMed] [Google Scholar]
- Fukui H, Moraes CT. Mechanisms of formation and accumulation of mitochondrial DNA deletions in aging neurons. Hum Mol Genet. 2009;18:1028–1036. doi: 10.1093/hmg/ddn437. [DOI] [PMC free article] [PubMed] [Google Scholar]
- Guyot MC, Hantraye P, Dolan R, Palfi S, Maziére M, Brouillet E. Quantifiable bradykinesia, gait abnormalities and Huntington's disease-like striatal lesions in rats chronically treated with 3-nitropropionic acid. Neuroscience. 1997;79:45–56. doi: 10.1016/s0306-4522(96)00602-1. [DOI] [PubMed] [Google Scholar]
- Hara T, Nakamura K, Matsui M, Yamamoto A, Nakahara Y, Suzuki-Migishima R, Yokoyama M, Mishima K, Saito I, Okano H, Mizushima N. Suppression of basal autophagy in neural cells causes neurodegenerative disease in mice. Nature. 2006;441:885–889. doi: 10.1038/nature04724. [DOI] [PubMed] [Google Scholar]
- Kasischke KA, Vishwasrao HD, Fisher PJ, Zipfel WR, Webb WW. Neural activity triggers neuronal oxidative metabolism followed by astrocytic glycolysis. Science. 2004;305:99–103. doi: 10.1126/science.1096485. [DOI] [PubMed] [Google Scholar]
- Kirkinezos IG, Bacman SR, Hernandez D, Oca-Cossio J, Arias LJ, Perez-Pinzon MA, Bradley WG, Moraes CT. Cytochrome c association with the inner mitochondrial membrane is impaired in the CNS of G93A-SOD1 mice. J Neurosci. 2005;25:164–172. doi: 10.1523/JNEUROSCI.3829-04.2005. [DOI] [PMC free article] [PubMed] [Google Scholar]
- Komatsu M, Waguri S, Chiba T, Murata S, Iwata J, Tanida I, Ueno T, Koike M, Uchiyama Y, Kominami E, Tanaka K. Loss of autophagy in the central nervous system causes neurodegeneration in mice. Nature. 2006;441:880–884. doi: 10.1038/nature04723. [DOI] [PubMed] [Google Scholar]
- LaFrance R, Brustovetsky N, Sherburne C, Delong D, Dubinsky JM. Age-related changes in regional brain mitochondria from Fischer 344 rats. Aging Cell. 2005;4:139–145. doi: 10.1111/j.1474-9726.2005.00156.x. [DOI] [PubMed] [Google Scholar]
- Lee DR, Helps SC, Macardle PJ, Nilsson M, Sims NR. Alterations in membrane potential in mitochondria isolated from brain subregions during focal cerebral ischemia and early reperfusion: evaluation using flow cytometry. Neurochem Res. 2009;34:1857–1866. doi: 10.1007/s11064-009-0001-1. [DOI] [PubMed] [Google Scholar]
- Leone TC, Lehman JJ, Finck BN, Schaeffer PJ, Wende AR, Boudina S, Courtois M, Wozniak DF, Sambandam N, Bernal-Mizrachi C, Chen Z, Holloszy JO, Medeiros DM, Schmidt RE, Saffitz JE, Abel ED, Semenkovich CF, Kelly DP. PGC-1alpha deficiency causes multi-system energy metabolic derangements: muscle dysfunction, abnormal weight control and hepatic steatosis. PLoS Biol. 2005;3:e101. doi: 10.1371/journal.pbio.0030101. [DOI] [PMC free article] [PubMed] [Google Scholar]
- Lin J, Wu PH, Tarr PT, Lindenberg KS, St-Pierre J, Zhang CY, Mootha VK, Jäger S, Vianna CR, Reznick RM, Cui L, Manieri M, Donovan MX, Wu Z, Cooper MP, Fan MC, Rohas LM, Zavacki AM, Cinti S, Shulman GI, et al. Defects in adaptive energy metabolism with CNS-linked hyperactivity in PGC-1alpha null mice. Cell. 2004;119:121–135. doi: 10.1016/j.cell.2004.09.013. [DOI] [PubMed] [Google Scholar]
- Lin MT, Beal MF. Mitochondrial dysfunction and oxidative stress in neurodegenerative diseases. Nature. 2006;443:787–795. doi: 10.1038/nature05292. [DOI] [PubMed] [Google Scholar]
- Mantamadiotis T, Lemberger T, Bleckmann SC, Kern H, Kretz O, Martin Villalba A, Tronche F, Kellendonk C, Gau D, Kapfhammer J, Otto C, Schmid W, Schütz G. Disruption of CREB function in brain leads to neurodegeneration. Nat Genet. 2002;31:47–54. doi: 10.1038/ng882. [DOI] [PubMed] [Google Scholar]
- Mattson MP, Gleichmann M, Cheng A. Mitochondria in neuroplasticity and neurological disorders. Neuron. 2008;60:748–766. doi: 10.1016/j.neuron.2008.10.010. [DOI] [PMC free article] [PubMed] [Google Scholar]
- Oliveira JM, Gonçalves J. In situ mitochondrial Ca2+ buffering differences of intact neurons and astrocytes from cortex and striatum. J Biol Chem. 2009;284:5010–5020. doi: 10.1074/jbc.M807459200. [DOI] [PubMed] [Google Scholar]
- Orr AL, Li S, Wang CE, Li H, Wang J, Rong J, Xu X, Mastroberardino PG, Greenamyre JT, Li XJ. N-terminal mutant huntingtin associates with mitochondria and impairs mitochondrial trafficking. J Neurosci. 2008;28:2783–2792. doi: 10.1523/JNEUROSCI.0106-08.2008. [DOI] [PMC free article] [PubMed] [Google Scholar]
- Pickrell AM, Moraes CT. What role does mitochondrial stress play in neurodegenerative diseases? Methods Mol Biol. 2010;648:63–78. doi: 10.1007/978-1-60761-756-3_4. [DOI] [PubMed] [Google Scholar]
- Rodenas-Ruano A, Perez-Pinzon MA, Green EJ, Henkemeyer M, Liebl DJ. Distinct roles for ephrinB3 in the formation and function of hippocampal synapses. Dev Biol. 2006;292:34–45. doi: 10.1016/j.ydbio.2006.01.004. [DOI] [PubMed] [Google Scholar]
- Schmittgen TD, Livak KJ. Analyzing real-time PCR data by the comparative C(T) method. Nat Protoc. 2008;3:1101–1108. doi: 10.1038/nprot.2008.73. [DOI] [PubMed] [Google Scholar]
- Schon EA, Manfredi G. Neuronal degeneration and mitochondrial dysfunction. J Clin Invest. 2003;111:303–312. doi: 10.1172/JCI17741. [DOI] [PMC free article] [PubMed] [Google Scholar]
- Sörensen L, Ekstrand M, Silva JP, Lindqvist E, Xu B, Rustin P, Olson L, Larsson NG. Late-onset corticohippocampal neurodepletion attributable to catastrophic failure of oxidative phosphorylation in MILON mice. J Neurosci. 2001;21:8082–8090. doi: 10.1523/JNEUROSCI.21-20-08082.2001. [DOI] [PMC free article] [PubMed] [Google Scholar]
- Srivastava S, Moraes CT. Double-strand breaks of mouse muscle mtDNA promote large deletions similar to multiple mtDNA deletions in humans. Hum Mol Genet. 2005;14:893–902. doi: 10.1093/hmg/ddi082. [DOI] [PMC free article] [PubMed] [Google Scholar]
- Wang H, Lim PJ, Karbowski M, Monteiro MJ. Effects of overexpression of huntingtin proteins on mitochondrial integrity. Hum Mol Genet. 2009;18:737–752. doi: 10.1093/hmg/ddn404. [DOI] [PMC free article] [PubMed] [Google Scholar]
- Wareski P, Vaarmann A, Choubey V, Safiulina D, Liiv J, Kuum M, Kaasik A. PGC-1{alpha} and PGC-1{beta} regulate mitochondrial density in neurons. J Biol Chem. 2009;284:21379–21385. doi: 10.1074/jbc.M109.018911. [DOI] [PMC free article] [PubMed] [Google Scholar]
- Wiegand G, Remington SJ. Citrate synthase: structure, control, and mechanism. Annu Rev Biophys Biophys Chem. 1986;15:97–117. doi: 10.1146/annurev.bb.15.060186.000525. [DOI] [PubMed] [Google Scholar]