

Abstract
The toxicity of green tea extract (GTE) was evaluated in 14-week gavage studies in male and female F344/NTac rats and B6C3F1 mice at doses up to 1,000 mg/kg. In the rats, no treatment-related mortality was noted. In the mice, treatment-related mortality occurred in male and female mice in the 1,000 mg/kg dose groups. The cause of early deaths was likely related to liver necrosis. Treatment-related histopathological changes were seen in both species in the liver, nose, mesenteric lymph nodes, and thymus. In addition, in mice, changes were seen in the Peyer’s patches, spleen, and mandibular lymph nodes. The no adverse effect level (NOAEL) for the liver in both species was 500 mg/kg. In the nose of rats, the NOAEL in males was 62.5 mg/kg, and in females no NOAEL was found. No NOAEL was found in the nose of female or male mice. The changes in the liver and nose were considered primary toxic effects of GTE, while the changes in other organs were considered to be secondary effects. The nose and liver are organs with high metabolic enzyme activity. The increased susceptibility of the nose and liver suggests a role for GTE metabolites in toxicity induction.
Keywords: green tea, toxicity, liver, nasal cavity
Introduction
Tea is one of the most commonly consumed beverages in the world, second only to water (Galati et al. 2006). It is prepared from dried leaves of Camellia sinensis, of the Theaceae family, and can be divided into green, black, and Oolong tea, according to leaf treatment (Molinari et al. 2006; Schmidt et al. 2005). Green tea is produced by steaming immediately after harvest, black tea by fermentation, and Oolong tea by partial fermentation (Sarma et al. 2008). In general, approximately 10% of the dry weight of green tea is made up of catechins, mainly epicatechin, epicatechin-3-gallate, epigallocatechin, and epigallocatechin-3-gallate (EGCG), with EGCG being the highest in concentration (Galati et al. 2006; Molinari et al. 2006). These are considered the active compounds in green tea (Galati et al. 2006). Being a common beverage, green tea has recently drawn much attention because of the increasing number of reports describing its potential beneficial effects, such as antioxidative, anti-inflammatory, anticarcinogenic, thermogenic, probiotic, and antimicrobial properties (Graham 1992; Molinari et al. 2006). Because of green tea’s alleged beneficial effects, green tea–based products have become the fourth most commonly used dietary supplement in the United States (Sarma et al. 2008). Exposure to green tea can take place in several forms: consumed as dilute beverages or concentrated supplements or applied topically (Sarma et al. 2008).
While the administration of EGCG to mice or rats has generally been considered nontoxic (Isbrucker et al. 2006), several adverse effects of green tea or its components have been reported in animal and in vitro studies. For example, adverse effects have been observed in dermal and eye irritation studies (Isbrucker et al. 2006; Stratton et al. 2000). These included the formation of erythema and papular lesions in the skin and reddening of the conjunctiva and sclera, discharge, and chemosis in the eyes. In addition, hepatic necrosis and intestinal toxicity, including intestinal dilatation and small intestinal hemorrhagic fluid, were reported (Isbrucker et al. 2006; Johnson et al. 1999; McCormick et al. 1999). Additionally, tea was found to accelerate the appearance of skin tumors in mice and to increase the amount of glutathione S-transferase placenta-form positive liver foci in a multiorgan rat carcinogenesis model (Bogovski and Day 1977; Hirose et al. 1993). Furthermore, tea extracts (both black and green) significantly accelerated the onset of convulsions and increased the duration of convulsions in models of experimentally induced convulsions in mice (Gomes et al. 1999).
In the USA, green tea is regulated as a generally regarded as safe (GRAS) compound by the U.S. Food and Drug Administration (C. D. Wu and Wei 2002), and concentrated green tea polyphenols are classified as dietary supplements (Chow et al. 2003). Nevertheless, several adverse effects have been reported with these compounds. For example, human dermal hypersensitivity and asthma were induced by green tea dust (Shirai et al. 2003, 1997; Shirai, Sato, and Hara 1994), and green tea consumption (four to nine cups per day) was associated with increased human lung cancer risk (Tewes et al. 1990) and teratogenicity (neural tube defects and anencephaly) (Correa, Stolley, and Liu 2000; Fedrick 1974). A green tea product, Exolise®, used for weight reduction, has been implicated in thirteen cases of elevated hepatocellular liver enzymes in France and Spain (Gloro et al. 2005), with one case resulting in liver failure. These cases led the French and Spanish authorities to suspend the market authorization of this product (Sarma et al. 2008). The mechanism of hepatotoxicity is still unknown (Galati et al. 2006; Schmidt et al. 2005).
The National Cancer Institute recommended the EGCG for toxicity testing, as it is being considered as a potential cancer chemopreventive agent. Because of the high cost of purified EGCG, and because human exposure is mainly to green tea extract (GTE), the National Toxicology Program (NTP) decided to conduct its studies on GTE. The GTE used in these studies had standardized polyphenol and caffeine concentrations. The NTP 14-week toxicity studies in male and female F344/NTac rats and B6C3F1 mice were aimed at characterizing the toxicity of GTE.
Materials and Methods
Chemicals
GTE (CAS No. GREENTEAEXTR) was obtained from Amax NutraSource, Inc. (Eugene, OR/City of Industry, CA) in one lot. GTE was identified by infrared spectroscopy. Analysis by high-performance liquid chromatography using ultraviolet detection indicated that the composition was typical of GTE and included gallocatechin (0.52 wt %), epigallocatechin (2.26 wt %), catechin (0.51 wt %), epicatechin (2.83 wt %), catechin gallate (0.45 wt %), caffeine (4.99 wt %), EGCG (48.4 wt %), gallocatechin gallate (4.6 wt %) and epicatechin gallate (12.8 wt %).
Animals and Housing
The studies were conducted in the AAALAC-accredited facility of Battelle-Columbus Laboratories (Columbus, OH). Animal use was in accordance with the United States Public Health Service policy on humane care and use of laboratory animals and the Guide for the Care and Use of Laboratory Animals (National Research Council 1996). In addition, these studies were conducted in compliance with the Food and Drug Administration Good Laboratory Practice Regulations (Food and Drug Administration 1987). Male and female F344/NTac rats and B6C3F1 mice (21 to 30 days old) were obtained from Taconic Laboratory Animals and Services (Germantown, NY) and quarantined for 11 days before dosing. Water and feed (NTP-2000, Zeigler Brothers Inc., Gardners, PA) were available ad libitum. The room temperature was 21–24°C and the humidity was 35–65% throughout the study. The fluorescent light cycle was 12 h per day, and there were at least 10 room air changes per hour. Rats and mice were randomly assigned to treatment groups. Male mice were housed individually, and rats and female mice were housed 5 per cage in poly-carbonate cages containing Sani-Chips bedding from P.J. Murphy Forest Products Corporation (Montville, NJ).
Dose Selection Rationale
Dose selection was based on an abstract of a study conducted by National Cancer Institute-ITT Research Institute (NCI-ITTRI) (Johnson et al. 1999) that reported that 90-day gavage administration of green tea polyphenol fraction to rats at 1 g/kg caused early deaths, depression of body weight gain and food consumption, intestinal dilatation, pancreatic necrosis, hepatic degeneration/necrosis, and thymic necrosis/atrophy. In the present studies, 1 g/kg was selected as the highest dose level based on the assumption that herbals are not standardized and the NCI-IITRI study needed to be repeated.
Experimental Design
Groups of 10 male and 10 female rats and mice were administered 0, 62.5, 125, 250, 500, or 1,000 mg/kg GTE in de-ionized water by gavage 5 days a week for 14 weeks. The total dosing volume was 10 mL/kg body wt for the mice and 5 mL/kg for the rats. Ten additional male and female rats per dose group were included for hematology and clinical chemistry analyses. These animals were sacrificed on day 23 (23-day study groups). Animals were observed twice a day for signs of mortality or morbidity. Individual animal weights were recorded weekly. At the end of the 23-day and 14-week studies, animals were euthanized by CO2 asphyxiation. Animals were anesthetized with a CO2/air mixture and blood was obtained from the retro-orbital plexus on days 4 and 23 from the 23-day study rats and at the end of the 14-week studies from both rats and mice in the core study. Blood for hematology was collected into tubes containing EDTA or into serum separator tubes for clinical chemistry analyses. Blood smears were prepared from mice for micronuclei analyses.
Clinical Chemistry and Hematology
In rats and mice, hematology determinations, including erythrocyte and leukocyte counts, hemoglobin concentration, volume of packed red cells, mean corpuscular volume, mean corpuscular hemoglobin, and mean corpuscular hemoglobin concentration, platelet counts, reticulocyte counts, and leukocyte differential counts were performed using the Advia 120 (Bayer Diagnostics Division, Tarrytown, NY). For rats, clinical chemistry endpoints (i.e., glucose, alanine aminotransferase, alkaline phosphatase, bile acids, sorbitol dehydrogenase, albumin, total protein, urea nitrogen, creatinine, and creatine kinase) were analyzed using the Hitachi 911 (Roche, Indianapolis, IN).
Organ Weights and Histopathology
The weights of the liver, thymus, right kidney, right testis, heart, lungs, and spleen were determined at terminal sacrifice. Tissues (except eyes) for microscopic evaluation were fixed and preserved in 10% neutral buffered formalin, processed and trimmed, embedded in paraffin, sectioned to a thickness of approximately 5 microns, and stained with hematoxylin and eosin. The eyes were fixed in Davidson’s solution before being transferred into 10% neutral buffered formalin. The following tissues from all high-dose and control groups were examined microscopically: adrenal gland, brain, clitoral gland, esophagus, eyes, femur (including marrow), gall bladder (mice), Harderian gland, heart and aorta, large intestine (cecum, colon, and rectum), small intestine (duodenum, jejunum, and ileum), kidney, liver, lung (and main stem bronchi), lymph nodes (mandibular and mesenteric), mammary gland, nose, oral cavity, ovary, pancreas, parathyroid gland, pituitary gland, preputial gland, prostate gland, salivary gland, skin, spinal cord and sciatic nerve, spleen, stomach (including fore stomach and glandular stomach), testis (with epididymis and seminal vesicle), thigh muscle, thymus, thyroid gland, tongue, trachea, urinary bladder, uterus, vagina, and Zymbal’s gland. Three nasal sections that included oral tissues were examined. The maxilla was trimmed immediately posterior to the upper incisor teeth (level I), through the level of the incisive papilla anterior to the first palatial ridge (level II), and through the middle of the second molar teeth (level III) (Boorman, Morgan, and Uriah 1990). Target organs examined in all lower-dose groups were the liver, nose, mesenteric lymph node, and thymus in rats; and the liver, nose, lymph nodes, spleen, and thymus in mice. In mice, the heart was evaluated but determined not to be a target organ. A semiquantitative grading scheme was used to evaluate the extent of the lesions in the tissue, such as necrosis, inflammation, metaplasia, and hyperplasia, generally using the criteria presented by Shackelford et al. (2002), using five grades, as follows: no lesion (grade 0); minimal (grade 1); mild (grade 2); moderate (grade 3); and marked (grade 4). Special stains (Hall’s for bile, Schmorl’s for ceroid lipofuscin, Periodic Acid Schiff [PAS] for glycoprotein, and Prussian Blue for iron) were performed on sections of liver and nose from rats diagnosed with pigment in the olfactory epithelium, histiocytes in lamina propria of the nose, and Kupffer cells of the liver.
Upon completion of the laboratory pathologist’s histologic evaluation, an independent pathology laboratory performed quality assessment of all data. Results were reviewed and evaluated by an NTP Pathology Working Group (PWG). The final diagnoses represent a consensus of all pathologists.
Statistical Analyses
Organ weight and body weight data, which are typically normally distributed, were analyzed using the multiple comparisons procedures of D. A. Williams (1971, 1972) and Dunnett (1955). Clinical chemistry and hematology, which typically have skewed distributions, were analyzed using the nonparametric multiple comparisons methods of Shirley (1977) and Dunn (1964). Jonckheere’s test (1954) at p < .01 was used to assess the significance of dose-response trends for both normal and skewed data, to determine whether a trend-sensitive test (Williams’ or Shirley’s test) or a simple pairwise comparison with the control group (Dunnett’s or Dunn’s test) should be used.
Non-neoplastic lesion incidences in the dosed groups were compared with the control group using Fisher’s exact test (Gart, Chu, and Tarone 1979).
Results
Rats
Clinical Observations
No overtly abnormal behavior was seen, except for an increased activity at the high dosage (1,000 mg/kg GTE) animals for at least the first 3 weeks of the study.
Survival, Body and Organ Weights
One female in the 125 mg/kg GTE dose group from the 14-week study and one female in the 125 mg/kg GTE dose group from the 23-day study died before the end of the study. The cause of death was not considered as related to treatment. All other animals survived until scheduled sacrifice. Therefore, it was concluded that GTE administration had no effects on survival.
Table 1 summarizes the effects of GTE on terminal body and selected organ weights in the 14-week study in rats. The terminal body weights were decreased in the 250 mg/kg and higher male and female dose groups. Decreased thymus weight was the only treatment related observation.
Table 1.
Weights and selected organ weights of male and female F344 rats administered green tea extract (GTE) by gavage for 14 weeks.
| Parameter | GTE (mg/kg)
|
|||||
|---|---|---|---|---|---|---|
| 0 | 62.5 | 125 | 250 | 500 | 1,000 | |
| Males | ||||||
| Terminal body weight (g) | 339.5 ± 12 | 330.0 ± 13.9 | 329.5 ± 11.4 | 318.1 ± 12.5** | 301.6 ± 16.9** | 293.0 ± 12.4** |
| Organ weight (g) | ||||||
| Liver | 12.612 ± 0.948 | 12.134 ± 0.776 | 12.143 ± 0.723 | 11.25 ± 0.62** | 10.676 ± 0.955** | 11.062 ± 0.862** |
| Spleen | 0.722 ± 0.051 | 0.677 ± 0.034** | 0.679 ± 0.046 | 0.679 ± 0.038 | 0.621 ± 0.021** | 0.543 ± 0.036** |
| Thymus | 0.364 ± 0.05 | 0.354 ± 0.043 | 0.33 ± 0.045 | 0.317 ± 0.07 | 0.289 ± 0.039** | 0.231 ± 0.034** |
| Organ to body weight ratio (mg organ weight/g body weight) | ||||||
| Liver | 3.713 ± 0.208 | 3.676 ± 0.158 | 3.687 ± 0.216 | 3.537 ± 0.155 | 3.537 ± 0.193 | 3.775 ± 0.244 |
| Spleen | 0.213 ± 0.01 | 0.205 ± 0.008 | 0.206 ± 0.012 | 0.214 ± 0.013 | 0.206 ± 0.011 | 0.186 ± 0.015** |
| Thymus | 0.107 ± 0.013 | 0.108 ± 0.015 | 0.1 ± 0.014 | 0.099 ± 0.021 | 0.096 ± 0.011 | 0.079 ± 0.013** |
| Right kidney | 0.322 ± 0.011 | 0.328 ± 0.013 | 0.331 ± 0.004* | 0.343 ± 0.014** | 0.356 ± 0.017** | 0.356 ± 0.018** |
| Females | ||||||
| Terminal body weight (g) | 188.2 ± 7.4 | 184.0 ± 10.1 | 183.9 ± 8.5 | 176.0 ± 5.5* | 178.6 ± 12.7 | 175.5 ± 9* |
| Organ weight (g) | ||||||
| Liver | 6.573 ± 0.44 | 6.304 ± 0.488 | 6.371 ± 0.393 | 5.946 ± 0.481* | 6.255 ± 0.514 | 6.534 ± 0.449 |
| Spleen | 0.495 ± 0.031 | 0.453 ± 0.036 | 0.473 ± 0.061 | 0.457 ± 0.027 | 0.468 ± 0.03 | 0.464 ± 0.03 |
| Thymus | 0.277 ± 0.018 | 0.265 ± 0.048 | 0.253 ± 0.028 | 0.251 ± 0.025* | 0.23 ± 0.028** | 0.235 ± 0.049* |
| Right kidney | 0.697 ± 0.04 | 0.663 ± 0.04 | 0.704 ± 0.063 | 0.637 ± 0.041* | 0.652 ± 0.05 | 0.665 ± 0.052 |
| Organ to body weight ratio (mg organ weight/g body weight) | ||||||
| Liver | 3.493 ± 0.191 | 3.426 ± 0.176 | 3.466 ± 0.185 | 3.379 ± 0.24 | 3.504 ± 0.199 | 3.723 ± 0.175* |
| Spleen | 0.263 ± 0.014 | 0.246 ± 0.013* | 0.258 ± 0.035 | 0.26 ± 0.016 | 0.263 ± 0.018 | 0.265 ± 0.019 |
| Thymus | 0.147 ± 0.009 | 0.143 ± 0.02 | 0.138 ± 0.015 | 0.143 ± 0.014 | 0.129 ± 0.016 | 0.133 ± 0.024 |
| Right kidney | 0.371 ± 0.019 | 0.36 ± 0.01 | 0.383 ± 0.025 | 0.362 ± 0.018 | 0.365 ± 0.011 | 0.379 ± 0.022 |
Values are mean ± standard error. Ten animals were evaluated in each group.
Statistical significance at p ≤ .05.
p ≤ .01.
Clinical Chemistry and Hematology
There were no changes in the hematology evaluations attributable to administration of GTE (data not shown). Clinical chemistry evaluations indicated treatment-related changes in bile acid in the 14-week high-dose group relative to control (males: 44.3 μm/l vs. 8.7 μm/l, p < .001; females: 46.3 μm/l vs. 9.4 μm/l, p < .001). In addition, total protein and albumin were significantly decreased in the 250 mg/kg female group and higher. Total protein was decreased also in the 250 mg/kg male dose group and higher.
Histopathology
Treatment-related changes were seen in the liver, nose, thymus, and mesenteric lymph nodes (Tables 2 and 3).
Table 2.
Incidence and average severitya of selected non-neoplastic lesions in male rats in the 14-week gavage study with green tea extract (GTE).
| Parameter | GTE (mg/kg)
|
|||||
|---|---|---|---|---|---|---|
| 0 | 62.5 | 125 | 250 | 500 | 1,000 | |
| Hematopoietic system | ||||||
| Thymus | ||||||
| Atrophy | 0 | 0 | 0 | 1 (1.0) | 0 | 5 (1.0)** b |
| Respiratory system | ||||||
| Nose | ||||||
| Glands, olfactory epithelium, hyperplasia | 0 | 0 | 0 | 0 | 3 (1.3) | 7 (1.1)** |
| Lamina propria, pigmentation, histiocytes | 0 | 0 | 0 | 0 | 0 | 2 (2.0) |
| Nasopharyngeal duct, degeneration | 0 | 0 | 0 | 0 | 3 (2.0) | 3 (2.0) |
| Nasopharyngeal duct, inflammation | 0 | 0 | 0 | 0 | 2 (1.0) | 3 (2.0) |
| Nerve, atrophy | 0 | 0 | 0 | 0 | 5 (1.8)* | 10 (1.7)** |
| Olfactory epithelium, atrophy | 0 | 0 | 2 (1.0) | 1 (1.0) | 3 (1.0) | 9 (1.1)** |
| Olfactory epithelium, hyperplasia, basal cell | 0 | 0 | 0 | 0 | 1 (1.0) | 1 (1.0) |
| Olfactory epithelium, metaplasia | 0 | 0 | 1 (1.0) | 0 | 6 (1.5)** | 10 (1.0) ** |
| Olfactory epithelium, necrosis | 0 | 0 | 0 | 0 | 1 (1.0) | 3 (1.7) |
| Olfactory epithelium, pigmentation | 0 | 0 | 0 | 0 | 4 (1.0)* | 5 (1.0)* |
| Respiratory epithelium, atrophy | 0 | 0 | 0 | 0 | 0 | 1 (2.0) |
| Respiratory epithelium, hyperplasia | 1 (2.0) | 0 | 0 | 0 | 2 (1.0) | 4 (1.0)* |
| Respiratory epithelium, metaplasia, squamous | 0 | 0 | 0 | 0 | 0 | 1 (1.0) |
| Respiratory epithelium, necrosis | 0 | 0 | 0 | 0 | 0 | 1 (2.0) |
Ten animals were evaluated in each group. Values represent incidences (average severity).
The severity of each lesion was graded from minimal to marked (1–4).
Eight animals were evaluated for this organ in this dose group.
Incidence differs from the control group at p < .05.
p < .01.
Table 3.
Incidence and average severitya of selected non-neoplastic lesions in female rats in the 14-week gavage study with green tea extract (GTE).
| Parameter | GTE (mg/kg)
|
|||||
|---|---|---|---|---|---|---|
| 0 | 62.5 | 125 | 250 | 500 | 1,000 | |
| Alimentary system | ||||||
| Liver | ||||||
| Mitosis | 0 | 0 | 0 | 0 | 0 | 2 (1.5) |
| Pigmentation | 0 | 0 | 0 | 0 | 0 | 2 (2.0) |
| Bile duct, hyperplasia | 0 | 0 | 0 | 0 | 0 | 3 (1.0) |
| Hepatocyte, necrosis | 0 | 0 | 0 | 0 | 0 | 1 (3.0) |
| Oval cell, hyperplasia | 0 | 0 | 0 | 0 | 0 | 3 (1.7) |
| Periportal, hypertrophy | 0 | 0 | 0 | 0 | 0 | 2 (1.5) |
| Hematopoietic system | ||||||
| Lymph node, mesenteric | ||||||
| Atrophy | 0 | 0 | 0 | 0 | 0 | 1 (2.0) |
| Thymus | ||||||
| Atrophy | 0 | 0 | 0 | 0 | 0 | 6 (1.0)** |
| Respiratory system | ||||||
| Nose | ||||||
| Infiltration cellular, mononuclear cell | 0 | 0 | 0 | 0 | 0 | 1 (2.0) |
| Inflammation, subchronic | 2 (1.0) | 1 (1.0) | 1 (1.0) | 4 (1.0) | 10 (1.2)** | 8 (1.0)** |
| Glands, olfactory epithelium, hyperplasia | 0 | 0 | 0 | 2 (1.0) | 1 (1.0) | 4 (1.0)* |
| Lamina propria, pigmentation, histiocytes | 0 | 0 | 0 | 0 | 0 | 1 (1.0) |
| Nasopharyngeal duct, degeneration | 0 | 0 | 0 | 0 | 2 (1.5) | 0 |
| Nerve, atrophy | 0 | 0 | 0 | 1 (1.0) | 4 (1.0)* | 5 (1.8)* |
| Olfactory epithelium, atrophy | 0 | 1 (1.0) | 1 (1.0) | 0 | 0 | 7 (1.1)** |
| Olfactory epithelium, hyperplasia, basal cell | 0 | 0 | 0 | 1 (1.0) | 0 | 0 |
| Olfactory epithelium, metaplasia | 0 | 0 | 0 | 0 | 5 (1.2)* | 4 (1.0)* |
| Olfactory epithelium, pigmentation | 0 | 0 | 0 | 2 (1.0) | 3 (1.0) | 5 (1.0)* |
| Respiratory epithelium, hyperplasia | 0 | 0 | 0 | 1 (1.0) | 1 (1.0) | 0 |
Ten animals were evaluated in each group. Values represent incidences (average severity).
The severity of each lesion was graded from minimal to marked (1–4).
Incidence differs from the control group at p < .05.
p < .01.
Liver
Findings in the liver were limited to 3 of 10 female rats treated with 1,000 mg/kg. Changes consisted of a single case of moderate centrilobular necrosis, characterized by necrotic hepatocytes, hemorrhage, and a mononuclear infiltrate in the centrilobular regions. The necrotic hepatocytes frequently had pyknotic and karyorrhectic nuclei and either vacuolated or eosinophilic condensed cytoplasm. The necrosis was associated with mild chronic inflammation (Figure 1). Additional changes in these 3 rats were suggestive of regeneration and included minimal bile duct hyperplasia, minimal to mild oval cell hyperplasia, a minimal to mild increase in the number of midzonal hepatocytes with mitotic figures, and mild accumulation of golden brown pigment in Kupffer cells. Special stains, Schmorl’s, PAS, Hall’s Bile, and Prussian Blue stains, were used to determine the type of pigment in the Kupffer cells. The results indicated positive staining for Schmorl’s and Prussian Blue and weak positive staining for PAS, suggesting the presence of ceroid lipofuscin, iron, and glycoprotein, respectively (Figure 2). In addition, 2 of these 3 rats were diagnosed with periportal hypertrophy, with and without the presence of necrosis. The hypertrophic hepatocytes also had karyomegaly.
Figure 1.
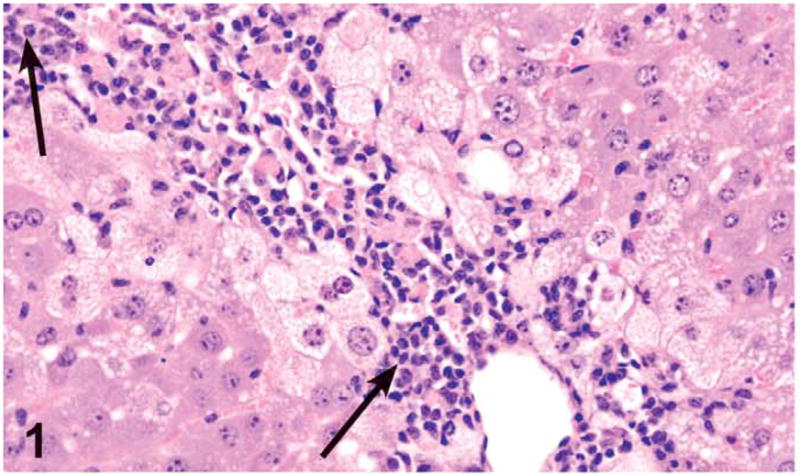
Centrilobular hepatocellular necrosis and chronic inflammation (arrows) in a female rat administered 1,000 mg/kg green tea extract (GTE) by gavage for 3 months. Centrilobular necrosis with prominent mononuclear inflammatory reaction consisting of lymphocytes, plasma cells, and macrophages bordered by vacuolated hepatocytes (fatty change). H&E, X20.
Figure 2.
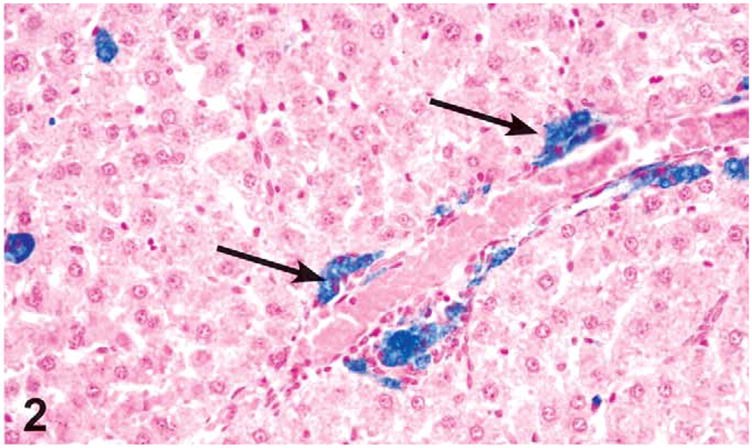
Prussian Blue positive (detecting ferritin) pigment accumulation in Kupffer cells in the liver of a female rat administered 1,000 mg/kg green tea extract (GTE) by gavage for 3 months (arrows). The pigment was also positive for ceroid lipofuscin (Schmorl’s staining) and glycoproteins (PAS staining). Prussian Blue, X20.
Nose
Significant dose-related changes in the nose were limited to the males and females treated with 500 and 1,000 mg/kg; nevertheless, sporadic cases of potentially treatment-related lesions were also seen in the males and females treated with 125 and 250 mg/kg and in the females treated with 62.5 mg/kg.
Grading criteria for the nasal lesions were as follows: minimal grade was characterized by a unilateral involvement, mild grade represented bilateral involvement or unilateral on multiple levels, moderate grade represented bilateral involvement on more than one level, and severe grade represented involvement of all or almost all of the respective epithelium (i.e., olfactory) present in all levels.
The most frequent lesions in the rat nasal cavity were chronic inflammation, olfactory epithelium atrophy, olfactory nerve atrophy, and metaplasia of olfactory epithelium to respiratory epithelium.
Treatment-related increases in the incidence and/or severity of chronic inflammation were noted in both males and females treated with 500 and 1,000 mg/kg. This lesion was characterized largely by neutrophils, with lesser numbers of lymphocytes and plasma cells in the lamina propria migrating through the epithelium and sometimes filling the airways or the lumina of Bowman’s glands. Inflammation frequently involved the respiratory epithelium of the nasal septum or lateral wall of levels I and II and the olfactory epithelium in the dorsal or dorsolateral meatus of levels II and III. In severe lesions in males treated with 500 and 1,000 mg/kg, the infiltrate was associated with olfactory epithelium necrosis, characterized by sloughing or loss of the olfactory epithelium with pyknosis and karyorrhexis of the nuclei.
Olfactory epithelial atrophy was noted down to the 62.5 mg/kg dose level in females and 125 mg/kg in males. Olfactory epithelial atrophy was characterized by the loss of layers of olfactory epithelial cells, especially in the dorsal meatus, compared with controls. Olfactory nerve atrophy was noted in the males and females treated with 500 and 1,000 mg/kg and in the females treated with 250 mg/kg. This change was characterized by the loss of olfactory nerve bundles in the submucosal regions underlying the olfactory epithelium in the dorsal meatus level II and dorsal meatus and nasal turbinates of level III (Figures 3 and 4). Nerve atrophy was frequently accompanied by olfactory epithelial metaplasia characterized by the transition of olfactory epithelium to respiratory epithelium. Metaplasia of the olfactory epithelium was present down to the 500 mg/kg dose level in females and the 125 mg/kg dose level in males.
Figure 3.
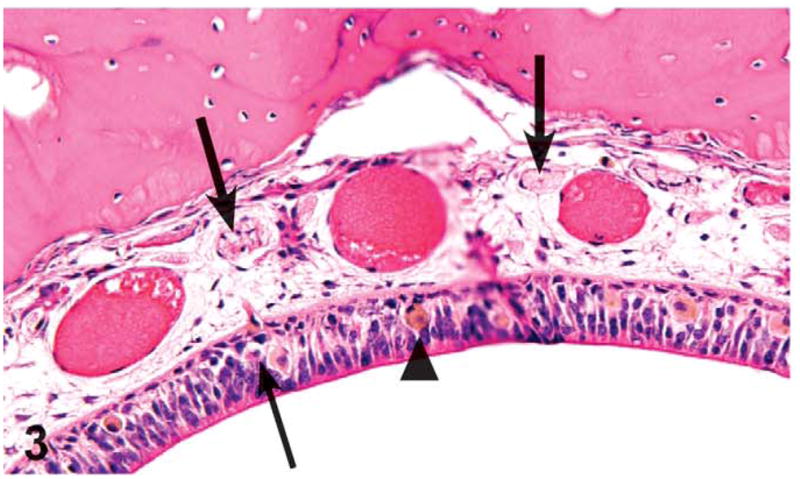
Olfactory epithelium necrosis (thin arrow), atrophy, nerve fiber atrophy (thick arrows), and pigmented histiocytes (arrowhead) in the dorsal meatus of level II of the nasal cavity of a male rat administered with 1,000 mg/kg green tea extract (GTE) by gavage for 3 months. Compare with Figure 4. H&E, X32.
Figure 4.
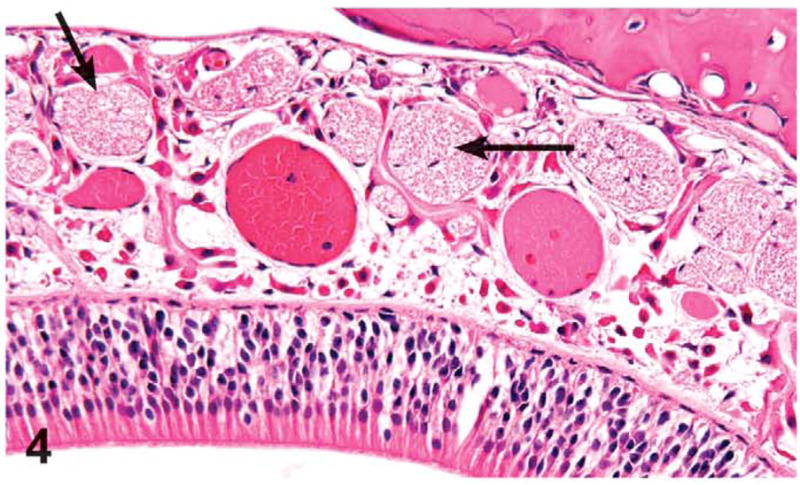
Olfactory epithelium in the dorsal meatus of level II of the nasal cavity of a control rat from the 3-month green tea extract (GTE) gavage study. Note normal size and number of the olfactory nerves in the lamina propria (arrows). H&E, X32.
The presence of golden brown pigment accumulation in the degenerating olfactory epithelium was noted down to the 500 mg/kg dose group in males and the 250 mg/kg dose group in females. Histiocytes in the lamina propria containing golden brown pigment were also present sporadically in high dose males and females. Special stains (Schmorl’s, PAS, Hall’s Bile, and Prussian Blue) were used to determine the composition of the pigment in the olfactory epithelium and the histiocytes in the lamina propria. The pigment in the nose stained positive for Schmorl’s and PAS but negative for Prussian Blue and Hall’s, suggesting that the pigment was composed of a combination of glycoprotein and lipofuscin (Figure 5).
Figure 5.
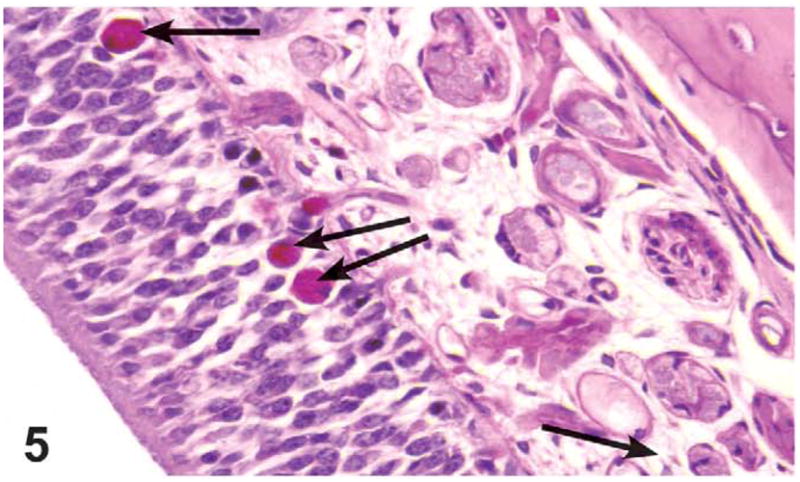
Glycoproteins (PAS)–positive pigment accumulation in olfactory epithelium (arrows) of nasal cavity of a male rat administered 1,000 mg/kg green tea extract (GTE) by gavage for 3 months. The pigment was also positive for ceroid lipofuscin (Schmorl’s staining). PAS, X40.
Increased incidences of respiratory epithelial hyperplasia were diagnosed in the males treated with 500 and 1,000 mg/kg; the increase was statistically significant only in the 1,000 mg/kg males. Individual cases were seen in the females treated with 250 and 500 mg/kg. This change was characterized by the presence of greater than three cell layers of non-ciliated cuboidal epithelium in level I and occasionally II and involving nasal septum or lateral wall.
Squamous metaplasia of the respiratory epithelium was noted in a high-dose male and was characterized by the transformation of the single layer of tall columnar epithelial cells to a 4- to 9-layer thick keratinized epithelium unilaterally in level II along the ventral portion of the nasal septum.
Basal cell hyperplasia of the olfactory epithelium was diagnosed in one 1,000 mg/kg male, one 500 mg/kg male, and one 250 mg/kg female. Basal cell hyperplasia was characterized by a minimal proliferation (2–3 cells thick) of basal cells at the margin of the lamina propria and the olfactory epithelium in the dorsal meatus (Figure 6).
Figure 6.
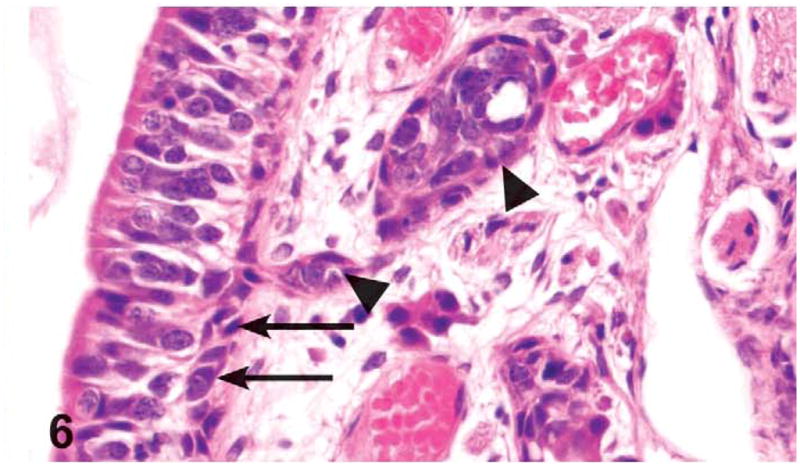
Basal cell hyperplasia (arrows) and Bowman’s gland hyperplasia (arrowheads) in the olfactory epithelium lining the dorsal meatus of level III of the nasal cavity of a male rat administered 1,000 mg/kg green tea extract (GTE) by gavage for 3 months. The basal cell hyperplasia is characterized by minimal proliferation (2–3 cells thick) of basal cells. The Bowman’s gland hyperplasia is characterized by nodular proliferation of cells that compressed and occasionally filled glandular lumina. H&E, X40.
Hyperplasia of the Bowman’s glands in the olfactory epithelium was significantly increased in the 1,000 mg/kg males and females and was also seen in the 500 mg/kg males and down to the 250 mg/kg dose level in females. Bowman’s gland hyperplasia was characterized by nodular proliferation of cells that compressed and occasionally filled glandular lumina. This finding was most frequent in the dorsal meatus or upper portion of septum in level II and occasionally in level III (Figure 6).
Pharyngeal duct degeneration with and without inflammation was noted at level III in three 1,000 mg/kg males, three 500 mg/kg males, and two 500 mg/kg females. Pharyngeal duct degeneration was characterized by decreased goblet cells and transformation of tall columnar ciliated epithelial cells to a more attenuated or cuboidal cells. If present, the inflammatory infiltrate was largely composed of neutrophils with fewer mononuclear cells (Figures 7 and 8).
Figure 7.
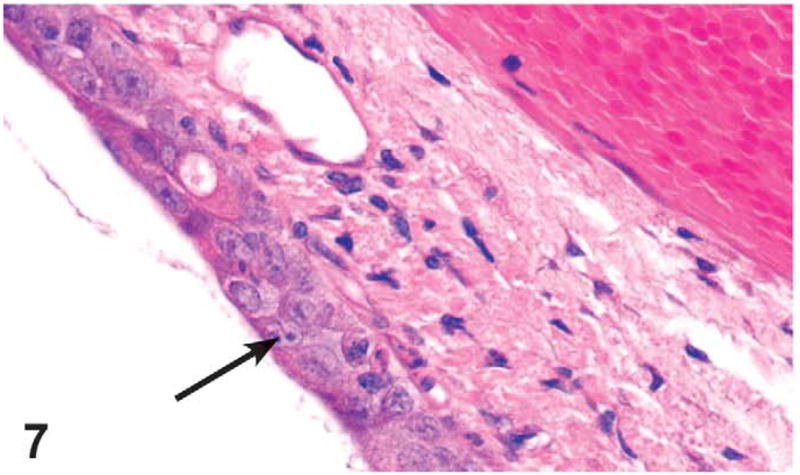
Nasopharyngeal duct degeneration (arrow) located at level III of the nasal cavity of a male rat administered 500 mg/kg GTE by gavage for 3 months. The degeneration is characterized by decreased goblet cell numbers and transformation of tall columnar ciliated epithelial cells to more attenuated or cuboidal cells. Compare with Figure 8. H&E, X4.
Figure 8.
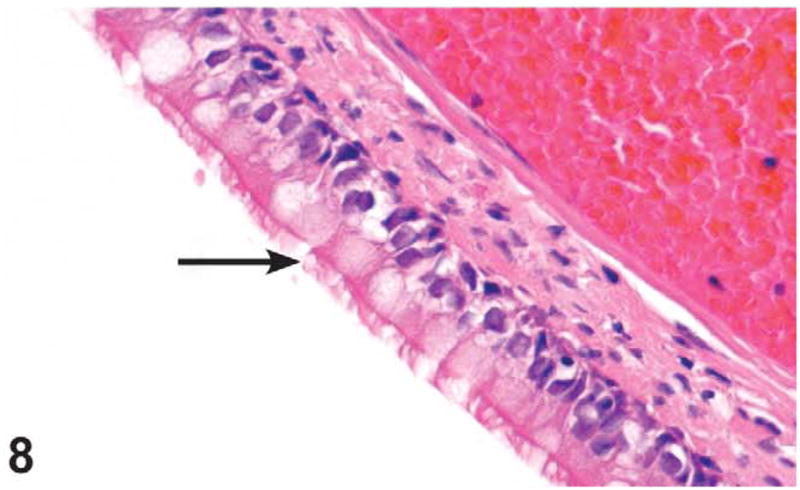
Tall columnar, ciliated epithelium lining the nasopharyngeal duct (arrow) in level III of the nasal cavity of a male control rat from the 3-month green tea extract (GTE) gavage study. H&E, X40.
Mesenteric Lymph Node
Atrophy was seen in a single female treated with 1,000 mg/kg and was characterized by loss of lymphocytes and numerous lymphocytes undergoing apoptosis in the paracortex.
Thymus
Minimal thymic atrophy was significantly increased in 1,000 mg/kg males and females. Thymic atrophy was characterized by variable thinning of the cortex due to loss of T cell lymphocytes by apoptosis.
Mice
Clinical Observations
The only treatment-related clinical observations consisted of signs of lethargy, abnormal breathing, and/or ataxia, which were noted in early death 1,000 mg/kg GTE females.
Survival, Body and Organ Weights
Six 1,000 mg/kg GTE males died before the end of the study, and four 1,000 mg/kg GTE females were sacrificed in a moribund condition before the end of the study. All other animals survived until scheduled sacrifice. The cause of early death in high-dose female and male mice was liver necrosis.
Table 4 summarizes the effects of GTE on terminal body and selected organ weights in the 14-week study in mice. Mean terminal body weights were lower in treated than control mice, seen in 250 mg/kg and higher doses in the males and 125 mg/kg and higher doses in female mice in a generally dose-dependent fashion. There were treatment-related changes in terminal liver weights for groups that received ≥250 mg/kg.
Table 4.
Weight and selected organ weights of male and female B6C3F1 mice administered green tea extract (GTE) by gavage for 14 weeks.
| Parameter | GTE (mg/kg)
|
|||||
|---|---|---|---|---|---|---|
| 0 | 62.5 | 125 | 250 | 500 | 1,000 | |
| Males | ||||||
| Terminal body weight (g) | 40.7 ± 3.2 | 38.5 ± 3.5 | 39.4 ± 3.3 | 35.4 ± 2.8** | 34.1 ± 2.8** | 30.8 ± 1.8** |
| Organ weight (g) | ||||||
| Liver | 1.789 ± 0.173 | 1.743 ± 0.196 | 1.664 ± 0.232 | 1.462 ± 0.147** | 1.49 ± 0.171** | 1.51 ± 0.189 |
| Spleen | 0.069 ± 0.006 | 0.071 ± 0.008 | 0.072 ± 0.013 | 0.067 ± 0.004 | 0.067 ± 0.005 | 0.072 ± 0.007 |
| Organ to body weight ratio (mg organ weight/g body weight) | ||||||
| Liver | 4.391 ± 0.17 | 4.521 ± 0.229 | 4.208 ± 0.288 | 4.121 ± 0.17 | 4.359 ± 0.239 | 4.887 ± 0.388** |
| Spleen | 0.171 ± 0.008 | 0.185 ± 0.014* | 0.183 ± 0.028 | 0.19 ± 0.015** | 0.198 ± 0.017** | 0.234 ± 0.017** |
| Right kidney | 0.754 ± 0.044 | 0.809 ± 0.041* | 0.779 ± 0.043 | 0.819 ± 0.05* | 0.794 ± 0.057 | 0.957 ± 0.048** |
| Right testis | 0.293 ± 0.028 | 0.307 ± 0.027 | 0.302 ± 0.022 | 0.337 ± 0.025** | 0.35 ± 0.032** | 0.379 ± 0.034** |
| Females | ||||||
| Terminal body weight (g) | 30.4 ± 2 | 32.9 ± 3.5 | 26.6 ± 2.3** | 26.8 ± 2.3** | 24.3 ± 1.4** | 26.2 ± 0.7** |
| Organ weight (g) | ||||||
| Liver | 1.228 ± 0.083 | 1.39 ± 0.137** | 1.146 ± 0.118 | 1.088 ± 0.084* | 1.036 ± 0.095** | 1.362 ± 0.08 |
| Spleen | 0.078 ± 0.007 | 0.094.011** | 0.081 ± 0.013 | 0.079 ± 0.01 | 0.076 ± 0.011 | 0.089 ± 0.011 |
| Right kidney | 0.167 ± 0.011 | 0.183 ± 0.009* | 0.161 ± 0.014 | 0.16 ± 0.01 | 0.158 ± 0.018 | 0.171 ± 0.015 |
| Organ to body weight ratio (mg organ weight/g body weight) | ||||||
| Liver | 4.049 ± 0.225 | 4.225 ± 0.131 | 4.31 ± 0.141 | 4.071 ± 0.308 | 4.226 ± 0.238 | 5.203 ± 0.302** |
| Spleen | 0.259 ± 0.025 | 0.288 ± 0.046 | 0.308 ± 0.049* | 0.294 ± 0.038 | 0.314 ± 0.039* | 0.339 ± 0.046** |
| Right kidney | 0.55 ± 0.044 | 0.561 ± 0.059 | 0.608 ± 0.05 | 0.601 ± 0.054 | 0.649 ± 0.049** | 0.654 ± 0.067** |
Values are mean ± standard error. Ten animals were evaluated in each group.
Differs from the control group at p ≤ .05.
p ≤ .01.
Hematology
No abnormalities were identified in the hematology evaluations that were attributable to administration of GTE (data not shown).
Histopathology
Treatment-related lesions were seen in the liver, nose, thymus, and mesenteric lymph nodes (Tables 5 and 6).
Table 5.
Incidence and average severitya of selected non-neoplastic lesions in male mice in the 14-week gavage study with green tea extract (GTE).
| Parameter | GTE (mg/kg)
|
|||||
|---|---|---|---|---|---|---|
| 0 | 62.5 | 125 | 250 | 500 | 1,000 | |
| Alimentary system | ||||||
| Intestine large, colon | ||||||
| Peyer’s patch, atrophy | 0 | 0 | 0 | 0 | 0 | 1 (1.0) |
| Intestine small, ileum | ||||||
| Peyer’s patch, atrophy | 0 | 0 | 0 | 0 | 0 | 2 (2.0) |
| Liver | ||||||
| Depletion glycogen | 2 (1.0) | 0 | 2 (1.5) | 8 (1.5)* | 10 (1.7)** | 4 (2.5) |
| Karyomegaly | 0 | 0 | 0 | 0 | 0 | 2 (1.0) |
| Mitosis | 0 | 0 | 0 | 0 | 0 | 3 (1.3) |
| Pigmentation | 0 | 0 | 0 | 0 | 0 | 2 (1.0) |
| Centrilobular, necrosis | 0 | 0 | 2 (1.0) | 0 | 0 | 8 (3.1)** |
| Hematopoietic system | ||||||
| Lymph node, mandibular | ||||||
| Atrophy | 1 (1.0) | 0 | 0 | 0 | 2 (1.0) | 7 (1.9)** |
| Lymph node, mesenteric | ||||||
| Atrophy | 4 (1.0) | 0* | 0* | 0* | 2 (1.0) | 8 (1.4) |
| Thymus | ||||||
| Atrophy | 0 | 0 | 0 | 0 | 0 | 6 (3.3)** |
| Respiratory system | ||||||
| Nose | ||||||
| Glands, olfactory epithelium, hyperplasia | 0 | 0 | 0 | 0 | 0 | 3 (1.3) |
| Lamina propria, pigmentation, histiocytes | 0 | 0 | 0 | 0 | 0 | 1 (1.0) |
| Nerve, atrophy | 0 | 0 | 0 | 5 (1.2)* | 7 (1.1)** | 5 (1.8)* |
| Olfactory epithelium, atrophy | 0 | 1 (1.0) | 0 | 4 (1.3)* | 4 (1.8)* | 4 (1.3)* |
| Olfactory epithelium, hyperplasia, basal cell | 0 | 0 | 0 | 0 | 0 | 3 (2.3) |
| Olfactory epithelium, metaplasia | 0 | 0 | 0 | 5 (1.0)* | 5 (1.2)* | 5 (2.2)* |
| Olfactory epithelium, necrosis | 0 | 0 | 1 (3.0) | 0 | 1 (3.0) | 3 (1.7) |
| Olfactory epithelium, pigmentation | 0 | 0 | 0 | 0 | 0 | 1 (1.0) |
| Respiratory epithelium, hyaline droplet | 0 | 0 | 0 | 0 | 1 (1.0) | 3 (1.0) |
| Respiratory epithelium, hyperplasia | 0 | 0 | 0 | 0 | 0 | 3 (1.0) |
| Respiratory epithelium, metaplasia, squamous | 0 | 0 | 0 | 0 | 0 | 1 (2.0) |
| Respiratory epithelium, necrosis | 0 | 0 | 0 | 0 | 1 (4.0) | 1 (2.0) |
Ten animals were evaluated in each group. Values represent incidences (average severity).
The severity of each lesion was graded from minimal to marked (1–4).
Incidence differs from the control group at p < .05.
p < .01.
Table 6.
Incidence and average severitya of selected non-neoplastic lesions in female mice in the 14-week gavage study with green tea extract (GTE).
| Parameter | GTE (mg/kg)
|
|||||
|---|---|---|---|---|---|---|
| 0 | 62.5 | 125 | 250 | 500 | 1,000 | |
| Alimentary system | ||||||
| Intestine large, cecum | ||||||
| Peyer’s patch, atrophy | 0 | 0 | 0 | 0 | 0 | 1 (1.0) |
| Intestine small, ileum | ||||||
| Peyer’ patch, atrophy | 0 | 0 | 0 | 0 | 0 | 2 (2.5) |
| Liver | ||||||
| Depletion glycogen | 0 | 0 | 0 | 1 (1.0) | 4 (1.5)* | 7 (2.1)** |
| Fatty change | 0 | 0 | 0 | 0 | 0 | 1 (2.0) |
| Inflammation, chronic | 0 | 0 | 0 | 0 | 0 | 3 (2.0) |
| Karyomegaly | 0 | 0 | 0 | 0 | 0 | 5 (1.0)* |
| Mitosis | 0 | 0 | 0 | 0 | 0 | 2 (2.0) |
| Pigmentation | 0 | 0 | 0 | 0 | 0 | 2 (1.0) |
| Centrilobular, necrosis | 0 | 0 | 0 | 0 | 0 | 7 (2.4)** |
| Hematopoietic system | ||||||
| Lymph node, mandibular | ||||||
| Atrophy | 0 | 0 | 0 | 2 (1.0) | 2 (1.5) | 4 (2.0)* |
| Lymph node, mesenteric | ||||||
| Atrophy | 2 (1.0) | 0 | 0 | 0 | 2 (1.5) | 3 (2.3)b |
| Spleen | ||||||
| Atrophy, lymphoid | 0 | 0 | 0 | 1 (1.0) | 4 (1.0)* | 4 (2.8)* |
| Thymus | ||||||
| Atrophy | 0 | 0 | 0 | 0 | 0 | 4 (3.3)* |
| Necrosis | 0 | 0 | 0 | 0 | 0 | 2 (3.0) |
| Respiratory system | ||||||
| Nose | ||||||
| Glands, olfactory epithelium, hyperplasia | 0 | 0 | 0 | 0 | 0 | 1 (1.0) |
| Nasopharyngeal duct, degeneration | 0 | 0 | 0 | 0 | 0 | 1 (1.0) |
| Nerve, atrophy | 0 | 0 | 1 (1.0) | 1 (1.0) | 7 (1.3)** | 5 (1.4)* |
| Olfactory epithelium, atrophy | 0 | 0 | 1 (2.0) | 0 | 4 (1.0)* | 4 (1.8)* |
| Olfactory epithelium, hyperplasia, basal cell | 0 | 0 | 0 | 0 | 0 | 1 (2.0) |
| Olfactory epithelium, metaplasia | 0 | 0 | 1 (1.0) | 1 (1.0) | 7 (1.6)** | 6 (1.3)** |
| Olfactory epithelium, necrosis | 0 | 0 | 0 | 0 | 1 (1.0) | 4 (1.5)* |
| Respiratory epithelium, hyaline droplet | 0 | 0 | 0 | 1 (2.0) | 4 (1.8)* | 0 |
| Respiratory epithelium, hyperplasia | 0 | 0 | 0 | 0 | 0 | 2 (2.0) |
| Respiratory epithelium, metaplasia, squamous | 0 | 0 | 0 | 0 | 0 | 1 (1.0) |
| Respiratory epithelium, necrosis | 0 | 0 | 0 | 0 | 0 | 1 (3.0) |
Ten animals were evaluated in each group. Values represent incidences (average severity).
The severity of each lesion was graded from minimal to marked (1–4).
Nine animals were evaluated for this organ in this dose group.
Incidence differs from the control group at p < .05.
p < .01.
Liver
Treatment-related liver lesions were limited to the males and females treated with the 1,000 mg/kg dose and consisted of hepatocellular necrosis, fatty change, glycogen depletion, pigment, increased mitosis, karyomegaly, and chronic inflammation.
Glycogen depletion above control levels was noted in the 250, 500, and 1,000 mg/kg dose groups in male mice and in the 500 and 1,000 mg/kg dose groups in female mice.
Liver necrosis was present in high dose male and female mice. The liver necrosis in severely affected animals was characterized by a centrilobular to panlobular necrosis and hemorrhage (Figure 9). Occasionally in female mice, hepatocytes adjacent to necrotic areas, typically between centrilobular and periportal regions, were vacuolated, characteristic of fatty change. In the livers with minimal to mild necrosis, there were more individualized hepatocytes undergoing apoptotic necrosis with minimal to no inflammation. If inflammatory cells were present, they were usually macrophages, lymphocytes, and plasma cells. Hepatocytes were characterized by pyknotic, condensed nuclei and shrunken, eosinophilic cytoplasm. Chronic inflammation was seen sporadically only in the females treated with 1,000 mg/kg. This change consisted of infiltration of mono-nuclear cells present in the areas of hepatocellular necrosis.
Figure 9.
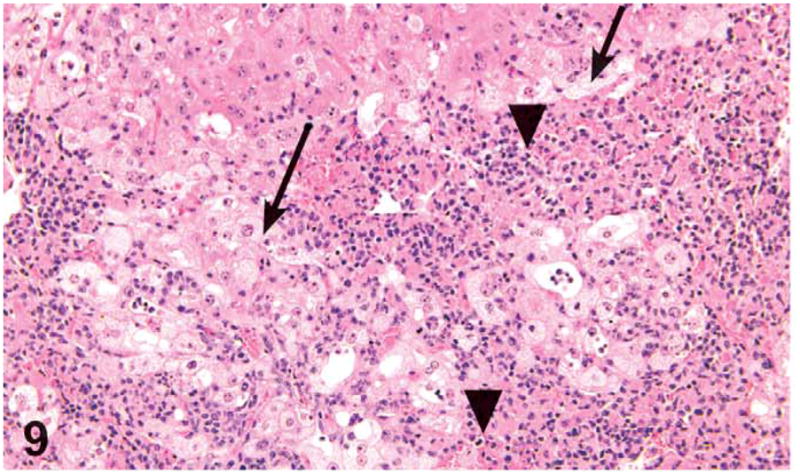
Centrilobular hepatocellular necrosis (arrowheads) and fatty change (arrows) in a male mouse administered 1,000 mg/kg green tea extract (GTE) by gavage. H&E, X20.
Increased mitosis was noted in hepatocytes of high-dose male and female mice. It was characterized by the presence of hepatocytes with mitotic figures in the intervening region between centrilobular and the periportal regions.
Accumulation of golden brown cytoplasmic pigment was present in the Kupffer cells of few high-dose male and female mice, which might represent lipofuscin. Special stains were not performed on mouse liver sections. However, a similar pigment was found in the rat livers as a treatment-related effect and was considered to be a combination of ceroid lipofuscin, iron, and glycoprotein.
Minimal karyomegaly was noted in a few male and female mice (more frequently seen in the females) treated with 1,000 mg/kg. Minimal karyomegaly was diagnosed when a section contained 10–50 enlarged nuclei per section. Karyomegaly was not diagnosed if there were significant, concurrent hepatocyte damage, necrosis, or cell swelling due to fatty change. The karyomegalic hepatocytes were reported in mice having minimal levels of necrosis and were located in the midzonal regions between centrilobular and periportal areas. The nuclei were 2.5- to 3-fold larger than the normal size and had clumped chromatin or intranuclear vacuoles (which most likely represent invaginations of nuclear membrane) (Figure 10).
Figure 10.
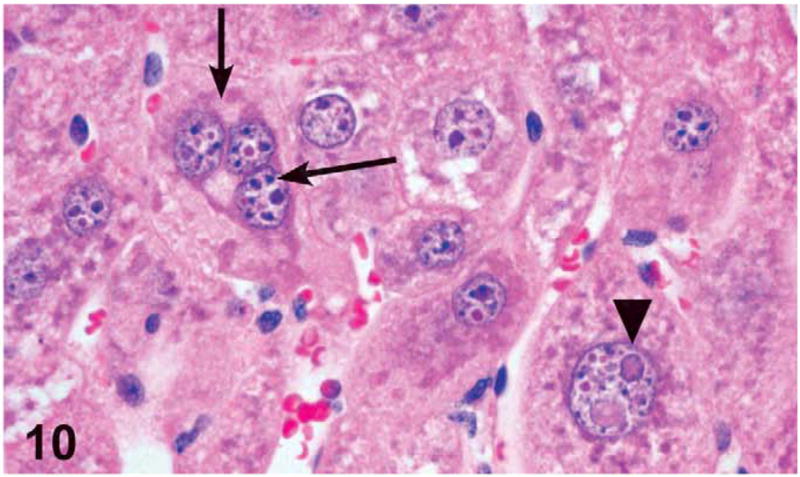
Hepatocyte karyomegaly (arrowhead) and tri-nucleated hepatocyte (arrows) in a male mouse administered 1,000 mg/kg green tea extract (GTE) by gavage for 3 months. H&E, X60.
Nose
Dose-related findings in the nose were seen in both sexes treated with 62.5 mg/kg and higher in males and 125 mg/kg and higher in females.
The most frequent lesions in the nasal cavity were olfactory epithelium atrophy, olfactory nerve atrophy, and metaplasia of olfactory epithelium to respiratory epithelium. The lesions were focal to locally extensive and frequently bilateral and/or involved levels II and III. Olfactory epithelial atrophy was found in the 62.5 mg/kg and above treatment level in the males and in the 125 mg/kg and above in the females. Olfactory epithelial atrophy was characterized by thinning of the layers of olfactory epithelial cells, especially in the dorsal meatus, compared with controls (Figure 11). Olfactory nerve atrophy was noted by the loss of olfactory nerve bundles in the submucosal regions underlying the olfactory epithelium in the dorsal meatus of level II and nasal turbinates of level III. Atrophy was most notable in the dorsal and dorsolateral meatus. Nerve atrophy was frequently accompanied by olfactory epithelial metaplasia characterized by the transition of olfactory epithelium to respiratory epithelium. Olfactory epithelial metaplasia and olfactory nerve atrophy were found in the 250 mg/kg dose level and above in the males and in the 125 mg/kg dose level and above in females. In males treated with 1,000 mg/kg, these findings in the olfactory epithelium were sporadically accompanied by golden brown pigment accumulations within single histiocytes or aggregates of histiocytes located in the lamina propria of the dorsal or dorsolateral meatus (levels II or III) and/or pigment accumulation consistent with lipofuscin in the cytoplasm of olfactory epithelial cells.
Figure 11.
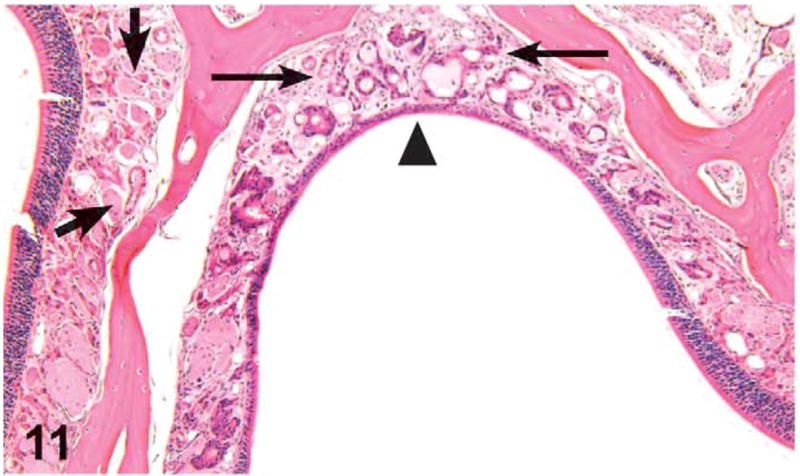
Unilateral olfactory epithelium atrophy (arrowhead), olfactory nerve atrophy (thin arrows), and metaplasia of olfactory epithelium to respiratory epithelium in the dorsal meatus of level III in a male mouse administered 1,000 mg/kg green tea extract (GTE) by gavage for 3 months. Note the normal aspect of the olfactory nerves in the lamina propria of the unaffected side (thick arrows). H&E, X16.
There was a dose-related pattern in the incidences of olfactory epithelial necrosis in the males treated with 125, 500, and 1,000 mg/kg and in the females treated with 500 and 1,000 mg/kg. This change was characterized by loss of olfactory sensory epithelial cells or pyknosis and karyorrhexis of olfactory epithelial nuclei with infiltrates of neutrophils and lesser numbers of lymphocytes and plasma cells.
Respiratory epithelial necrosis was noted sporadically in the males treated with 500 and 1,000 mg/kg, and in the females treated with 1,000 mg/kg. This change was characterized by loss of respiratory epithelial cells, or pyknosis and karyorrhexis of respiratory epithelial nuclei, and sloughing of necrotic cells admixed with infiltrates of degenerative and viable neutrophils and lesser numbers of lymphocytes and plasma cells and cell debris.
Basal cell hyperplasia of the olfactory epithelium was sporadically seen in males and females treated with 1,000 mg/kg (more frequent among the males), located in the dorsal meatus of level II and level III. There was an increased number of basal cells, and instead of a single layer of basophilic nuclei, they were frequently piled up or crowded and extended up into the olfactory cells.
Occasionally, hyperplastic cuboidal cells extended to the Bowman’s glands, which appeared as nodular proliferation of cells underlying the olfactory epithelium. The proliferating basal cells frequently obscured the lumen of the Bowman’s glands. These changes were defined as Bowman’s gland hyperplasia (Figure 12) and were noted in 3 males and 1 female from the 1,000 mg/kg dose groups.
Figure 12.
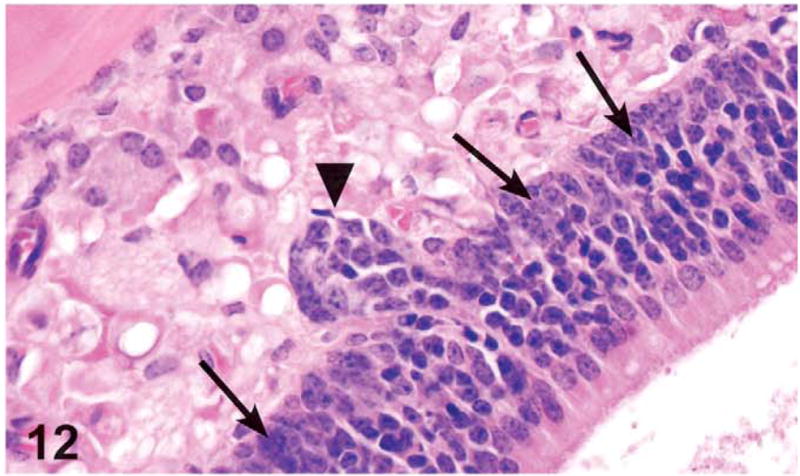
Basal cell hyperplasia (arrows) and Bowman’s gland hyperplasia (arrowhead) in the olfactory epithelium in the dorsal meatus of level III in a male mouse administered 1,000 mg/kg green tea extract (GTE) by gavage for 3 months. Note the increased number of basal cells. Instead of a single layer of basophilic nuclei, the nuclei are piled up or crowded and extend up into the olfactory cells. The Bowman’s gland hyperplasia is characterized by nodular proliferation of cells that compressed and occasionally filled glandular lumina in the lamina propria underlying or continuous with the olfactory epithelium. H&E, X40.
A dose-related increase in hyaline droplet accumulation was noted in males treated with 500 mg/kg and 1,000 mg/kg and in females treated with 250 and 500 mg/kg. This lesion was located in the respiratory epithelium at levels I and II.
Lymphoid Organs
Dose-related increases in the incidence and severity of lymphoid atrophy in the spleen were noted in the females treated with 250 mg/kg and higher. Splenic lymphoid atrophy was characterized by decreased cellularity of the white pulp, in particular, the loss of B cell lymphocytes in the germinal centers and the coronal follicles and loss of T cell lymphocytes in the periarteriolar lymphoid sheaths (Figures 13 and 14).
Figure 13.
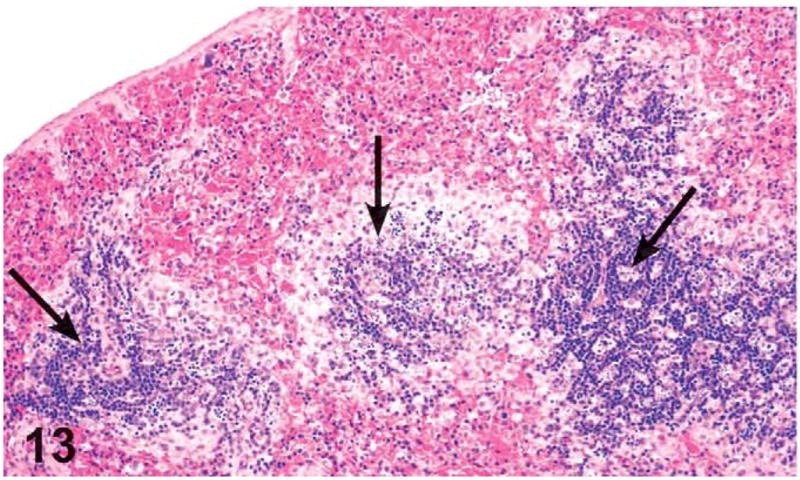
Splenic white pulp atrophy. The arrows indicate reduced lymphoid cells in the periarteriolar lymphoid sheath corona and marginal zone of the white pulp in a female mouse administered 1,000 mg/kg green tea extract (GTE) by gavage for 3 months. H&E, X10. Compare with Figure 14.
Figure 14.
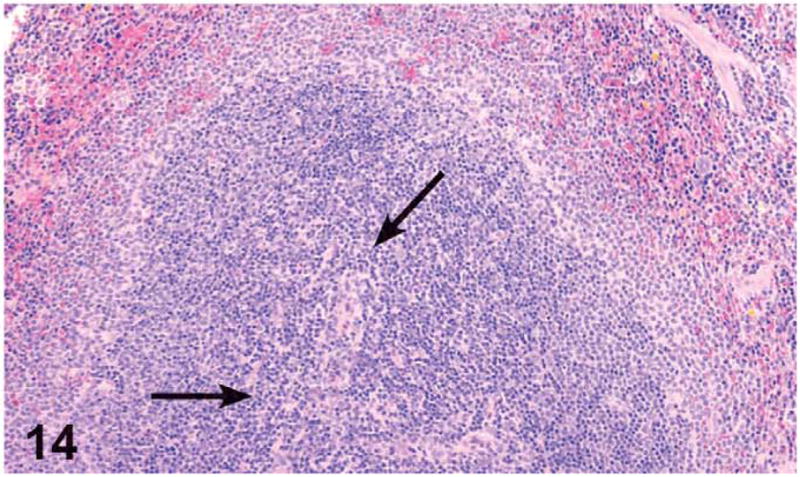
Aspect of the splenic white pulp, and in particular the periarteriolar lymphoid sheaths (arrows), in a control female mouse from the 3-month green tea extract (GTE) gavage. H&E, X4.
Increased incidences and severity of mesenteric lymph node atrophy were noted in both sexes treated with the 1,000 mg/kg, with the males being more frequently affected. Atrophy of the T lymphocytes in the paracortex and B cells of the follicles of the mesenteric lymph node was characterized by loss of lymphocytes with evidence of lymphocyte apoptosis manifested as condensed nuclear chromatin and cytoplasm and nuclear pyknosis and karyorrhexis. Increased incidences and severities of mandibular lymph node atrophy were noted in the females treated with 250 mg/kg and higher and in the males treated with 500 and 1,000 mg/kg. Atrophy of the T lymphocytes in the paracortex and B cells of the follicles of the mandibular lymph node was characterized by loss of lymphocytes, lymphocytes with apoptotic bodies, similar in appearance to those described in the mesenteric lymph nodes.
Mild to severe thymic atrophy was noted in the males and females treated with 1,000 mg/kg. The atrophy was characterized by variable thinning of the cortex due to loss of T cell lymphocytes by apoptosis. Minimal to moderate atrophy of the Peyer’s patches located in the ileum, cecum, and/or colon was noted in few male and female animals treated with 1,000 mg/kg. This change was characterized by lymphoid depletion and apoptosis.
Discussion
In the present study, the toxicological effects of GTE in mice and rats included increased activity; decreased body weight gain; and histopathological lesions in the liver, nose, spleen, lymph nodes, and thymus. F344 rats also had decreased thymus weights. In addition, B6C3F1 mice showed increased mortality and increased liver-to-body weight ratios. The changes in the liver and nose were considered primary toxic effects of GTE, while the changes in other organs were considered to be secondary to high-dose, stress-related effects.
Decreased body weight gain after green tea consumption has previously been demonstrated in both animals and humans (Dulloo et al. 1999; Kao, Hiipakka, and Liao 2000; Monteiro et al. 2008;C. H. Wu et al. 2003). In our study, male rats were more severely affected, which is consistent with previous studies (Raederstorff et al. 2003; Takami et al. 2008;S. N. Williams, Pickwell, and Quattrochi 2003; Yoshino et al. 1994). The mechanism behind this weight reduction is unknown and may include such factors as changes in food consumption, inhibition of intestinal lipid absorption (Ikeda et al. 2005, 1992; Takami et al. 2008;T. T. Yang and Koo 2000; Yokozawa, Nakagawa, and Kitani 2002), an increase in the expenditure of energy (Dulloo et al. 1999), and stimulation of lipid oxidation (Dulloo et al. 1999; Murase et al. 2002). Recently, a new mechanism was proposed, suggesting that GTE causes an increase in aromatase expression (Monteiro et al. 2008).
Hepatic toxicity, observed in both rats and mice in this study, was one of the most significant effects. In mice, significant hepatic toxicity, including necrosis, was observed in the majority of the high-dose males and females. The hepatic toxicity was likely responsible for the early deaths observed in this group as well as accompanying morbidity and ruffled fur. In rats, hepatic toxicity was observed in a limited number of high-dose female rats. There are conflicting reports on the effects of green tea or its ingredients on the liver in vivo and in vitro. Several studies reported a protective effect of green tea on the liver in mice and rats, mainly by its proposed antioxidant effects (J. H. Chen et al. 2004; Dobrzynska et al. 2004; Fiorini et al. 2005; Zhang et al. 2006). Other studies reported an antineoplastic effect in the liver by inducing apoptosis of neoplastic cells in hepatocellular carcinomas (Nishikawa et al. 2006). Though some studies failed to show any adverse hepatic effects following administration of green tea to mice, rats, and dogs (Bun et al. 2006; Isbrucker et al. 2006; Liao et al. 1995), there are many reports of green tea–induced hepatic toxicity, both in vitro and in vivo. Goodin and Rosengren (2003) reported severe hepatic necrosis, resulting in death, in female Swiss-Webster mice administered EGCG. The results of this study are consistent with their previous report of mild hepatotoxicity induced in C57B1/6 female mice (Goodin et al. 2002). Polyphenon E, a decaffeinated green tea catechin mixture containing about 50% EGCG, was also found to cause hepatic necrosis in Swiss-Webster mice (Chang et al. 2003). Green tea polyphenols and EGCG also caused hepatic necrosis in rats (Johnson et al. 1999; McCormick et al. 1999).
As mentioned above, the etiology of the hepatotoxicity is still unknown. However, it was suggested that the components responsible for the hepatotoxicity are the catechins and their gallic acid esters, predominantly EGCG (Mazzanti et al. 2009). It was proposed that the hepatotoxicity was due to oxidative stress, induced in the liver by EGCG or its metabolites.
In the present study, a slight tendency toward increased susceptibility of females to hepatotoxicity was noted. In rats, findings in the liver were seen only in females; and in mice, the females, but not males, exhibited clinical abnormalities before dying. Sex-dependent effects of EGCG-mediated hepatic toxicity were demonstrated in Balb/c mice, where females were much more susceptible to the toxic effects (Goodin, Bray, and Rosengren 2006). In addition, sex-specific differences in cytochrome P450 (CYP450) isoform modulation following administration of EGCG and epigallocatechin gallate to Swiss Webster mice were shown (Goodin, Bray, and Rosengren 2006). Interestingly, increased female susceptibility to green tea–induced hepatotoxicity was also suggested in humans, possibly because of different genetic factors (Mazzanti et al. 2009).
The most sensitive organ for detecting GTE toxicity was the nose, both in rats and in mice. This is the first time that nasal toxicity has been observed following green tea administration. It is reasonable to believe that the lesions in the olfactory system were at least in part responsible for the decreased body weight gain observed. Such lesions lead to changes in the animals’ ability to smell, and consequently to taste, culminating in decreased ability to acquire food (Lock and Harpur 1992). In line with this assumption, the nasal lesions were generally more severe in the male rats, correlating to the more pronounced decreased body weight gain.
Nasal toxicity is more common following inhalation studies; however, noninhalation routes of administration can also lead to nasal lesions by exposure through the bloodstream to the tested compound or its metabolites (Sells et al. 2007). In addition, the nasal epithelium itself is recognized as a major metabolizing organ, demonstrating significant enzymatic activity (Bogdanffy 1990; Dahl and Hadley 1991; Reed 1993). For example, very active cytochrome P450 enzymes are present in the nasal epithelium, as well as glutathione S-transferase, carboxylesterases, aldehyde and formaldehyde dehydrogenase, and flavin monoxygenases (Lock and Harpur 1992). Metabolic activity could explain the distribution of lesions in the nasal cavity (Sells et al. 2007). In our study, the olfactory epithelium was affected more severely than the respiratory epithelium, which corresponds to the levels of enzymatic activity in these epithelial types, the olfactory epithelium having the higher levels (Walsh and Courtney 1998). The concentration of CYP450 in the respiratory mucosa is only 25% of that in the olfactory mucosa (Thornton-Manning and Dahl 1997).
The ability of green tea compounds to alter the activity of CYP450 has been demonstrated in various organs, either in human cell lines or in animals. Among the CYP450s that were found to be altered are CYP1A1, CYP1A2, CYP3A4, and CYP4A1 (Allen et al. 2001; Anger, Petre, and Crankshaw 2005; Bu-Abbas et al. 1994;L. Chen et al. 1996; Maliakal, Coville, and Wanwimolruk 2001; Nishikawa et al. 2004; Obermeier, White, and Yang 1995; Sohn et al. 1994; Whitlock 1999; S. N. Williams et al. 2000; S. P. Yang and Raner 2005). However, other reports showed little or no effect of green tea on CYP450 activity (Chow et al. 2006; Donovan et al. 2004), and some of the CYP450 altered effects might be attributed to the caffeine component of the tea extracts, a potent inducer of CYP1A2 (Ayalogu et al. 1995; Goasduff et al. 1996). The fact that both the liver and the nasal cavity, two organs rich in metabolic activity, were the major target tissues in this study leads us to believe that metabolism and activation of GTE by CYP450 were, at least in part, responsible for the adverse effects observed. This issue will be of great interest for future studies.
Some of the findings in this study were considered to be secondary effects rather than a direct consequence of GTE toxicity. The increased activity of the rats during the first weeks of the study can be attributed to stimulation by caffeine. The decrease in thymus weight correlated with the atrophy seen in that organ, which was attributed to nonspecific stress related to high dose exposure, as were the microscopic lesions in the spleen and lymph nodes (Pearse 2006).
Human exposure to GTE by habitual consumption of green tea would be very unlikely to reach the toxic concentrations of GTE as observed in our study, since it is estimated that 10 cups of green tea are equivalent to only 2.5 grams of GTE (Fujiki et al. 2002). In addition, the recommended dose of GTE tablets, some of them sold as dietary supplements, is about 1,000 mg/d (Puritan’s Pride, Oakdale, NY). The high dose of 1,000 mg/kg/d in our studies would therefore be equivalent to about 60 to 70 times higher. However, abuse of these supplements may expose humans to much higher concentrations, and indeed, it is interesting to note that the most pronounced effect of GTE exposure in rodents was hepatotoxicity, similar to the effect observed in humans consuming such tablets. Nevertheless, nasal toxicity, which was a pronounced effect observed in our study, was never reported before in humans after exposure to GTE. This difference may stem either from lower levels of exposure in humans, or from the known differences in the amount and expression pattern of the different CYP450 in the oral mucosa between humans and rodents (Ling et al. 2004). Indeed, a comprehensive study had shown that none of several chemicals known to elicit rodent nasal cytotoxicity was associated with a similar toxicity in humans (Jeffrey, Iatropoulos, and Williams 2006).
A limitation of our study is the use of GTE, which is composed of several potentially toxic compounds, and additionally each component in the mixture may have a modifying effect on the other components. Therefore, it is difficult to define which of the GTE constituents is responsible for the toxic effects observed in our study. The picture is even more complex considering the different metabolites that may be formed from each compound, a fact that further complicates the relevance of our findings to humans.
In summary, GTE administered by gavage to mice and rats resulted in direct treatment-related effects in the liver similar to those seen in previous studies in humans and rodents. In addition, this is the first report of toxic effects of green tea in the nose. Secondary effects, attributed to stress, were observed in the spleen, lymph nodes, and thymus. Furthermore, body weight gain was decreased. The no adverse effect level (NOAEL) for the liver in both species was 500 mg/kg. In the nose of rats, the NOAEL in males was 62.5 mg/kg, and in the female no NOAEL was found. No NOAEL was found in the nose of male or female mice. The obvious increased susceptibility of the nose and the liver, both organs rich in active metabolic enzymes, suggests a role for GTE metabolites in the observed toxicity.
Acknowledgments
The authors gratefully acknowledge Dr. Mark Cesta and Dr. June Dunnick from the NTP/NIEHS for their critical review of the article.
This research was supported in part by the Intramural Research Program of the NIH, National Institute of Environmental Health Sciences and Pathology Support for the NIEHS, Contract # N01-ES-55548 (HHSN291200555548C).
Abbreviations
- CYP450
cytochrome P450
- EGCG
epigallocatechin-3-gallate
- GTE
green tea extract
- NOAEL
no adverse effect level
- NTP
National Toxicology Program
- PWG
Pathology Working Group
Footnotes
For reprints and permissions queries, please visit SAGE’s Web site at http://www.sagepub.com/journalsPermissions.nav.
References
- Allen SW, Mueller L, Williams SN, Quattrochi LC, Raucy J. The use of a high-volume screening procedure to assess the effects of dietary flavonoids on human cyp1a1 expression. Drug Metab Dispos. 2001;29:1074–79. [PubMed] [Google Scholar]
- Anger DL, Petre MA, Crankshaw DJ. Heteroactivation of cytochrome P450 1A1 by teas and tea polyphenols. Br J Pharmacol. 2005;145:926–33. doi: 10.1038/sj.bjp.0706255. [DOI] [PMC free article] [PubMed] [Google Scholar]
- Ayalogu EO, Snelling J, Lewis DF, Talwar S, Clifford MN, Ioannides C. Induction of hepatic CYP1A2 by the oral administration of caffeine to rats: lack of association with the Ah locus. Biochim Biophys Acta. 1995;1272:89–94. doi: 10.1016/0925-4439(95)00071-b. [DOI] [PubMed] [Google Scholar]
- Bogdanffy MS. Biotransformation enzymes in the rodent nasal mucosa: the value of a histochemical approach. Environ Health Perspect. 1990;85:177–86. doi: 10.1289/ehp.85-1568341. [DOI] [PMC free article] [PubMed] [Google Scholar]
- Bogovski P, Day N. Accelerating action of tea on mouse skin carcinogenesis. Cancer Lett. 1977;3:9–13. doi: 10.1016/s0304-3835(77)93723-5. [DOI] [PubMed] [Google Scholar]
- Boorman G, Morgan K, Uriah L. Nose, larynx, and trachea. In: Boorman G, Eustis S, Elwell M, Montgomery J, MacKenzie W, editors. Pathology of the Fiscer Rat. Academic Press; San Diego, CA: 1990. pp. 315–38. [Google Scholar]
- Bu-Abbas A, Clifford MN, Walker R, Ioannides C. Selective induction of rat hepatic CYP1 and CYP4 proteins and of peroxisomal proliferation by green tea. Carcinogenesis. 1994;15:2575–79. doi: 10.1093/carcin/15.11.2575. [DOI] [PubMed] [Google Scholar]
- Bun SS, Bun H, Guedon D, Rosier C, Ollivier E. Effect of green tea extracts on liver functions in Wistar rats. Food Chem Toxicol. 2006;44:1108–13. doi: 10.1016/j.fct.2006.01.006. [DOI] [PubMed] [Google Scholar]
- Chang PY, Mirsalis J, Riccio ES, Bakke JP, Lee PS, Shimon J, Phillips S, Fairchild D, Hara Y, Crowell JA. Genotoxicity and toxicity of the potential cancer-preventive agent polyphenon E. Environ Mol Mutagen. 2003;41:43–54. doi: 10.1002/em.10129. [DOI] [PubMed] [Google Scholar]
- Chen JH, Tipoe GL, Liong EC, So HS, Leung KM, Tom WM, Fung PC, Nanji AA. Green tea polyphenols prevent toxin-induced hepatotoxicity in mice by down-regulating inducible nitric oxide-derived prooxidants. Am J Clin Nutr. 2004;80:742–51. doi: 10.1093/ajcn/80.3.742. [DOI] [PubMed] [Google Scholar]
- Chen L, Bondoc FY, Lee MJ, Hussin AH, Thomas PE, Yang CS. Caffeine induces cytochrome P4501A2: induction of CYP1A2 by tea in rats. Drug Metab Dispos. 1996;24:529–33. [PubMed] [Google Scholar]
- Chow HH, Cai Y, Hakim IA, Crowell JA, Shahi F, Brooks CA, Dorr RT, Hara Y, Alberts DS. Pharmacokinetics and safety of green tea polyphenols after multiple-dose administration of epigallocatechin gallate and polyphenon E in healthy individuals. Clin Cancer Res. 2003;9:3312–19. [PubMed] [Google Scholar]
- Chow HH, Hakim IA, Vining DR, Crowell JA, Cordova CA, Chew WM, Xu MJ, Hsu CH, Ranger-Moore J, Alberts DS. Effects of repeated green tea catechin administration on human cytochrome P450 activity. Cancer Epidemiol Biomarkers Prev. 2006;15:2473–76. doi: 10.1158/1055-9965.EPI-06-0365. [DOI] [PubMed] [Google Scholar]
- Correa A, Stolley A, Liu Y. Prenatal tea consumption and risks of anencephaly and spina bifida. Ann Epidemiol. 2000;10:476–7. doi: 10.1016/s1047-2797(00)00144-7. [DOI] [PubMed] [Google Scholar]
- Dahl AR, Hadley WM. Nasal cavity enzymes involved in xenobiotic metabolism: effects on the toxicity of inhalants. Crit Rev Toxicol. 1991;21:345–72. doi: 10.3109/10408449109019571. [DOI] [PubMed] [Google Scholar]
- Dobrzynska I, Sniecinska A, Skrzydlewska E, Figaszewski Z. Green tea modulation of the biochemical and electric properties of rat liver cells that were affected by ethanol and aging. Cell Mol Biol Lett. 2004;9:709–21. [PubMed] [Google Scholar]
- Donovan JL, Chavin KD, Devane CL, Taylor RM, Wang JS, Ruan Y, Markowitz JS. Green tea (Camellia sinensis) extract does not alter cytochrome p450 3A4 or 2D6 activity in healthy volunteers. Drug Metab Dispos. 2004;32:906–8. doi: 10.1124/dmd.104.000083. [DOI] [PubMed] [Google Scholar]
- Dulloo AG, Duret C, Rohrer D, Girardier L, Mensi N, Fathi M, Chantre P, Vandermander J. Efficacy of a green tea extract rich in catechin polyphenols and caffeine in increasing 24-h energy expenditure and fat oxidation in humans. Am J Clin Nutr. 1999;70:1040–45. doi: 10.1093/ajcn/70.6.1040. [DOI] [PubMed] [Google Scholar]
- Dunn O. Multiple comparisons using rank sums. Technometrics. 1964;6:241–52. [Google Scholar]
- Dunnett C. A multiple comparison procedure for comparing several treatments with a control. J Am Stat Assoc. 1955;50:1096–1121. [Google Scholar]
- Fedrick J. Anencephalus and maternal tea drinking: evidence for a possible association. Proc R Soc Med. 1974;67:356–60. doi: 10.1177/003591577406700513. [DOI] [PMC free article] [PubMed] [Google Scholar]
- Fiorini RN, Donovan JL, Rodwell D, Evans Z, Cheng G, May HD, Milliken CE, Markowitz JS, Campbell C, Haines JK, Schmidt MG, Chavin KD. Short-term administration of (−)-epigallocatechin gallate reduces hepatic steatosis and protects against warm hepatic ischemia/reperfusion injury in steatotic mice. Liver Transpl. 2005;11:298–308. doi: 10.1002/lt.20348. [DOI] [PubMed] [Google Scholar]
- Food and Drug Administration. Good Laboratory Regulations. Final Rule. 21 CFR 58. Fed Reg. 1987;52:33768–82. [Google Scholar]
- Fujiki H, Suganuma M, Imai K, Nakachi K. Green tea: cancer preventive beverage and/or drug. Cancer Lett. 2002;188:9–13. doi: 10.1016/s0304-3835(02)00379-8. [DOI] [PubMed] [Google Scholar]
- Galati G, Lin A, Sultan AM, O’Brien PJ. Cellular and in vivo hepatotoxicity caused by green tea phenolic acids and catechins. Free Radic Biol Med. 2006;40:570–80. doi: 10.1016/j.freeradbiomed.2005.09.014. [DOI] [PubMed] [Google Scholar]
- Gart JJ, Chu KC, Tarone RE. Statistical issues in interpretation of chronic bioassay tests for carcinogenicity. J Natl Cancer Inst. 1979;62:957–74. [PubMed] [Google Scholar]
- Gloro R, Hourmand-Ollivier I, Mosquet B, Mosquet L, Rousselot P, Salame E, Piquet MA, Dao T. Fulminant hepatitis during self-medication with hydroalcoholic extract of green tea. Eur J Gastroenterol Hepatol. 2005;17:1135–7. doi: 10.1097/00042737-200510000-00021. [DOI] [PubMed] [Google Scholar]
- Goasduff T, Dreano Y, Guillois B, Menez JF, Berthou F. Induction of liver and kidney CYP1A1/1A2 by caffeine in rat. Biochem Pharmacol. 1996;52:1915–19. doi: 10.1016/s0006-2952(96)00522-9. [DOI] [PubMed] [Google Scholar]
- Gomes A, Das M, Vedasiromoni JR, Ganguly DK. Proconvulsive effect of tea (Camellia sinensis) in mice. Phytother Res. 1999;13:376–79. doi: 10.1002/(sici)1099-1573(199908/09)13:5<376::aid-ptr465>3.0.co;2-#. [DOI] [PubMed] [Google Scholar]
- Goodin MG, Bray BJ, Rosengren RJ. Sex- and strain-dependent effects of epigallocatechin gallate (EGCG) and epicatechin gallate (ECG) in the mouse. Food Chem Toxicol. 2006;44:1496–1504. doi: 10.1016/j.fct.2006.04.012. [DOI] [PubMed] [Google Scholar]
- Goodin MG, Rosengren RJ. Epigallocatechin gallate modulates CYP450 isoforms in the female Swiss-Webster mouse. Toxicol Sci. 2003;76:262–70. doi: 10.1093/toxsci/kfh001. [DOI] [PubMed] [Google Scholar]
- Goodin MG, Fertuck KC, Zacharewski TR, Rosengren RJ. Estrogen receptor-mediated actions of polyphenolic catechins in vivo and in vitro. Toxicol Sci. 2002;69:354–61. doi: 10.1093/toxsci/69.2.354. [DOI] [PubMed] [Google Scholar]
- Graham HN. Green tea composition, consumption, and polyphenol chemistry. Prev Med. 1992;21:334–50. doi: 10.1016/0091-7435(92)90041-f. [DOI] [PubMed] [Google Scholar]
- Hirose M, Hoshiya T, Akagi K, Takahashi S, Hara Y, Ito N. Effects of green tea catechins in a rat multi-organ carcinogenesis model. Carcinogenesis. 1993;14:1549–53. doi: 10.1093/carcin/14.8.1549. [DOI] [PubMed] [Google Scholar]
- Ikeda I, Hamamoto R, Uzu K, Imaizumi K, Nagao K, Yanagita T, Suzuki Y, Kobayashi M, Kakuda T. Dietary gallate esters of tea catechins reduce deposition of visceral fat, hepatic triacylglycerol, and activities of hepatic enzymes related to fatty acid synthesis in rats. Biosci Biotechnol Biochem. 2005;69:1049–53. doi: 10.1271/bbb.69.1049. [DOI] [PubMed] [Google Scholar]
- Ikeda I, Imasato Y, Sasaki E, Nakayama M, Nagao H, Takeo T, Yayabe F, Sugano M. Tea catechins decrease micellar solubility and intestinal absorption of cholesterol in rats. Biochim Biophys Acta. 1992;1127:141–46. doi: 10.1016/0005-2760(92)90269-2. [DOI] [PubMed] [Google Scholar]
- Isbrucker RA, Edwards JA, Wolz E, Davidovich A, Bausch J. Safety studies on epigallocatechin gallate (EGCG) preparations. Part 2: dermal, acute and short-term toxicity studies. Food Chem Toxicol. 2006;44:636–50. doi: 10.1016/j.fct.2005.11.003. [DOI] [PubMed] [Google Scholar]
- Jeffrey AM, Iatropoulos MJ, Williams GM. Nasal cytotoxic and carcinogenic activities of systemically distributed organic chemicals. Toxicol Pathol. 2006;34:827–52. doi: 10.1080/01926230601042494. [DOI] [PubMed] [Google Scholar]
- Johnson W, Morrissey R, Crowell J, McCormick D. Subchronic oral toxicity of green tea polyphenols in rats and dogs. Toxicological Sciences. 1999;48:57–58. [Google Scholar]
- Jonckheere A. A distribution-free k-sample test against ordered alternatives. Biometrika. 1954;41:133–45. [Google Scholar]
- Kao YH, Hiipakka RA, Liao S. Modulation of endocrine systems and food intake by green tea epigallocatechin gallate. Endocrinology. 2000;141:980–87. doi: 10.1210/endo.141.3.7368. [DOI] [PubMed] [Google Scholar]
- Liao S, Umekita Y, Guo J, Kokontis JM, Hiipakka RA. Growth inhibition and regression of human prostate and breast tumors in athymic mice by tea epigallocatechin gallate. Cancer Lett. 1995;96:239–43. doi: 10.1016/0304-3835(95)03948-v. [DOI] [PubMed] [Google Scholar]
- Ling G, Gu J, Genter MB, Zhuo X, Ding X. Regulation of cytochrome P450 gene expression in the olfactory mucosa. Chem Biol Interact. 2004;147:247–58. doi: 10.1016/j.cbi.2004.02.003. [DOI] [PubMed] [Google Scholar]
- Lock EA, Harpur ES. Toxicology of sensory systems: a perspective. Hum Exp Toxicol. 1992;11:442–48. doi: 10.1177/096032719201100602. [DOI] [PubMed] [Google Scholar]
- Maliakal PP, Coville PF, Wanwimolruk S. Tea consumption modulates hepatic drug metabolizing enzymes in Wistar rats. J Pharm Pharmacol. 2001;53:569–77. doi: 10.1211/0022357011775695. [DOI] [PubMed] [Google Scholar]
- Mazzanti G, Menniti-Ippolito F, Moro PA, Cassetti F, Raschetti R, Santuccio C, Mastrangelo S. Hepatotoxicity from green tea: a review of the literature and two unpublished cases. Eur J Clin Pharmacol. 2009;65:331–41. doi: 10.1007/s00228-008-0610-7. [DOI] [PubMed] [Google Scholar]
- McCormick D, Johnson W, Morrissey R, Crowell J. Subchronic oral toxicity of epigallocatechin gallate (EGCG) in rats and dogs. Toxicological Sciences. 1999;48:57. [Google Scholar]
- Molinari M, Watt KD, Kruszyna T, Nelson R, Walsh M, Huang WY, Nashan B, Peltekian K. Acute liver failure induced by green tea extracts: case report and review of the literature. Liver Transpl. 2006;12:1892–95. doi: 10.1002/lt.21021. [DOI] [PubMed] [Google Scholar]
- Monteiro R, Assuncao M, Andrade JP, Neves D, Calhau C, Azevedo I. Chronic green tea consumption decreases body mass, induces aromatase expression, and changes proliferation and apoptosis in adult male rat adipose tissue. J Nutr. 2008;138:2156–63. doi: 10.1093/jn/138.11.2156. [DOI] [PubMed] [Google Scholar]
- Murase T, Nagasawa A, Suzuki J, Hase T, Tokimitsu I. Beneficial effects of tea catechins on diet-induced obesity: stimulation of lipid catabolism in the liver. Int J Obes Relat Metab Disord. 2002;26:1459–64. doi: 10.1038/sj.ijo.0802141. [DOI] [PubMed] [Google Scholar]
- National Research Council. Guide for the Care and Use of Laboratory Animals. National Academies Press; Washington, DC: 1996. [Google Scholar]
- Nishikawa M, Ariyoshi N, Kotani A, Ishii I, Nakamura H, Nakasa H, Ida M, Nakamura H, Kimura N, Kimura M, Hasegawa A, Kusu F, Ohmori S, Nakazawa K, Kitada M. Effects of continuous ingestion of green tea or grape seed extracts on the pharmacokinetics of midazolam. Drug Metab Pharmacokinet. 2004;19:280–89. doi: 10.2133/dmpk.19.280. [DOI] [PubMed] [Google Scholar]
- Nishikawa T, Nakajima T, Moriguchi M, Jo M, Sekoguchi S, Ishii M, Takashima H, Katagishi T, Kimura H, Minami M, Itoh Y, Kagawa K, Okanoue T. A green tea polyphenol, epigalocatechin-3-gallate, induces apoptosis of human hepatocellular carcinoma, possibly through inhibition of Bcl-2 family proteins. J Hepatol. 2006;44:1074–82. doi: 10.1016/j.jhep.2005.11.045. [DOI] [PubMed] [Google Scholar]
- Obermeier MT, White RE, Yang CS. Effects of bioflavonoids on hepatic P450 activities. Xenobiotica. 1995;25:575–84. doi: 10.3109/00498259509061876. [DOI] [PubMed] [Google Scholar]
- Pearse G. Histopathology of the thymus. Toxicol Pathol. 2006;34:515–47. doi: 10.1080/01926230600978458. [DOI] [PubMed] [Google Scholar]
- Raederstorff DG, Schlachter MF, Elste V, Weber P. Effect of EGCG on lipid absorption and plasma lipid levels in rats. J Nutr Biochem. 2003;14:326–32. doi: 10.1016/s0955-2863(03)00054-8. [DOI] [PubMed] [Google Scholar]
- Reed CJ. Drug metabolism in the nasal cavity: relevance to toxicology. Drug Metab Rev. 1993;25:173–205. doi: 10.3109/03602539308993975. [DOI] [PubMed] [Google Scholar]
- Sarma DN, Barrett ML, Chavez ML, Gardiner P, Ko R, Mahady GB, Marles RJ, Pellicore LS, Giancaspro GI, Low Dog T. Safety of green tea extracts: a systematic review by the US pharmacopeia. Drug Saf. 2008;31:469–84. doi: 10.2165/00002018-200831060-00003. [DOI] [PubMed] [Google Scholar]
- Schmidt M, Schmitz HJ, Baumgart A, Guedon D, Netsch MI, Kreuter MH, Schmidlin CB, Schrenk D. Toxicity of green tea extracts and their constituents in rat hepatocytes in primary culture. Food Chem Toxicol. 2005;43:307–14. doi: 10.1016/j.fct.2004.11.001. [DOI] [PubMed] [Google Scholar]
- Sells DM, Brix AE, Nyska A, Jokinen MP, Orzech DP, Walker NJ. Respiratory tract lesions in noninhalation studies. Toxicol Pathol. 2007;35:170–77. doi: 10.1080/01926230601059969. [DOI] [PMC free article] [PubMed] [Google Scholar]
- Shackelford C, Long G, Wolf J, Okerberg C, Herbert R. Qualitative and quantitative analysis of nonneoplastic lesions in toxicology studies. Toxicol Pathol. 2002;30:93–96. doi: 10.1080/01926230252824761. [DOI] [PubMed] [Google Scholar]
- Shirai T, Reshad K, Yoshitomi A, Chida K, Nakamura H, Taniguchi M. Green tea-induced asthma: relationship between immunological reactivity, specific and non-specific bronchial responsiveness. Clin Exp Allergy. 2003;33:1252–55. doi: 10.1046/j.1365-2222.2003.01744.x. [DOI] [PubMed] [Google Scholar]
- Shirai T, Sato A, Chida K, Hayakawa H, Akiyama J, Iwata M, Taniguchi M, Reshad K, Hara Y. Epigallocatechin gallate-induced histamine release in patients with green tea-induced asthma. Ann Allergy Asthma Immunol. 1997;79:65–69. doi: 10.1016/S1081-1206(10)63087-6. [DOI] [PubMed] [Google Scholar]
- Shirai T, Sato A, Hara Y. Epigallocatechin gallate. The major causative agent of green tea-induced asthma. Chest. 1994;106:1801–5. doi: 10.1378/chest.106.6.1801. [DOI] [PubMed] [Google Scholar]
- Shirley E. A non-parametric equivalent of Williams’ test for contrasting increasing dose levels of a treatment. Biometrics. 1977;33:386–89. [PubMed] [Google Scholar]
- Sohn OS, Surace A, Fiala ES, Richie JP, Jr, Colosimo S, Zang E, Weisburger JH. Effects of green and black tea on hepatic xenobiotic metabolizing systems in the male F344 rat. Xenobiotica. 1994;24:119–27. doi: 10.3109/00498259409043226. [DOI] [PubMed] [Google Scholar]
- Stratton SP, Bangert JL, Alberts DS, Dorr RT. Dermal toxicity of topical (−)epigallocatechin-3-gallate in BALB/c and SKH1 mice. Cancer Lett. 2000;158:47–52. doi: 10.1016/s0304-3835(00)00498-5. [DOI] [PubMed] [Google Scholar]
- Takami S, Imai T, Hasumura M, Cho YM, Onose J, Hirose M. Evaluation of toxicity of green tea catechins with 90-day dietary administration to F344 rats. Food Chem Toxicol. 2008;46:2224–29. doi: 10.1016/j.fct.2008.02.023. [DOI] [PubMed] [Google Scholar]
- Tewes FJ, Koo LC, Meisgen TJ, Rylander R. Lung cancer risk and mutagenicity of tea. Environ Res. 1990;52:23–33. doi: 10.1016/s0013-9351(05)80148-3. [DOI] [PubMed] [Google Scholar]
- Thornton-Manning JR, Dahl AR. Metabolic capacity of nasal tissue interspecies comparisons of xenobiotic-metabolizing enzymes. Mutat Res. 1997;380:43–59. doi: 10.1016/s0027-5107(97)00126-7. [DOI] [PubMed] [Google Scholar]
- Walsh KM, Courtney CL. Nasal toxicity of CI-959, a novel anti-inflammatory drug, in Wistar rats and Beagle dogs. Toxicol Pathol. 1998;26:717–23. doi: 10.1177/019262339802600601. [DOI] [PubMed] [Google Scholar]
- Whitlock JP., Jr Induction of cytochrome P4501A1. Annu Rev Pharmacol Toxicol. 1999;39:103–25. doi: 10.1146/annurev.pharmtox.39.1.103. [DOI] [PubMed] [Google Scholar]
- Williams DA. A test for differences between treatment means when severaldoselevels arecomparedwith a zerodosecontrol. Biometrics. 1971;27:103–17. [PubMed] [Google Scholar]
- Williams DA. The comparison of several dose levels with a zero dose control. Biometrics. 1972;28:519–31. [PubMed] [Google Scholar]
- Williams SN, Pickwell GV, Quattrochi LC. A combination of tea (Camellia senensis) catechins is required for optimal inhibition of induced CYP1A expression by green tea extract. J Agric Food Chem. 2003;51:6627–34. doi: 10.1021/jf030181z. [DOI] [PubMed] [Google Scholar]
- Williams SN, Shih H, Guenette DK, Brackney W, Denison MS, Pickwell GV, Quattrochi LC. Comparative studies on the effects of green tea extracts and individual tea catechins on human CYP1A gene expression. Chem Biol Interact. 2000;128:211–29. doi: 10.1016/s0009-2797(00)00204-0. [DOI] [PubMed] [Google Scholar]
- Wu CD, Wei GX. Tea as a functional food for oral health. Nutrition. 2002;18:443–44. doi: 10.1016/s0899-9007(02)00763-3. [DOI] [PubMed] [Google Scholar]
- Wu CH, Lu FH, Chang CS, Chang TC, Wang RH, Chang CJ. Relationship among habitual tea consumption, percent body fat, and body fat distribution. Obes Res. 2003;11:1088–95. doi: 10.1038/oby.2003.149. [DOI] [PubMed] [Google Scholar]
- Yang SP, Raner GM. Cytochrome P450 expression and activities in human tongue cells and their modulation by green tea extract. Toxicol Appl Pharmacol. 2005;202:140–50. doi: 10.1016/j.taap.2004.06.014. [DOI] [PubMed] [Google Scholar]
- Yang TT, Koo MW. Chinese green tea lowers cholesterol level through an increase in fecal lipid excretion. Life Sci. 2000;66:411–23. doi: 10.1016/s0024-3205(99)00607-4. [DOI] [PubMed] [Google Scholar]
- Yokozawa T, Nakagawa T, Kitani K. Antioxidative activity of green tea polyphenol in cholesterol-fed rats. J Agric Food Chem. 2002;50:3549–52. doi: 10.1021/jf020029h. [DOI] [PubMed] [Google Scholar]
- Yoshino K, Tomita I, Sano M, Oguni I, Hara Y, Nakano M. Effects of long-term dietary supplement of tea polyphenols on lipid peroxide levels in rats. Age. 1994;17:79–85. [Google Scholar]
- Zhang XG, Xu P, Liu Q, Yu CH, Zhang Y, Chen SH, Li YM. Effect of tea polyphenol on cytokine gene expression in rats with alcoholic liver disease. Hepatobiliary Pancreat Dis Int. 2006;5:268–72. [PubMed] [Google Scholar]