

Abstract
The goal of this study was to determine whether PTSD was associated with an increase in time-related decline in macrostructural brain volume and whether these changes were associated with accelerated cognitive decline. To quantify brain structure, 3 dimensional T1-weighted MRI scans were performed at baseline and again after a minimum of 24 months in 25 patients with PTSD and 22 controls. Longitudinal changes in brain volume were measured using deformation morphometry. For the group as a whole PTSD+ patients did not show significant ongoing brain atrophy compared to PTSD-. PTSD+ patients were then subgrouped into those with decreasing or increasing symptoms. We found little evidence for brain markers of accelerated atrophy in PTSD+ veterans whose symptoms improved over time, with only a small left parietal region showing greater ongoing tissue loss than PTSD-. PTSD patients whose symptoms increased over time showed accelerated atrophy throughout the brain, particularly brainstem and frontal and temporal lobes. Lastly, for the sample as a whole greater rates of brain atrophy were associated with greater rates of decline in verbal memory and delayed facial recognition.
Keywords: deformation morphometry, longitudinal, MRI, neuropsychological testing, PTSD, Vietnam veterans
1. Introduction
Post-traumatic stress disorder develops after exposure to a traumatic event, and sufferers experience characteristic symptoms including nightmares or flashbacks of the trauma, hyperarousal and insomnia, poor concentration, and difficulty with recalling explicit memories of the traumatic event. A neurocircuitry model of PTSD postulates a hyperresponsivity of the amygdala to threat-related stimuli, inadequate control of the amygdala by the medial prefrontal cortex and anterior cingulate, and hippocampal deficits that lead to memory difficulties and problems identifying safe contexts (Bremner 2002; Pitman et al 2001).
Previous brain imaging studies have focused on identifying PTSD-related abnormalities within these brain structures at a single point in time. Many, but not all, studies have reported hippocampal volume decreases (Bremner et al., 1995; Fennema-Notestine et al., 2002; Gurvits et al., 1996). A meta-analysis (Karl et al., 2006) concluded that hippocampal volumes are reduced in PTSD, although the size of group differences is accounted for in part by MRI methodology, PTSD symptom severity, medication, age, and gender. Brain volume decreases have also been reported in the anterior cingulate, subcallosal cortex, amygdala, and prefrontal cortex (Rauch et al., 2003; Schuff et al., 2008; Weniger et al., 2008; Yamasue et al., 2003).
Studies of the effects of PTSD on brain anatomy have usually been hypothesis driven, associating specific region-of-interest (ROI) brain volumes to PTSD or PTSD symptoms. Fewer investigators have used voxel-wise analysis methods, which are useful for examining local tissue properties (e.g., gray matter volume or density) without a priori hypotheses, as they compare tissue properties at every image location. Using voxel-wise analysis, brain structure abnormalities associated with PTSD have been reported in limbic and paralimbic cortices, anterior cingulate and insular cortex (Chen et al., 2006; Corbo et al., 2005; De Nardo et al., 2009).
Most prior studies of PTSD have also focused on a single timepoint, so less is understood regarding the progression of PTSD over time. Early longitudinal imaging studies did not find evidence for accelerated hippocampal volume changes associated with PTSD over 6 months following trauma (Bonne et al., 2001) or in pediatric maltreatment-related PTSD during puberty (De Bellis et al., 2001). In a longitudinal study of elderly Holocaust survivors with PTSD, Yehuda and colleagues showed that decades after trauma exposure, an accelerated decline in paired associates learning was observed (Yehuda et al., 2006). Samuelson and colleagues followed the longitudinal trajectory of neuropsychological functioning in the present study's sample of primarily Vietnam veterans, showing accelerated decline in delayed facial recognition in veterans with PTSD (Samuelson et al., 2009). These results shed some light on the effect of chronic PTSD on ongoing cognition, but it is unknown whether these cognitive changes are caused by abnormal neuronal function, progressive brain tissue loss, or both.
The primary goal of this study was to determine whether chronic PTSD is associated with brain tissue loss over time using deformation morphometry of brain MRI scans. Deformation morphometry is a voxel-wise technique that is sensitive to detection of disease effects on localized brain anatomy, such as the insula, that might be obscured when looking at tissue volume over large ROsIs that include those smaller structures.
Our specific aim was to compare a group of PTSD+ veterans to a group of PTSD- veterans to determine the longitudinal effects of PTSD. Baseline cross-sectional comparisons of cognition and brain imaging have been previously reported, and the present longitudinal sample comprises a subset of our earlier studies. In summary, PTSD+ showed reduced baseline N-acetyl-aspartate in the hippocampus and anterior cingulate cortex, and deficits in verbal memory, attention, and processing speed (Samuelson et al., 2006; Schuff et al., 2008; Schuff et al., 2001), in the absence of significant lobar or hippocampal atrophy. We hypothesized that ongoing brain atrophy underlies these changes in baseline hippocampal and anterior cingulate NAA. Moreover, a two fold increase in the risk for dementia in veterans with PTSD has recently been reported (Yaffe et al.). This suggests that cumulative longitudinal tissue loss may be occurring in our PTSD+ veterans, who were in their sixth decade, when acceleration of brain atrophy normally begins (Raz et al., 2005). Taken together, we expected that a follow-up assessment would detect longitudinal atrophy in all participants, with greater longitudinal atrophy in PTSD. We quantified brain volumes from T1-weighted MRIs and tested the a priori hypothesis of greater rates of atrophy in PTSD+ patients compared to PTSD- controls. An additional aim was to identify baseline predictors of ongoing brain atrophy. We hypothesized that greater longitudinal atrophy would be associated with lower education, greater baseline age, higher baseline CAPS, increasing PTSD symptoms (i.e., greater CAPS change), higher levels of alcohol use, and larger baseline grey matter (GM) volumes. A final aim was to determine whether ongoing tissue loss was related to longitudinal decline in cognitive functioning, as indexed by change in neuropsychological test scores in all participants.
2. Methods
2.1 Participants
After complete description of the study to the subjects, written informed consent was obtained to a protocol approved by the review boards of both the University of California, San Francisco (UCSF) and the San Francisco Veterans Affairs (SFVA) Medical Center. Participants had previously participated in one of two earlier studies examining neuroimaging and neuropsychological correlates of PTSD (Neylan et al., 2004; Samuelson et al., 2006; Schuff et al., 2008; Schuff et al., 2001). When initially studied, participants had given consent to be recontacted about future studies. Veterans were contacted a minimum of two years after completion of the first assessment. Study procedures included completing a neuropsychological test battery and MRI scanning. Participants met the following basic inclusion criteria at baseline: veterans 25-65 years of age; PTSD+ participants had current PTSD attributable to a traumatic life event (e.g., Vietnam or Gulf War combat, experiencing or witnessing serious accidents, illnesses, sudden death, physical and sexual assault), PTSD- participants had no current, subthreshold, or lifetime history of PTSD. Exclusion criteria at baseline were: diagnosis of drug dependence or abuse within the past 6 months, current or lifetime history of any psychiatric disorder with psychotic features, current or lifetime history of bipolar disorder, history of neurologic or systemic illness affecting CNS function, history of head injury with loss of consciousness exceeding 10 minutes, and history of head injury with any persistent post-injury symptoms. Alcohol abuse and dependence were allowable diagnoses for one of the original studies. Patients and controls were studied twice, once after enrollment (baseline) and again after a minimum of 24 months. Because we were interested in the natural course of PTSD, we did not apply exclusionary criteria at follow-up. At follow-up, three PTSD+ participants met one of the exclusionary baseline diagnoses—two exhibiting psychotic symptoms and one exhibiting symptoms of bipolar disorder not otherwise specified. These participants did not represent outliers in terms of neuropsychological functioning and were included in our previous study of longitudinal neuropsychological functioning (Samuelson et al., 2009), and were also included in this longitudinal imaging study. This analysis included 25 PTSD+ male veterans and 22 PTSD- male veterans that had complete longitudinal MRI and neuropsychological datasets.
2.2 Clinical and cognitive testing
Diagnoses of PTSD at baseline and follow-up were made by a clinical psychologist using the Clinician Administered PTSD Scale, which determines if DSM-IV diagnostic criteria were met (CAPS; (Blake et al., 1995)). Individuals with no trauma exposure received a CAPS score of 0. The Structured Clinical Interview for DSM-IV Diagnosis (SCID; (First et al., 1996)) was used to diagnose comorbid and exclusionary conditions. Lifetime alcohol use was obtained using the Lifetime Drinking History questionnaire (LDH; (Skinner and Sheu, 1982)).
All participants were administered a test battery of neuropsychological measures at both timepoints, including the California Verbal Learning Test (CVLT; (Delis et al., 1987)), Faces I, Faces II, Family Pictures I, Family Pictures II, Digit Span and Spatial Span subtests of the Wechsler Memory Scale-Third Edition (WMS-III; (Wechsler, 1987)). Samuelson and colleagues previously reported on the longitudinal neuropsychological changes observed in this dataset (Samuelson et al., 2009), and found a subtle decline in delayed facial recognition as indexed by performance on the Faces II subtest. In light of this finding and the previous reports of longitudinal changes on the CVLT due to PTSD (Yehuda et al., 2006), this study focused only on the relationships of longitudinal changes in Faces II, CVLT total (short term verbal memory) and CVLT long delay (long term verbal memory) with longitudinal measures of brain atrophy. Longitudinal change on these neuropsychological tests was defined as (scoretp1-scoretp2)/(test interval in yrs).
2.3 MRI acquisition and processing
T1-weighted images were acquired on a clinical 1.5 Tesla MR scanner (Vision, Siemens Medical Systems, Iselin NJ) using Magnetization Prepared Rapid Acquisition Gradient Echo (TR/TI/TE = 9/300/4 ms, 1×1 mm2 in-plane resolution, 1.5 mm slabs); images were acquired orthogonal to the long axis of the hippocampus.
Deformation based morphometry (DBM) analyses: Robust fluid registration was used to nonlinearly register baseline and follow-up scans of each participant to create maps of longitudinal atrophy. Each participant's baseline image was then registered to an atlas; transformations were combined to create maps of longitudinal atrophy in common space as described in (Cardenas et al., 2007). The longitudinal atrophy maps were normalized by interscan interval and these maps of annualized atrophy rate in common space were used in statistical analysis using linear models. ANCOVA at each voxel was used to test our first hypothesis that PTSD was associated with greater tissue atrophy rates; the maps of longitudinal change were the dependent variable, group status (i.e., PTSD+ or PTSD-) was the categorical predictor, and age was a covariate. Linear regressions with baseline clinical or imaging measures as the independent variable were fit at each voxel in order to identify baseline predictors of ongoing atrophy. Subsequent analyses compared PTSD+ participants with improving symptoms vs. PTSD-, and PTSD+ with worsening symptoms vs. PTSD-, in order to determine the relationship between improving mental health and ongoing brain atrophy. Using all participants, linear regression with change in neuropsychological test score as the independent variable was also fit at each voxel, covarying for age, in order to determine the relationship between rate of tissue atrophy and cognitive decline. Statistical maps were corrected for multiple comparisons by thresholding at uncorrected p=0.005, identifying suprathreshold clusters, and using nonstationary random field theory (Worsley et al., 2002) to identify clusters with corrected p<0.05. Within each cluster with corrected p<0.05, the estimated effects (i.e., the voxel-wise beta coefficients from the linear model) were averaged to determine the magnitude of the group effects (for ANCOVA models) or the slope (for regression models).
3. Results
3.1 Sample characteristics
Table 1 shows group demographics, including baseline and follow-up age and CAPS scores, education in years, interval between study timepoints, current psychotropic medication use, current diagnosis of alcohol abuse, and trauma exposure. Categories of trauma exposure were Vietnam combat, Gulf War combat, other military trauma (e.g., serious accidents), and non-military trauma (e.g., child abuse, assaults). All participants diagnosed as PTSD+ at baseline met criteria for PTSD at follow-up, and as a group had a higher CAPS score at both timepoints. The majority (77%) of the control participants were trauma-exposed. All of the PTSD+ participants had experienced military-related traumas, with the traumatic event assessed for the majority of participants being Vietnam combat. Likewise, 70% of the sample experienced their assessed trauma between 30 and 35 years ago.
Table 1. Participant characteristics.
| PTSD- N=22 |
PTSD+ N=25 |
p-value | |
|---|---|---|---|
| Baseline Age (yrs) | 52.1 ±5.6 (39-60) |
50.5 ± 6.6 (33-60) |
0.37 |
|
| |||
| Followup Age (yrs) | 55.0 ± 5.7 (41-63) |
53.0 ± 6.5 (37-63) |
0.44 |
|
| |||
| Education (yrs) | 16 ± 2 (12-20) |
15 ± 2 (12-20) |
0.01 |
|
| |||
| Interval (yrs) | 2.6 ± 0.4 (2.0-3.4) |
2.9 ± 0.6 (2.0-4.0) |
0.13 |
|
| |||
| Baseline CAPS | 2 ± 3 (0-11) |
61 ± 15 (31-92) |
< 0.0001 |
|
| |||
| Followup CAPS | 2 ± 3 (0-11) |
52 ± 18 (19-84) |
< 0.0001 |
|
| |||
| Trauma Exposure Type | |||
| No trauma | 5 (23%) | 0 | |
| Vietnam | 11 (50%) | 19 (74%) | |
| Gulf War | 0 | 1 (4%) | < 0.001 |
| Other military | 0 | 5 (20%) | |
| Non-military | 6 (27%) | 0 | |
|
| |||
| Time Since Trauma | 32 ± 10 | 31 ± 7 | 0.40 |
|
| |||
| Medication | 3 (14%) | 9 (36%) | 0.10 |
|
| |||
| Alcohol abuse | 2 (9%) | 1 (4%) | 0.59 |
There were no significant differences between PTSD- and PTSD+ on baseline or follow-up age, interscan interval, proportion on psychiatric medications, or proportion of alcohol abusers. PTSD- participants had slightly more years of education (16 vs. 15 yrs; all participants finished high school), and as expected there were greater CAPS scores at baseline and follow-up in the PTSD+ group. Compared to the PTSD+ participants, the PTSD- participants were more likely to endorse as their most traumatic experience an event that was not military related.
3.2 DBM analyses
3.2.1 PTSD+ vs PTSD-
Maps of the average annualized rate of atrophy were similar for the PTSD- and PTSD+ groups (supplementary figure S1). Both groups showed localized expansion of the ventricles over time of up to 20%/yr and smaller magnitude rates of brain tissue loss in the cerebellum, frontal, temporal, and parietal lobes. Statistical comparison of the atrophy rate maps, covarying for age, revealed small regions of the brain where group differences in the rate of atrophy occurred that were of low significance and did not survive corrections for multiple comparisons (supplementary figure S2).
3.2.2 Associations between clinical and imaging variables and atrophy rate
Voxel-wise linear regressions were performed to examine associations between clinical and imaging variables and atrophy rate. Variables examined included education, baseline age, baseline CAPS, longitudinal change in CAPS, 12 month total drinks from the LDH, and baseline volume measures of global cortical GM (Cardenas et al., 2009). Baseline education, CAPS score, and alcohol use were not associated with rate of atrophy. Larger baseline GM volumes were associated with increased atrophy rate. Greater age at baseline was strongly associated with faster rate of tissue loss. Lastly, faster rates of atrophy were associated with larger longitudinal increases in the CAPS score (i.e., increasing PTSD symptoms). Table 3 summarizes these results.
Table 3. Atrophy Rate associated with clinical symptoms and baseline grey matter.
| Location | Cluster Volume (cc) |
Corrected p-value | Effect* (%) |
|
|---|---|---|---|---|
| Baseline Age | Corpus callosum, thalamus, brainstem, hippocampus, frontal lobe, cerebellum | 119.4 | <0.0001 | -0.2 |
| Left temporal | 1.6 | 0.03 | -0.1 | |
| Baseline GM | Superior frontal | 40.4 | <0.0001 | -0.4 |
| Left anterior temporal | 10.0 | <0.0001 | -0.4 | |
| Right midline occipital | 2.9 | 0.0003 | -0.3 | |
| Right parieto-occipital | 2.5 | 0.0008 | -0.3 | |
| Left cerebellum | 2.8 | 0.001 | -0.3 | |
| Left midline occipital | 2.6 | 0.01 | -0.3 | |
| Left fronto-parietal | 2.9 | 0.04 | -0.4 | |
| CAPS change | Superior frontal | 3.2 | 0.007 | 0.3 |
| Orbitofrontal | 2.5 | 0.05 | 0.3 | |
| Improvers vs. PTSD- | Left lateral parietal | 1.4 | 0.02 | -3.1 |
| Non-Improvers vs. PTSD- | Right frontal, temporal, and subcortical | 34.2 | <0.0001 | -3.9 |
| Brainstem | 13.7 | <0.0001 | -3.0 | |
| Right anterior temporal | 10.1 | <0.0001 | -4.2 | |
| Left frontal, subcortical | 6.2 | 0.0003 | -3.2 | |
| Left anterior temporal | 5.2 | 0.0009 | -3.5 | |
| Right mid-occipital | 1.9 | 0.02 | -3.3 | |
| Left superior frontal | 2.0 | 0.02 | -3.2 | |
| Cerebellum | 6.4 | 0.006 | -3.6 | |
| CVLT change | Left posterior parietal/precuneus | 4.7 | 0.01 | -3.2 |
| Right lateral parietal | 2.0 | 0.02 | -2.6 | |
| Right posterior parietal/precuneus | 1.8 | 0.04 | -2.8 | |
| Left lateral parietal | 2.7 | 0.04 | -3.7 | |
| Faces II change | Right parieto-occipital (extrastriate) | 10.5 | 0.0003 | -3.7 |
effect sizes for regressions are %change in atrophy rate per unit change of independent variable
The association between CAPS change and longitudinal atrophy could arise if patients with increasing symptoms (i.e., CAPS increase over time) showed greater longitudinal atrophy, if patients with decreasing symptoms showed tissue volume recovery, or both. In order to better understand this association, we subgrouped the PTSD+ patients by change in CAPS score. The change in CAPS score ranged from a 47 point increase (worsening symptoms) to a 40 point decrease (improving symptoms), and six patients went from a full to a partial diagnosis of PTSD. The authors of the CAPS (Weathers et al., 2001) suggest that a 15 point improvement in CAPS score is suggestive of clinically significant change. Moreover, a longitudinal assessment of Holocaust survivors with chronic PTSD showed a mean improvement in symptom severity as measured by the CAPS (Yehuda et al., 2006). Therefore, we created three groups of PTSD+ participants: Improvers (≥15 point CAPS score decrease), Non-Improvers (any increase in CAPS score), and Mild Improvers (<15 point CAPS score decrease). This subgrouping resulted in 11 PTSD+ Improvers who had a 15-40 (mean ± SD, 26 ± 8) point decrease in CAPS score, 9 PTSD+ Non-Improvers who had a 2-47 (14 ± 13) point increase in CAPS score, and 5 PTSD+ Mild Improver whose CAPS score decreased modestly by 6-14 points. (11 ± 4). Table 2 shows group characteristics for these three PTSD+ groups; there were no significant differences in baseline CAPS, age, education, interscan interval, trauma exposure, proportion on psychiatric medication, or proportion of alcohol abusers. At follow-up, Non-Improvers had higher CAPS scores than Improvers or Mild Improvers. Improvers and Non-Improvers were then compared to PTSD- subjects, covarying for baseline age and GM volume.
Table 2. Characteristics of PTSD+ Stable, Improvers and Non-Improvers.
| PTSD+ Stable N=5 |
PTSD+ Improvers N=11 |
PTSD+ Non-Improvers N=9 |
p-value | |
|---|---|---|---|---|
| Baseline Age (yrs) | 50.4 ± 9.9 (33-56) |
52.4 ± 5.5 (41-60) |
48.3 ± 5.8 (38-54) |
0.11 |
|
| ||||
| Education (yrs) | 15 ± 2 (12-18) |
15 ± 2 (12-19) |
14 ± 3 (12-20) |
0.83 |
|
| ||||
| Interval (yrs) | 3.0 ± 0.5 (2.6-3.8) |
2.7 ± 0.6 (2.0-4.1) |
2.9 ± 0.6 (2.2-4.0) |
0.59 |
|
| ||||
| Baseline CAPS | 57 ± 8 (47-69) |
68 ± 16 (45-92) |
54 ± 14 (31-66) |
0.08 |
|
| ||||
| Followup CAPS | 46 ± 6 (38-55) |
42 ± 17 (19-77) |
67 ± 13 (44-84) |
0.05* |
|
| ||||
| Trauma Exposure Type | ||||
| Vietnam | 4 (80%) | 8 (73%) | 7 (78%) | 0.85 |
| Gulf War | 0 | 1 (9%) | 0 | |
| Other military | 1 (20%) | 2 (18%) | 2 (22%) | |
|
| ||||
| Time Since Trauma | 30 ± 10 | 31 ± 6 | 31 ± 6 | 0.76 |
|
| ||||
| Medication | 3 (60%) | 3 (27%) | 3 (33%) | 0.44 |
|
| ||||
| Alcohol abuse | 0 | 1 (9%) | 0 | 0.52 |
Stable < Non-Improvers, p=0.01; Improvers < Non-Improvers, p<0.001
3.2.3 PTSD+ Improvers vs. PTSD-
Figure 1 shows maps of the estimated sub-group effect of PTSD throughout the brain, and Table 3 lists the locations, volume, p-value, and effect magnitude of the clusters of significant differences.
Figure 1.
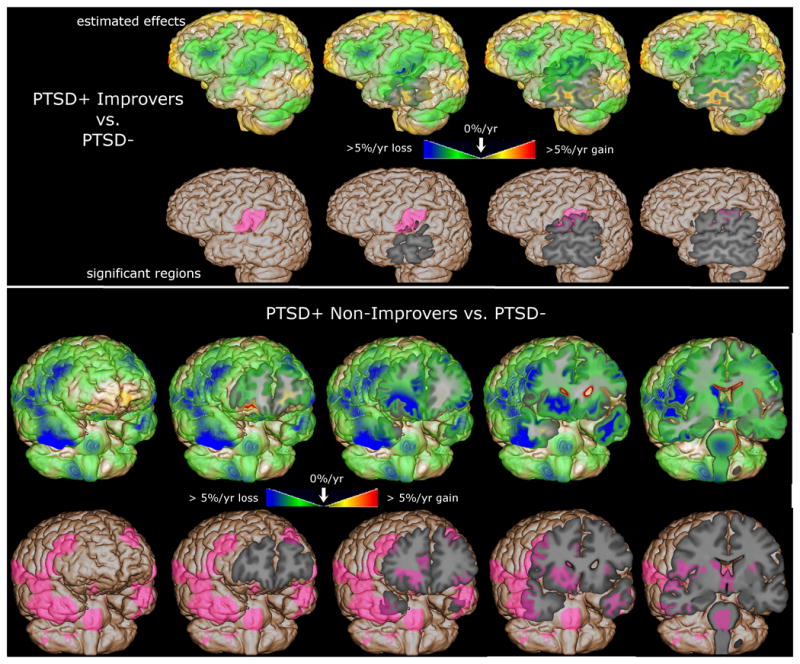
The magnitude of the group difference and the statistically significant differences between PTSD- and PTSD+ groups are mapped, overlaid on the spatially normalized average brain. The top panel shows the comparison between PTSD- and PTSD+ Improvers; the bottom show PTSD- vs. PTSD+ Non-Improvers. The green/blue voxels show regions of greater atrophy rate in PTSD+; the pink shaded voxels show regions statistically significant after correction for multiple comparisons.
The top row of the top panel of Figure 1 shows estimated beta coefficients from the ANCOVA model for the group variable, with green/blue shading revealing widespread accelerated atrophy in PTSD+ Improvers throughout the left frontal and temporal lobes. The pink shading in the bottom row of the top panel of Figure 1 shows regions where ongoing atrophy in PTSD+ Improvers was significantly greater than in PTSD- after correction for multiple comparisons (corrected p=0.02, Improvers atrophy 3.1%/yr greater than PTSD-), highlighting a small left lateral parietal region that includes parts of the postcentral and supramarginal gyri. These results do not provide evidence for tissue volume recovery in PTSD+ Improvers.
3.2.4 PTSD+ Non-Improvers vs. PTSD-
The top row of the bottom panel of Figure 1 shows estimated atrophy rate differences between PTSD+ Non-Improvers and PTSD-, revealing bilateral accelerated atrophy throughout the frontal and temporal lobes. The bottom row of the bottom panel of Figure 1 shows that ongoing atrophy in PTSD+ Non-Improvers was significantly greater than in PTSD- after correction for multiple comparisons (corrected p<0.05) in many regions including the brainstem, frontal WM, subcortical structures such as caudate and thalamus, and frontal, temporal, and occipital GM including specifically insula, anterior cingulate, dorsolateral prefrontal cortex, anterior temporal lobe, and extrastriate cortex. Significant clusters are summarized in Table 3, with corrected p ranging from less than 0.0001 to 0.02, and Non-Improvers showing 3.0-4.2%/yr greater atrophy than PTSD-. These results provide evidence for accelerated atrophy in PTSD+ Non-Improvers compared to normal aging.
3.2.5 Associations with neuropsychological changes
Regression of maps of longitudinal deformation onto the change in CVLT or Faces II scores, covarying for age, identified several regions of the brain where longitudinal tissue loss was associated with cognitive decline. Greater decline in both CVLT total score and CVLT long delay score were associated with increased annualized atrophy rate in the precuneus region. Associations with total score change were of smaller magnitude and significance and affected only the lateral precuneus, while associations with long delay score change were stronger and affected both lateral and medial precuneus. The top row of the top panel of Figure 2 shows estimated slope of longitudinal atrophy rate per change in CVLT long delay score. The green/blue voxels shows regions where there was an up to 0.40% increase in annualized atrophy rate for each unit decrease in the CVLT long delay longitudinal change score (i.e., more rapid tissue loss over time in subjects with greater longitudinal cognitive decline). The purple shading in the bottom row of the top panel of Figure 2 shows regions where the estimated slopes were significantly different from zero after correction for multiple comparisons, highlighting parietal GM and WM regions that include the precuneus. The top row of the bottom panel of Figure 2 shows the estimated slope of the longitudinal atrophy rate per change in Faces II score, showing regions where there was an up to 0.25% increase in annualized atrophy rate for each unit decrease in the Faces II longitudinal change score (i.e., more rapid tissue loss over time in subjects with greater decline in delayed facial recognition). The bottom row of the bottom panel of Figure 2 shows one small region where the estimated slope was significantly different from zero after correction for multiple comparisons, located in extrastriate cortex.
Figure 2.
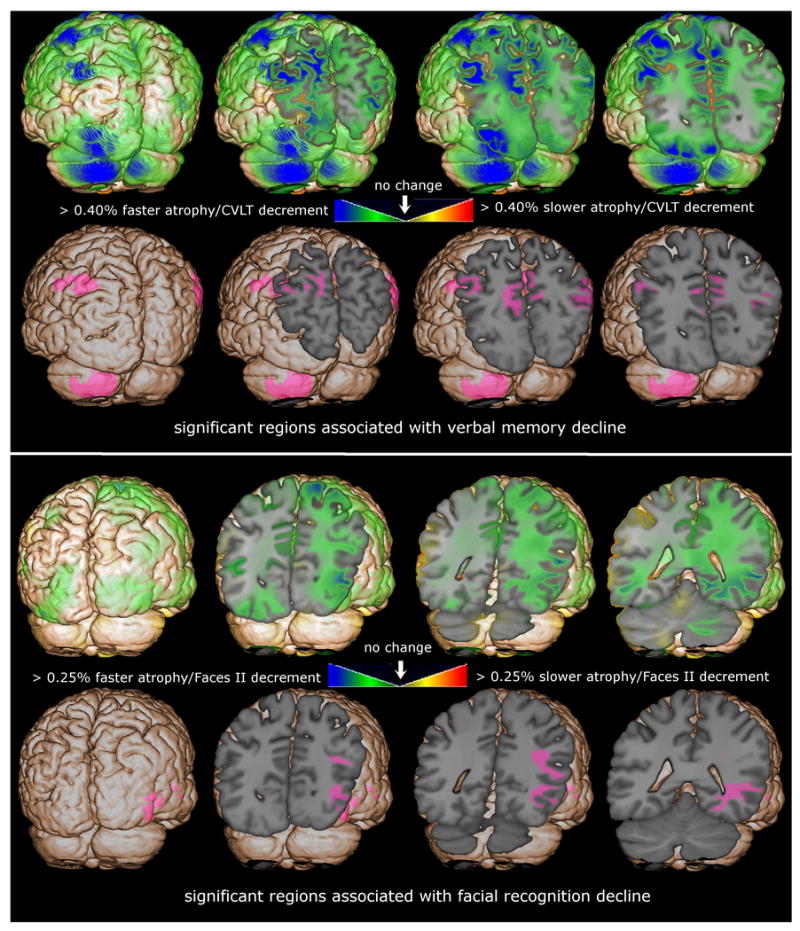
The magnitude of the regression coefficient estimate of the rate of atrophy regression onto change in cognitive score and the regions where these estimates are significantly different from zero are mapped, overlaid on the spatially normalized average brain. The top panel shows the association between rate of atrophy and change in delayed verbal memory (CVLT delayed score) and the bottom panel shows associations with change in delayed facial recognition. The green/blue voxels show regions where greater atrophy rate was underlying cognitive decline; the pink shaded voxels show regions statistically significant after correction for multiple comparisons.
4. Discussion
The longitudinal course of PTSD in middle-aged veterans is heterogeneous, both in the clinical course of the disease as measured by change in CAPS scores and the effect of PTSD on the brain as measured by the rate of ongoing tissue volume change. When all 25 PTSD+ veterans were compared to 22 PTSD- controls, there were no significant differences in the rate of ongoing tissue volume change measured between baseline and 24+ months later. Regression analyses identified baseline GM volume, baseline age, and change in CAPS score as significant predictors of longitudinal atrophy. Further exploration showed that among the 25 PTSD+ veterans, 11 had symptom reductions (15-40 point CAPS score decrease) and 9 had worsening symptoms (2-47 point CAPS score increase). Using DBM, PTSD+ Improvers and PTSD+ Non-Improvers were then compared to PTSD-, after covarying for baseline age and GM volume. We found little evidence for accelerated brain atrophy in PTSD+ veterans with improving symptoms, with only a small left parietal region showing greater ongoing tissue loss than PTSD-. Deteriorating PTSD+ patients showed accelerated aging throughout the brain, particularly brainstem and frontal and temporal GM and WM. Lastly, greater rates of brain atrophy were associated with greater rates of decline in verbal memory and delayed facial recognition.
4.1 Age-related longitudinal atrophy
Raz and colleagues showed that brain tissue loss accelerates beginning in the sixth decade (Raz et al., 2005). Consistent with this, we observed that greater age was associated with faster rates of atrophy in the corpus callosum, thalamus, brainstem, hippocampus, frontal lobe, and cerebellum. Faster rates of atrophy might also be expected in participants with a longer time since trauma, or longer duration of PTSD. In our sample of PTSD+ veterans with military-related trauma, baseline age and time since trauma were almost totally confounded (r=0.79, p≪0.001), and we cannot determine the separate effects of age and time since trauma on longitudinal atrophy. However, since there are no differences in time since trauma or age between the PTSD+ Improvers and Non-Improvers, we feel confident that duration of PTSD cannot account for the differing patterns of longitudinal atrophy.
4.2 Regions associated with faster rates of atrophy in PTSD+ Improvers and Non-Improvers
Faster rates of atrophy in the frontal lobe were associated with larger longitudinal increases in the CAPS score (i.e., increasing PTSD symptoms), which could be explained by greater atrophy in patients with increasing symptoms or recovery of tissue volume in patients with decreasing symptoms, or both. Subsequent comparison of PTSD+ Improvers to PTSD-provided no evidence for tissue volume recovery in PTSD+ Improvers, and comparison of PTSD+ Non-Improvers to PTSD- showed evidence for accelerated atrophy in PTSD+ Non-Improvers. Therefore, our results show that decreasing PTSD symptoms is not accompanied by tissue volume recovery, but increasing PTSD symptoms are accompanied by greater longitudinal tissue loss.
There were no differences in the rate of longitudinal brain volume change in PTSD+ Improvers compared to PTSD- veterans, except for accelerated atrophy in a small region that included parts of the postcentral and supramarginal gyri. The supramarginal gyrus is a sensory association area implicated in visuospatial processing and response to threat (Coan et al., 2006). Decreased blood flow in the supramarginal gyrus has been reported in PTSD+ women with a history of childhood sexual abuse (Bremner et al., 1999), and our results suggest that ongoing longitudinal tissue loss may underlie this blood flow abnormality.
Some symptoms of PTSD have been attributed to an overactive sympathetic nervous system response, decreased parasympathetic response, or both (van der Kolk, 2006), which could be related to our observation of greater rates of longitudinal brainstem atrophy in PTSD+ Non-Improvers. Thalamic hypofunction has been reported in PTSD (Lanius et al., 2001), and a positive correlation between extrastriate perfusion and PTSD symptoms has been reported (Bonne et al., 2003), which may be related to our observation of greater longitudinal thalamic and extrastriate cortical atrophy in PTSD+ Non-Improvers.
Multiple studies have reported functional or structural abnormalities in the remaining regions where greater rate of longitudinal atrophy was observed in our PTSD+ veterans: insula, anterior cingulate, dorsolateral prefrontal cortex, and anterior temporal lobe. The insula, part of the limbic system, plays a role in the processing of emotional stimuli and regulation of the sympathetic and parasympathetic nervous systems, and has been implicated in PTSD (Nagai et al., 2007). Anterior cingulate cortex is involved in autonomic control and emotion processing, which are both impaired in PTSD. The dorsolateral prefrontal cortex has connections to orbitofrontal cortex, thalamus, caudate, hippocampus, and other lobes of the brain, and plays a role in motor planning, organization, regulation, and working memory (Hoshi, 2006). In the insula, PTSD patients have reduced GM density (Chen et al., 2006) and decreased blood flow in response to emotional Stroop (Bremner et al., 2004). An fMRI study revealed PTSD-related abnormalities of dorsolateral prefrontal cortex and anterior cingulate during a working memory task (Moores et al., 2008). Cortical thinning and volume loss in the frontal and temporal lobes have been reported in PTSD (Woodward et al., 2009). Taken together, our reports of ongoing atrophy in these cortical regions is consistent with prior studies.
4.3 Regions underlying cognitive decline
The precuneus is known to play a role in episodic memory, self-awareness and visuospatial processing, and fMRI studies have reported decreased precuneus activation during an encoding task in PTSD+ veterans (Geuze et al., 2008) and decreased functional connectivity between precuneus and other regions of the default network (Bluhm et al., 2009). Although we did not observe significant group differences, we observed a positive relationship between longitudinal atrophy in the precuneus and longitudinal decline in verbal memory. It is possible that functional impairment of the precuneus occurs before structural changes can be observed using MRI, or that the additional damage to the precuneus only occurs in those patients with declining cognition. Alternatively, since verbal memory declines and precuneus abnormalities are both associated with Alzheimer's disease (Buckner, 2004), it is possible that this association is driven by participants in an early, asymptomatic stage of dementia. We also observed a positive relationship between longitudinal atrophy in the extrastriate cortex and longitudinal decline in delayed facial recognition, which is not surprising since extrastriate cortex is critical for facial recognition (Ishai and Yago, 2006).
4.4 Longitudinal hippocampal atrophy
Although hippocampal and amygdala atrophy have been reported in PTSD, we did not observe greater rates of atrophy in these regions in PTSD. It is possible that PTSD-related hippocampal volume loss predates exposure (Gilbertson et al., 2002; Yehuda et al., 2007) or occurs relatively soon after trauma exposure, with no subsequent ongoing atrophy. The mean time since trauma in our PTSD+ veterans was 31 ± 6 years (range 14-38 years), so this explanation is plausible. Longitudinal hippocampal atrophy was significantly associated with baseline age, so it is also possible that the contribution of PTSD to longitudinal hippocampal atrophy is small relative to aging or early Alzheimer's effects.
4.5 Limitations and strengths
The greatest limitation of this work is the small sample once we subgrouped the PTSD+ participants into Improvers and Non-Improvers. Another limitation of the work is the inclusion of 3 participants who met psychiatric exclusion criteria at follow-up. These participants were analyzed in our earlier report of longitudinal neuropsychological functioning in this sample, and proved not to represent outliers in terms of neuropsychological performance (Samuelson et al., 2009), and were included in this report. One of these participants was a PTSD+ Improver and 2 were PTSD+ Non-Improvers. Omitting these participants from the analysis resulted in very similar statistical maps with some reduction in the volume of the clusters identified as significant after correction for multiple corrections. A further limitation is the paucity of information regarding medication and treatment history on each participants. Furthermore, the study would be stronger if we had more than two assessments per participant that allows to control for within subject variations. It is possible that in our chronic PTSD+ sample, changes in the CAPS score over the 2-3 year interval represent oscillations that are part of the natural history of the disorder and do not reflect true change, but more assessments would be necessary to address this possibility.
The greatest strength of this work is the longitudinal design. Aside from PTSD, many factors influence brain volume (e.g., age, prenatal exposure to alcohol, and more), resulting in highly variable regional brain volumes even among healthy, non-impaired subjects. Since it is impossible to control for everything, the most feasible approach to addressing the problem is to examine the course of PTSD longitudinally in a sample matched on as many factors as possible. Here we examined a sample of male veterans with similar age and similar trauma exposure. In this way, we have fewer confounding factors that might contribute to the observed ongoing injury.
5. Conclusion
In conclusion these results provide evidence of ongoing brain tissue loss in PTSD+ veterans with increasing PTSD symptoms, and may indicate ongoing brain injury due to PTSD. Furthermore, this raises the possibility that these patients will be at greater risk for future cognitive impairments and dementia. Highlighting this concern, Yaffe and colleagues have recently reported a two fold increase in the risk for dementia in veterans with PTSD (Yaffe et al.). Our findings and those of Yaffe and colleagues suggest that PTSD+ Vietnam veterans should be observed long term, to determine if they develop cognitive impairment at a higher rate than controls, similar to those reported for Holocaust survivors (Yehuda et al., 2006). We also demonstrated that MRI is sensitive to detection of brain changes in PTSD over an interscan interval of about two to three years, and quantitative MRI may be important for assessing the effects of PTSD treatments on the brain.
Supplementary Material
Acknowledgments
We are grateful to the staff at the Center for Imaging of Neurodegenerative Diseases at the San Francisco VA Hospital for MRI scanning, and to Linda Chao, Susanne Mueller, Brigitte Apfel, and Tim Durazzo for helpful comments. This work was partially supported by a DOD Center of Excellence Grant W81XWH-05-2-0094 I (PI: Cardenas), NIBIB R03EB8136 (PI: Cardenas), the Department of Veterans Affairs Sierra Pacific Mental Illness Research, Education, and Clinical Center (MIRECC), a Department of Veterans Affairs Merit Award Grant (PI: Weiner), and NCRR P41RR023953.
Footnotes
Publisher's Disclaimer: This is a PDF file of an unedited manuscript that has been accepted for publication. As a service to our customers we are providing this early version of the manuscript. The manuscript will undergo copyediting, typesetting, and review of the resulting proof before it is published in its final citable form. Please note that during the production process errors may be discovered which could affect the content, and all legal disclaimers that apply to the journal pertain.
References
- Blake DD, Weathers FW, Nagy LM, Kaloupek DG, Gusman FD, Charney DS, Keane TM. The development of a Clinician-Administered PTSD Scale. J Trauma Stress. 1995;8:75–90. doi: 10.1007/BF02105408. [DOI] [PubMed] [Google Scholar]
- Bluhm RL, Williamson PC, Osuch EA, Frewen PA, Stevens TK, Boksman K, Neufeld RW, Theberge J, Lanius RA. Alterations in default network connectivity in posttraumatic stress disorder related to early-life trauma. J Psychiatry Neurosci. 2009;34:187–194. [PMC free article] [PubMed] [Google Scholar]
- Bonne O, Brandes D, Gilboa A, Gomori JM, Shenton ME, Pitman RK, Shalev AY. Longitudinal MRI study of hippocampal volume in trauma survivors with PTSD. Am J Psychiatry. 2001;158:1248–1251. doi: 10.1176/appi.ajp.158.8.1248. [DOI] [PMC free article] [PubMed] [Google Scholar]
- Bonne O, Gilboa A, Louzoun Y, Brandes D, Yona I, Lester H, Barkai G, Freedman N, Chisin R, Shalev AY. Resting regional cerebral perfusion in recent posttraumatic stress disorder. Biol Psychiatry. 2003;54:1077–1086. doi: 10.1016/s0006-3223(03)00525-0. [DOI] [PubMed] [Google Scholar]
- Bremner JD, Narayan M, Staib LH, Southwick SM, McGlashan T, Charney DS. Neural correlates of memories of childhood sexual abuse in women with and without posttraumatic stress disorder. Am J Psychiatry. 1999;156:1787–1795. doi: 10.1176/ajp.156.11.1787. [DOI] [PMC free article] [PubMed] [Google Scholar]
- Bremner JD, Randall P, Scott TM, Bronen RA, Seibyl JP, Southwick SM, Delaney RC, McCarthy G, Charney DS, Innis RB. MRI-based measurement of hippocampal volume in patients with combat-related posttraumatic stress disorder. Am J Psychiatry. 1995;152:973–981. doi: 10.1176/ajp.152.7.973. [DOI] [PMC free article] [PubMed] [Google Scholar]
- Bremner JD, Vermetten E, Vythilingam M, Afzal N, Schmahl C, Elzinga B, Charney DS. Neural correlates of the classic color and emotional stroop in women with abuse-related posttraumatic stress disorder. Biol Psychiatry. 2004;55:612–620. doi: 10.1016/j.biopsych.2003.10.001. [DOI] [PubMed] [Google Scholar]
- Buckner RL. Memory and executive function in aging and AD: multiple factors that cause decline and reserve factors that compensate. Neuron. 2004;44:195–208. doi: 10.1016/j.neuron.2004.09.006. [DOI] [PubMed] [Google Scholar]
- Cardenas V, Meyerhoff D, Studholme C, Kornak J, Rothlind J, Lampiris H, Neuhaus J, Grant R, Chao L, Truran D, Weiner M. Evidence for ongoing brain injury in human immunodeficiency virus-positive patients treated with antiretroviral therapy. J Neurovirol. 2009:1–10. doi: 10.1080/13550280902973960. [DOI] [PMC free article] [PubMed] [Google Scholar]
- Cardenas VA, Studholme C, Gazdzinski S, Durazzo TC, Meyerhoff DJ. Deformation-based morphometry of brain changes in alcohol dependence and abstinence. Neuroimage. 2007;34:879–887. doi: 10.1016/j.neuroimage.2006.10.015. [DOI] [PMC free article] [PubMed] [Google Scholar]
- Chen S, Xia W, Li L, Liu J, He Z, Zhang Z, Yan L, Zhang J, Hu D. Gray matter density reduction in the insula in fire survivors with posttraumatic stress disorder: a voxel-based morphometric study. Psychiatry Res. 2006;146:65–72. doi: 10.1016/j.pscychresns.2005.09.006. [DOI] [PubMed] [Google Scholar]
- Coan JA, Schaefer HS, Davidson RJ. Lending a hand: social regulation of the neural response to threat. Psychol Sci. 2006;17:1032–1039. doi: 10.1111/j.1467-9280.2006.01832.x. [DOI] [PubMed] [Google Scholar]
- Corbo V, Clement MH, Armony JL, Pruessner JC, Brunet A. Size versus shape differences: contrasting voxel-based and volumetric analyses of the anterior cingulate cortex in individuals with acute posttraumatic stress disorder. Biol Psychiatry. 2005;58:119–124. doi: 10.1016/j.biopsych.2005.02.032. [DOI] [PubMed] [Google Scholar]
- De Bellis MD, Hall J, Boring AM, Frustaci K, Moritz G. A pilot longitudinal study of hippocampal volumes in pediatric maltreatment-related posttraumatic stress disorder. Biol Psychiatry. 2001;50:305–309. doi: 10.1016/s0006-3223(01)01105-2. [DOI] [PubMed] [Google Scholar]
- De Nardo D, Nguyen T, Hamilton JA, Scholz GM. Down-regulation of IRAK-4 is a component of LPS- and CpG DNA-induced tolerance in macrophages. Cell Signal. 2009;21:246–252. doi: 10.1016/j.cellsig.2008.10.009. [DOI] [PubMed] [Google Scholar]
- Delis JC, Kramer JH, Kaplan E, Ober BA. San Antonio. San Antonio Version. The Psychological Corporation; San Antonio: 1987. The California Verbal Learning Test. [Google Scholar]
- Fennema-Notestine C, Stein MB, Kennedy CM, Archibald SL, Jernigan TL. Brain morphometry in female victims of intimate partner violence with and without posttraumatic stress disorder. Biol Psychiatry. 2002;52:1089–1101. doi: 10.1016/s0006-3223(02)01413-0. [DOI] [PubMed] [Google Scholar]
- First MB, Spitzer RL, Williams JBW, Gibbon M. Structured Clinical Interview for DSM-IV (SCID-I) New York State Psychiatric Institute, Biometrics Research; New York: 1996. [Google Scholar]
- Geuze E, Vermetten E, de Kloet CS, Westenberg HG. Precuneal activity during encoding in veterans with posttraumatic stress disorder. Prog Brain Res. 2008;167:293–297. doi: 10.1016/S0079-6123(07)67026-5. [DOI] [PubMed] [Google Scholar]
- Gilbertson MW, Shenton ME, Ciszewski A, Kasai K, Lasko NB, Orr SP, Pitman RK. Smaller hippocampal volume predicts pathologic vulnerability to psychological trauma. Nat Neurosci. 2002;5:1242–1247. doi: 10.1038/nn958. [DOI] [PMC free article] [PubMed] [Google Scholar]
- Gurvits TV, Shenton ME, Hokama H, Ohta H, Orr SP, Lasko NB, Kikinis R, Jolesz FA, McCarley RW, Pitman RK. Magnetic resonance imaging study of hippocampal volume in chronic, combat-related post-traumatic stress disorder. Biological Psychiatry. 1996;40:1091–1099. doi: 10.1016/S0006-3223(96)00229-6. [DOI] [PMC free article] [PubMed] [Google Scholar]
- Hoshi E. Functional specialization within the dorsolateral prefrontal cortex: a review of anatomical and physiological studies of non-human primates. Neurosci Res. 2006;54:73–84. doi: 10.1016/j.neures.2005.10.013. [DOI] [PubMed] [Google Scholar]
- Ishai A, Yago E. Recognition memory of newly learned faces. Brain Res Bull. 2006;71:167–173. doi: 10.1016/j.brainresbull.2006.08.017. [DOI] [PubMed] [Google Scholar]
- Karl A, Schaefer M, Malta LS, Dorfel D, Rohleder N, Werner A. A meta-analysis of structural brain abnormalities in PTSD. Neurosci Biobehav Rev. 2006;30:1004–1031. doi: 10.1016/j.neubiorev.2006.03.004. [DOI] [PubMed] [Google Scholar]
- Lanius RA, Williamson PC, Densmore M, Boksman K, Gupta MA, Neufeld RW, Gati JS, Menon RS. Neural correlates of traumatic memories in posttraumatic stress disorder: a functional MRI investigation. Am J Psychiatry. 2001;158:1920–1922. doi: 10.1176/appi.ajp.158.11.1920. [DOI] [PubMed] [Google Scholar]
- Moores KA, Clark CR, McFarlane AC, Brown GC, Puce A, Taylor DJ. Abnormal recruitment of working memory updating networks during maintenance of trauma-neutral information in post-traumatic stress disorder. Psychiatry Res. 2008;163:156–170. doi: 10.1016/j.pscychresns.2007.08.011. [DOI] [PubMed] [Google Scholar]
- Nagai M, Kishi K, Kato S. Insular cortex and neuropsychiatric disorders: a review of recent literature. Eur Psychiatry. 2007;22:387–394. doi: 10.1016/j.eurpsy.2007.02.006. [DOI] [PubMed] [Google Scholar]
- Neylan TC, Lenoci M, Rothlind J, Metzler TJ, Schuff N, Du AT, Franklin KW, Weiss DS, Weiner MW, Marmar CR. Attention, learning, and memory in posttraumatic stress disorder. J Trauma Stress. 2004;17:41–46. doi: 10.1023/B:JOTS.0000014675.75686.ee. [DOI] [PMC free article] [PubMed] [Google Scholar]
- Rauch SL, Shin LM, Segal E, Pitman RK, Carson MA, McMullin K, Whalen PJ, Makris N. Selectively reduced regional cortical volumes in post-traumatic stress disorder. Neuroreport. 2003;14:913–916. doi: 10.1097/01.wnr.0000071767.24455.10. [DOI] [PubMed] [Google Scholar]
- Raz N, Lindenberger U, Rodrigue KM, Kennedy KM, Head D, Williamson A, Dahle C, Gerstorf D, Acker JD. Regional brain changes in aging healthy adults: general trends, individual differences and modifiers. Cereb Cortex. 2005;15:1676–1689. doi: 10.1093/cercor/bhi044. [DOI] [PubMed] [Google Scholar]
- Samuelson KW, Neylan TC, Lenoci M, Metzler TJ, Cardenas V, Weiner MW, Marmar CR. Longitudinal effects of PTSD on memory functioning. J Int Neuropsychol Soc. 2009;15:853–861. doi: 10.1017/S1355617709990282. [DOI] [PubMed] [Google Scholar]
- Samuelson KW, Neylan TC, Metzler TJ, Lenoci M, Rothlind J, Henn-Haase C, Choucroun G, Weiner MW, Marmar CR. Neuropsychological functioning in posttraumatic stress disorder and alcohol abuse. Neuropsychology. 2006;20:716–726. doi: 10.1037/0894-4105.20.6.716. [DOI] [PMC free article] [PubMed] [Google Scholar]
- Schuff N, Neylan TC, Fox-Bosetti S, Lenoci M, Samuelson KW, Studholme C, Kornak J, Marmar CR, Weiner MW. Abnormal N-acetylaspartate in hippocampus and anterior cingulate in posttraumatic stress disorder. Psychiatry Res. 2008;162:147–157. doi: 10.1016/j.pscychresns.2007.04.011. [DOI] [PMC free article] [PubMed] [Google Scholar]
- Schuff N, Neylan TC, Lenoci MA, Du AT, Weiss DS, Marmar CR, Weiner MW. Decreased hippocampal N-acetylaspartate in the absence of atrophy in posttraumatic stress disorder. Biol Psychiatry. 2001;50:952–959. doi: 10.1016/s0006-3223(01)01245-8. [DOI] [PMC free article] [PubMed] [Google Scholar]
- Skinner HA, Sheu WJ. Reliability of alcohol use indices. The Lifetime Drinking History and the MAST. J Stud Alcohol. 1982;43:1157–1170. doi: 10.15288/jsa.1982.43.1157. [DOI] [PubMed] [Google Scholar]
- van der Kolk BA. Clinical implications of neuroscience research in PTSD. Ann N Y Acad Sci. 2006;1071:277–293. doi: 10.1196/annals.1364.022. [DOI] [PubMed] [Google Scholar]
- Weathers FW, Keane TM, Davidson JR. Clinician-administered PTSD scale: a review of the first ten years of research. Depress Anxiety. 2001;13:132–156. doi: 10.1002/da.1029. [DOI] [PubMed] [Google Scholar]
- Wechsler D. Wechsler Memory Scale-Third Edition (WMS-III) The Psychological Corporation; San Antonio, TX: 1987. [Google Scholar]
- Weniger G, Lange C, Sachsse U, Irle E. Amygdala and hippocampal volumes and cognition in adult survivors of childhood abuse with dissociative disorders. Acta Psychiatr Scand. 2008;118:281–290. doi: 10.1111/j.1600-0447.2008.01246.x. [DOI] [PubMed] [Google Scholar]
- Woodward SH, Schaer M, Kaloupek DG, Cediel L, Eliez S. Smaller global and regional cortical volume in combat-related posttraumatic stress disorder. Arch Gen Psychiatry. 2009;66:1373–1382. doi: 10.1001/archgenpsychiatry.2009.160. [DOI] [PubMed] [Google Scholar]
- Worsley KJ, Liao CH, Aston J, Petre V, Duncan GH, Morales F, Evans AC. A general statistical analysis for fMRI data. Neuroimage. 2002;15:1–15. doi: 10.1006/nimg.2001.0933. [DOI] [PubMed] [Google Scholar]
- Yaffe K, Vittinghoff E, Lindquist K, Barnes D, Covinsky KE, Neylan T, Kluse M, Marmar C. Posttraumatic stress disorder and risk of dementia among US veterans. Arch Gen Psychiatry. 67:608–613. doi: 10.1001/archgenpsychiatry.2010.61. [DOI] [PMC free article] [PubMed] [Google Scholar]
- Yamasue H, Kasai K, Iwanami A, Ohtani T, Yamada H, Abe O, Kuroki N, Fukuda R, Tochigi M, Furukawa S, Sadamatsu M, Sasaki T, Aoki S, Ohtomo K, Asukai N, Kato N. Voxel-based analysis of MRI reveals anterior cingulate gray-matter volume reduction in posttraumatic stress disorder due to terrorism. Proc Natl Acad Sci U S A. 2003;100:9039–9043. doi: 10.1073/pnas.1530467100. [DOI] [PMC free article] [PubMed] [Google Scholar]
- Yehuda R, Golier JA, Tischler L, Harvey PD, Newmark R, Yang RK, Buchsbaum MS. Hippocampal volume in aging combat veterans with and without post-traumatic stress disorder: relation to risk and resilience factors. J Psychiatr Res. 2007;41:435–445. doi: 10.1016/j.jpsychires.2005.12.002. [DOI] [PubMed] [Google Scholar]
- Yehuda R, Tischler L, Golier JA, Grossman R, Brand SR, Kaufman S, Harvey PD. Longitudinal assessment of cognitive performance in Holocaust survivors with and without PTSD. Biol Psychiatry. 2006;60:714–721. doi: 10.1016/j.biopsych.2006.03.069. [DOI] [PubMed] [Google Scholar]
Associated Data
This section collects any data citations, data availability statements, or supplementary materials included in this article.