

Abstract
Objective
To develop a risk stratification score to predict warfarin-associated hemorrhage
Background
Optimal decision-making regarding warfarin use for atrial fibrillation requires estimation of hemorrhage risk.
Methods
We followed 9,186 patients with atrial fibrillation contributing 32,888 person-years of follow-up on warfarin, obtaining data from clinical databases and validating hemorrhage events using medical record review. We used Cox regression models to develop a hemorrhage risk stratification score, selecting candidate variables using bootstrapping approaches. The final model was internally validated via split-sample testing and compared to six published hemorrhage risk schemes.
Results
We observed 461 first major hemorrhages during follow-up (1.4% annually). Five independent variables were included in the final model and weighted by regression coefficients: anemia (3 points), severe renal disease (e.g., glomerular filtration rate < 30 ml/min or dialysis-dependent, 3 points), age ≥ 75 years (2 points), prior bleeding (1 point), and hypertension (1 point). Major hemorrhage rates ranged from 0.4% (0 points) to 17.3% per year (10 points). Collapsed into a 3-category risk score, major hemorrhage rates were 0.8% in the low risk group (0-3 points), 2.6% in intermediate risk (4 points), and 5.8% in high risk (5-10 points). The c-index for the continuous risk score was 0.74 and 0.69 for the 3-category score, higher than in the other risk schemes. There was net reclassification improvement versus all six comparators (from 27% to 56%).
Conclusions
A simple 5-variable risk score was effective in quantifying the risk of warfarin-associated hemorrhage in a large community-based cohort of patients with atrial fibrillation.
Keywords: anticoagulants, atrial fibrillation, hemorrhage, risk prediction, warfarin
Introduction
Oral anticoagulants such as warfarin can substantially reduce the thromboembolic consequences of atrial fibrillation(1). However, anticoagulant-associated hemorrhage deters many clinicians from prescribing warfarin(2). Accurate risk stratification according to hemorrhage risk would facilitate the anticoagulation decision for individual patients, and could help control for varying hemorrhage risk across different studies or when comparing the safety of various antithrombotic agents. We describe the development and internal validation of a new hemorrhage risk stratification tool and compare its performance to other published hemorrhage risk schemes.
Methods
The AnTicoagulation and Risk factors In Atrial fibrillation (ATRIA) study followed 13,559 adults with nonvavular, non-transient atrial fibrillation enrolled in Kaiser Permanente of Northern California, a large integrated healthcare system. Details of the cohort assembly have been described previously; briefly, subjects were identified by searching clinical databases for International Classification of Diseases, Ninth Revisions, Clinical Modification (ICD-9) codes for atrial fibrillation between July 1, 1996 and December 31, 1997, and followed through September 30, 2003(3,4). Warfarin exposure was determined using a previously described and validated algorithm based on the number of days supplied per prescription, refill patterns, and intervening INR measurements(3). Clinical variables were identified using ICD-9 codes, pharmacy prescriptions, and laboratory databases(3).
We identified six published, validated risk stratification schemes developed to predict warfarin-associated hemorrhage (Table 1) and searched for those specific risk factors in the ATRIA cohort (5-10). Variables unavailable in ATRIA (e.g., patient genotype) or not directly applicable to atrial fibrillation (e.g., acute pulmonary embolism) were not included as potential variables. Prior bleeding history was defined as any prior outpatient or inpatient ICD-9 diagnosis code of hemorrhage, including by specific organ system (e.g., prior intracranial or gastrointestinal bleeding), in the aggregate (e.g., all-cause prior bleeding), and by timing (within 90 days or > 90 days). High fall risk was defined as any prior hospitalization with a discharge diagnosis code indicating mechanical fall that occurred in either the inpatient or outpatient setting.
Table 1. Risk Stratification Schemes Used to Predict Warfarin-Associated Hemorrhage.
| Risk Scheme | Risk Factors | Risk Category | Points | Major Bleeding Rate in Validation Cohorts |
|---|---|---|---|---|
| Outpatient Bleeding Index (Beyth et al, 1998 modification of bleeding index developed by Landefeld and Goldman)(5) Developed in patients newly starting warfarin after hospital discharge |
|
Low | 0 | 3% at 12 months |
| Intermediate | 1-2 | 8% at 12 months | ||
| High | 3-4 | 30% at 12 months | ||
| Kuijer et al, 1999(6) Developed in patients with acute thromboembolism |
|
Low | 0 | 0.6% at 3 months |
| Intermediate | >0 and <3 | 2% at 3 months | ||
| High | ≥ 3 | 7% at 3 months | ||
| Kearon et al, 2003(7) Developed in patients with acute venous thromboembolism enrolled in a clinical trial†. Risk score categories developed and validated by Gage et al.(8) |
|
Low | 0-1 | 2.5 per 100 person-years |
| Intermediate | 2 | 6.5 per 100 person-years | ||
| 3 | 9.3 per 100 person-years | |||
| High | ≥ 4 | 15.3 per 100 person-years | ||
| HEMORR2HAGES (Gage et al, 2006)(8) Developed in hospitalized Medicare patients with atrial fibrillation discharged on warfarin |
|
Low | 0-1 | 1.9-2.5 per 100 person-years |
| Intermediate | 2-3 | 5.3-8.4 per 100 person-years | ||
| High | ≥ 4 | 10.4-12.3 per 100 person-years | ||
| Shireman et al, 2006(9) Developed in hospitalized Medicare patients with atrial fibrillation discharged on warfarin | Risk score= 0.49(age≥70)+0.32(female) +0.58(remote bleed)+0.62(recent bleed)+0.71(alcohol/drug abuse)+0.27(diabetes) +0.86(anemia)+ 0.32(antiplatelet use) | Low | ≤ 1.07 | 0.9% within 90 days |
| Intermediate | > 1.07 and < 2.19 | 2.0% within 90 days | ||
| High | ≥ 2.19 | 5.4% within 90 days | ||
| RIETE risk scheme (Ruiz-Gimenez et al, 2008)(10) Developed in patients with acute venous thromboembolism |
|
Low | 0 | 0.1% at 3 months |
| Intermediate | 1-4 | 2.8% at 3 months | ||
| High | > 4 | 6.2% at 3 months |
Data on ethanol abuse, drug abuse, aspirin, and genetic factors not available in ATRIA database
Hemorrhage rates when risk scheme applied to Gage et al. atrial fibrillation cohort(8)
Abbreviations: GI=gastrointestinal
Clinical laboratory databases were used to identify anemia (hemoglobin < 13g/dL in men and < 12 g/dL in women), thrombocytopenia (platelet count < 90,000), and renal insufficiency (measured by serum creatinine and estimated glomerular filtration rate (eGFR))(11). Abnormal laboratory values were considered abnormal from 3 months prior to 1 year after the date of the measurement, censored by a preceding or subsequent normal test value. If results were unavailable within the time window, the test was assumed normal based on the assumption that tests would be ordered if there were clinical suspicions.
Clopidogrel and ticlopidine exposure was determined from pharmacy databases and duration defined from prescription start date to 2 months after the end of the medication supply. Accurate assessment of aspirin and non-steroidal anti-inflammatory drugs (NSAIDs) exposure was not possible since these medications were predominantly obtained without prescription.
Major Hemorrhage Outcomes
We searched computerized databases for primary discharge ICD-9 codes for extracranial hemorrhages (i.e., gastrointestinal, genitourinary, retroperitoneal) and primary and secondary diagnoses of intracranial hemorrhage (intracerebral, subarachnoid, or subdural hemorrhages). Medical charts from potential hemorrhagic events were reviewed by a clinical outcomes committee using a formal study protocol. Only events that occurred during or within 5 days of preceding warfarin exposure were included. Hemorrhages not present on admission that occurred during the hospitalization or as a result of a procedure were excluded. We restricted the analysis to “major hemorrhages”, defined as fatal, requiring transfusion of ≥ 2 units packed blood cells, or hemorrhage into a critical anatomic site (e.g., intracranial, retroperitoneal).
Statistical Analyses
All follow-up periods on warfarin were included in the analysis. Cox proportional hazards regression models using time-varying covariates were used to examine the relationships between potential risk factors and hemorrhage outcomes with time origins set at the beginning of each follow-up period. Risk factor values were updated over follow-up with the proviso that no values were changed within seven days of an endpoint bleeding event.
The cohort was randomly divided into a split-sample “derivation” and “validation” cohort using a 2:1 ratio; models using time-varying covariates were developed in the derivation cohort and performance tested in the validation cohort. Covariates associated with major hemorrhage with a hazard ratio ≥ 1.5 were considered for potential inclusion in the final multivariable model. Since variable selection procedures may produce unstable results, we applied backward elimination selection on 1000 bootstrap samples from the derivation set, with ≥ 0.05 the significance level set for removing a variable. Final model variables were those selected in >50% of bootstrap samples(12). Model discrimination was evaluated using the c-index(13) and calibration by the goodness-of-fit test. Variables from the final multivariable Cox regression model were converted to a risk score, with points assigned to each predictor approximately proportional to the magnitude of the regression coefficients rounded to the nearest integer.
The risk score was collapsed into “low,” “intermediate,” and “high” risk groups based on the observed major hemorrhage rate. Since there are no definitive or clinically-determined cut-points for rates of major hemorrhage at which anticoagulation would be universally contraindicated, we chose thresholds in our point score that appeared to optimally aggregate low and high risk groups. We then applied the ATRIA model and six other risk schemes using time-varying covariates to the ATRIA cohort to compare model performance using the c-index, risk stratification capacity (the proportion of the cohort assigned to clinically meaningful risk categories), and by a recently published extension of the net reclassification improvement (NRI) metric(14). For NRI calculations, all schemes were compared using a low/intermediate/high categorization to provide a common scale. This study was approved by the respective institutional committees on human research boards.
Results
There were 9,186 individuals in the ATRIA cohort contributing 32,888 person-years of warfarin exposure (median warfarin duration = 3.5 years [IQR: 1.2-6.0]). Because anticoagulated patients could discontinue warfarin and subsequently resume therapy, individual patients could contribute multiple periods on warfarin; 2,790 patients (30%) had > 1 period on warfarin and 709 patients (8%) had > 2 periods on warfarin.
Model Development
We identified 461 validated incident warfarin-associated major hemorrhages, an annualized rate of 1.40% hemorrhages per year. The derivation cohort contained 307 major hemorrhages among 6,123 patients and the validation cohort 154 major hemorrhages among 3,063 patients.
Table 2 compares the characteristics of subjects with and without major hemorrhage in the derivation cohort. Variables associated with major hemorrhage at a hazard ratio ≥ 1.5 on bivariate analysis were considered for the final model and tested in 1000 bootstrap samples. Among the various definitions of renal disease and prior hemorrhage, “severe renal disease” (defined as eGFR < 30 mL/min or dialysis-dependent) and “any prior hemorrhage diagnosis (all-cause)” were selected over alternative definitions based on bootstrap analysis. Five final variables emerged in > 50% of bootstrap samples: anemia, severe renal disease, age ≥ 75 years, any prior hemorrhage diagnosis, and diagnosed hypertension. Based on the final model's regression coefficients, anemia and severe renal disease were assigned 3 points, age ≥ 75 years 2 points, and prior hemorrhage and diagnosed hypertension 1 point each, resulting in a risk scheme with a possible range of 0 – 10 points (Table 3).
Table 2. Clinical Characteristics of 6,123 Subjects with Atrial Fibrillation in Derivation Cohort Followed For 21,923 Person-years on Warfarin, Comparing Subjects Who Sustained Major Hemorrhage vs. Subjects without Major Hemorrhage.
| Clinical characteristic | Subjects with Major Hemorrhage N=307 |
Subjects without Major Hemorrhage N=5816 |
Hazard Ratio (95% CI) |
P value |
|---|---|---|---|---|
| % person-years | ||||
| Age | ||||
| ≥ 65 years | 91.5 | 84.3 | 3.3 (2.1-5.0) | <0.001 |
| ≥ 70 years | 79.7 | 72.1 | 2.7 (2.0-3.7) | <0.001 |
| ≥ 75 years | 61.7 | 53.1 | 2.5 (2.0-3.2) | <0.001 |
| Female | 37.4 | 42.0 | 1.0 (0.8-1.2) | 0.81 |
| Non-white race | 13.8 | 13.4 | 1.2 (0.9-1.6) | 0.20 |
| Any diagnosis of cancer | 18.0 | 15.1 | 1.7 (1.3-2.2) | <0.001 |
| Prior stroke | 17.4 | 12.4 | 1.4 (1.1-1.9) | 0.01 |
| Diagnosed hypertension | 64.7 | 61.9 | 1.5 (1.2-1.9) | <0.001 |
| Diabetes mellitus | 22.1 | 20.5 | 1.3 (1.0-1.7) | 0.03 |
| Recent myocardial infarction | 0.5 | 0.4 | 0.2 (0.0-1.2) | 0.08 |
| Prior intracranial hemorrhage | 0.9 | 0.5 | 0.9 (0.2-3.6) | 0.89 |
| Prior gastrointestinal hemorrhage | 12.1 | 6.8 | 2.1 (1.5-2.9) | <0.001 |
| Prior other hemorrhage | 2.9 | 3.1 | 1.3 (0.7-2.3) | 0.48 |
| Prior hematuria | 10.3 | 5.0 | 2.8 (1.9-3.9) | <0.001 |
| Any prior hemorrhage diagnosis (all-cause) | 24.1 | 14.5 | 2.2 (1.7-2.8) | <0.001 |
| Any prior hemorrhage diagnosis | ||||
| > 90 days prior | 21.9 | 13.4 | 3.4 (2.6-4.3) | <0.001 |
| Within 90 days | 2.2 | 1.0 | 0.3 (0.1-0.7) | 0.008 |
| Diagnosed peptic ulcer disease | 5.7 | 4.6 | 1.4 (0.9-2.2) | 0.11 |
| Diagnosed cirrhosis | 1.2 | 0.5 | 2.6 (1.1-6.1) | 0.03 |
| History of hepatitis | 1.3 | 1.0 | 1.3 (0.4-4.1) | 0.61 |
| Prior hospital discharge diagnosis of mechanical fall | 6.5 | 5.3 | 2.2 (1.5-3.2) | <0.001 |
| Diagnosed neuropsychiatric disease | 3.3 | 4.3 | 1.2 (0.7-2.0) | 0.51 |
| On clopidogrel or ticlopidine | 0.9 | 1.0 | 0.5 (0.2-1.3) | 0.14 |
| Anemia | 18.8 | 12.1 | 4.2 (3.4-5.3) | <0.001 |
| Platelet count < 90,000 | 0.6 | 0.5 | 0.5 (0.1-3.3) | 0.45 |
| Serum creatinine | ||||
| > 2.0 mg/dL | 4.0 | 2.0 | 4.8 (3.4-6.6) | <0.001 |
| > 1.5 mg/dL | 9.5 | 5.1 | 3.0 (2.2-3.9) | <0.001 |
| > 1.2 mg/dL | 18.0 | 10.5 | 1.8 (1.4-2.3) | <0.001 |
| eGFR < 30 mL/min | 5.9 | 2.7 | 4.3 (3.2-5.8) | <0.001 |
| On dialysis | 0.6 | 0.4 | 2.4 (1.0-5.5) | 0.05 |
| Hemoglobin A1c > 7.0 | 4.1 | 4.3 | 0.9 (0.5-1.6) | 0.68 |
Table 3. Final ATRIA Risk Score: Model Regression Coefficients and Hazard Ratios from Derivation, Validation, and Combined Cohorts.
| Derivation Cohort | Validation Cohort | Combined Cohort | |||||
|---|---|---|---|---|---|---|---|
| Variable | Points | Regression Coefficient | Hazard Ratio | Regression Coefficient | Hazard Ratio | Regression Coefficient | Hazard Ratio |
| Anemia | 3 | 1.19 | 3.28 | 1.17 | 3.22 | 1.18 | 3.27 |
| Severe renal disease* | 3 | 0.97 | 2.63 | 0.88 | 2.40 | 0.93 | 2.53 |
| Age ≥ 75 years | 2 | 0.71 | 2.03 | 0.65 | 1.92 | 0.69 | 1.99 |
| Any prior hemorrhage diagnosis | 1 | 0.52 | 1.68 | 0.28 | 1.32 | 0.44 | 1.56 |
| Diagnosed hypertension | 1 | 0.27 | 1.31 | 0.43 | 1.54 | 0.32 | 1.38 |
Defined as eGFR < 30 mL/min or dialysis-dependent
Model Validation and Performance
When applied to the validation set, the model generated regression coefficients similar to those in the derivation dataset, with good discrimination (c-index 0.74 [0.70-0.78]) and acceptable calibration by the goodness-of-fit test (p = 0.29). Bleeding rates in the combined cohort ranged from 0.4% to 17.3% per year (Table 4). The continuous risk score was collapsed to a 3-category scheme, where ‘low risk’ (0-3 points) patients had hemorrhage rates of < 1% per year, and ‘high risk’ (5 – 10 points) had rates > 5% per year (Table 4). The high risk category effectively concentrated hemorrhage events such that 42% of hemorrhage events occurred in only 10.2% of cohort person-years. The vast majority of remaining patients and person-years were low risk (Figure).
Table 4. Observed Major Bleeding Rates by Risk Score and Risk Category from each Cohort.
| Derivation Cohort | Validation Cohort | Combined Cohort | ||||
|---|---|---|---|---|---|---|
| Risk Score, points* | Events/Person -years | Events per 100 person-years | Events/Person -years | Events per 100 person-years | Events/Person -years | Events per 100 person-years |
| 0 | 12/3415 | 0.35 | 9/1879 | 0.48 | 21/5294 | 0.40 |
| 1 | 26/4925 | 0.53 | 14/2395 | 0.58 | 40/7320 | 0.55 |
| 2 | 40/3757 | 1.06 | 14/1806 | 0.78 | 54/5563 | 0.97 |
| 3 | 53/5998 | 0.88 | 38/2990 | 1.27 | 91/8988 | 1.01 |
| 4 | 44/1623 | 2.71 | 18/746 | 2.41 | 62/2369 | 2.62 |
| 5 | 42/663 | 6.34 | 13/311 | 4.18 | 55/973 | 5.65 |
| 6 | 53/1089 | 4.87 | 31/607 | 5.11 | 84/1696 | 4.95 |
| 7 | 17/285 | 5.97 | 5/141 | 3.56 | 22/426 | 5.17 |
| 8 | 2/45 | 4.43 | 4/17 | 23.11 | 6/62 | 9.61 |
| 9 | 14/102 | 13.78 | 6/59 | 10.13 | 20/161 | 12.43 |
| 10 | 4/23 | 17.74 | 2/12 | 16.34 | 6/35 | 17.25 |
|
| ||||||
| Risk Category, points* | ||||||
|
| ||||||
| Low (0–3) | 131/18094 | 0.72 | 75/9071 | 0.83 | 206/27166 | 0.76 |
| Intermediate (4) | 44/1623 | 2.71 | 18/746 | 2.41 | 62/2369 | 2.62 |
| High (5–10) | 132/2205 | 5.99 | 61/1147 | 5.32 | 193/3353 | 5.76 |
|
| ||||||
| Overall | 307/21923 | 1.40 | 154/10965 | 1.40 | 461/32888 | 1.40 |
3 points for anemia, severe renal disease [eGFR<30 or on dialysis]; 2 points for age ≥ 75; 1 point for prior bleeding, hypertension
Figure. Distribution of Cohort Person-years and Hemorrhage Events by Risk Categories.
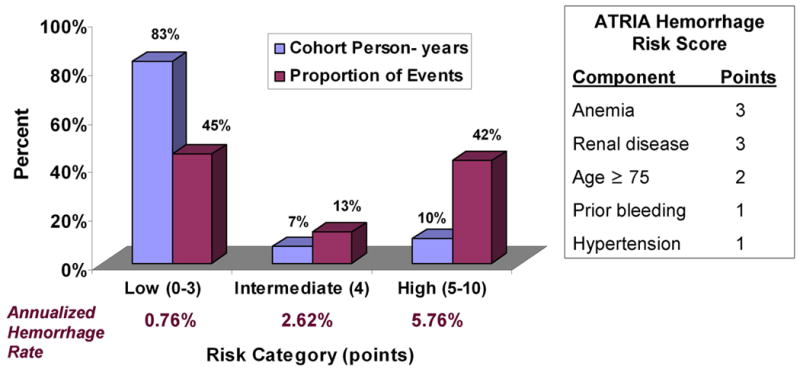
Blue bars show the proportion of cohort person-years in low, intermediate, and high bleeding risk categories. Purple bars show the proportion of the total hemorrhage events (n=461) captured by each risk category.
Compared with other risk schemes, the ATRIA risk score had the highest c-index point estimates for both the full range of scores and the 3-category scale and identified a comparatively large proportion of the cohort as either low or high-risk (Table 5). In contrast, other risk schemes either led to much smaller fractions of the cohort categorized as high-risk or observed relatively low event rates in their high-risk category. The ATRIA scheme led to sizable net reclassification improvement when compared to all other risk schemes, ranging from 27.7% to 56.6% improvement (Table 5).
Table 5. Comparison of Risk Stratification Capacity (% cohort person-years), Annualized Major Hemorrhage Rate, c-index, and Net Reclassification Improvement across Hemorrhage Risk Schemes.
| Risk Scheme | Low Risk | Intermediate Risk | High Risk | c-index (95% CI) for 3-category scores* | c-index (95% CI) for continuous scores† | Net Reclassification Improvement‡ | |||
|---|---|---|---|---|---|---|---|---|---|
| % pyrs | Rate | % pyrs | Rate | % pyrs | Rate | ||||
| ATRIA risk score | 82.6 | 0.76 | 7.2 | 2.62 | 10.2 | 5.76 | 0.69 (0.66-0.71) | 0.74 (0.72-0.76) | Referent |
| Outpatient Bleeding Index | 10.1 | 0.39 | 83.0 | 1.31 | 6.9 | 3.96 | 0.59 (0.58-0.61) | 0.68 (0.65-0.70) | 50.5% |
| Kuijer et al. | 7.2 | 0.42 | 77.7 | 1.40 | 15.1 | 1.89 | 0.56 (0.55-0.58) | 0.57 (0.54-0.59) | 56.6% |
| Kearon et al. | 58.2 | 0.61 | 38.7 | 2.27 | 3.1 | 5.53 | 0.67 (0.65-0.69) | 0.69 (0.67-0.71) | 27.7% |
| HEMORR2HAGES | 65.9 | 0.72 | 29.0 | 2.49 | 5.1 | 3.96 | 0.67 (0.65-0.70) | 0.71 (0.69-0.73) | 28.9% |
| Shireman et al. | 78.6 | 0.87 | 20.3 | 3.18 | 1.0 | 6.72 | 0.64 (0.61-0.66) | 0.70 (0.68-0.73) | 33.4% |
| RIETE risk scheme | 37.6 | 0.56 | 62.0 | 1.86 | 0.4 | 10.20 | 0.63 (0.61-0.66) | 0.68 (0.65-0.70) | 44.8% |
c-index calculated when risk schemes were separated into 3-categories (low, intermediate, high)
c-index calculated when risk schemes were in a continuous format
Net reclassification improvement calculated using the method by Pencina et al(14).
Discussion
Accurate prediction of hemorrhage risk on warfarin is vital to the anticoagulation decision. Based on five easily available clinical variables, the ATRIA score reflects the experience of a large, diverse group of patients with atrial fibrillation assembled from community care and followed for a longer time period than prior studies. The model development used rigorous contemporary methods such as split-sample testing and bootstrap sampling approaches to underwrite internal validity.
When collapsed into a 3-category risk score, the ATRIA risk scheme was able to identify sizable proportions of patients who fell into the most clinically meaningful categories, i.e., low or high risk for hemorrhage. The low-risk category, accounting for 83% of follow-up, had an observed major hemorrhage rate of < 1% per year. The high-risk category represented only 10.2% of patient follow-up yet accounted for 42% of the major bleeding events. The ATRIA scheme led to improvements in accurate net reclassification when compared to alternative schemes. The c-index of 0.74, while not representing perfect discrimination, indicates good performance for a prediction model and compares favorably to other widely used risk stratification schemes such as the CHADS2 stroke risk index, which has a c-index of ∼0.6(15). Certainly, identifying novel predictors of bleeding and improving current methods of risk stratification are important areas of further investigation.
The variables in our model have each been linked to increased hemorrhage risk in prior studies(5-10). Anemia was strongly associated with future bleeding risk. Although we were unable to determine the mechanism of association, anemia may reflect a predisposition to hemorrhage or recent subclinical hemorrhage. Severe renal disease was also a powerful predictor of hemorrhage risk. All-cause prior bleeding was associated with future bleeding, and presumably identifies patients with a potential bleeding lesion or diathesis. Finally, older age and hypertension were independently associated with hemorrhage risk. Similar to other hemorrhage risk schemes, this analysis focused on all-cause major hemorrhage, both intracranial and extracranial. Although intracranial hemorrhages are the most important outcomes, the rarity of such events makes their risk prediction challenging(16). High quality models to predict intracranial hemorrhage are vitally needed.
Our risk model is clinically applicable when counseling patients about the relative benefits and harms of anticoagulation. Particularly as newer, easier to administer anticoagulants become available, accurate estimates of hemorrhage risk will strongly influence the anticoagulation decision. Our risk score may not affect the anticoagulation decision for most patients at high risk for stroke, since they derive a large benefit from anticoagulation. However, bleeding risk is significantly more influential in patients at moderate or lower stroke risk. Our bleeding risk estimates can be incorporated into formal decision-analysis models or can be used to counsel individual patients about their estimated risks of stroke and bleeding. For such patients, providing estimates of the risk of bleeding on anticoagulation can be a very informative addition to individualized patient decision-making.
There are several limitations to our analysis. Our assessment of clinical risk factors was based on computerized databases that did not have information on several covariates such as measurements of blood pressure and genotype. We lacked information about non-prescription use of aspirin or NSAIDs. Although the hemorrhage rate in ATRIA was generally lower than described by the other risk schemes, the rates are similar to some recent randomized trials(17). Finally, it will be important to test the ATRIA risk scheme in a separate population. Although internal validation reduces the likelihood of chance playing a major role in development of our model, external validity needs to be tested empirically.
The risk of anticoagulant-associated hemorrhage is a major deterrent to more widespread use of anticoagulants. Risk stratification schemes can help clinicians estimate the magnitude of hemorrhage risk when prescribing or continuing anticoagulant therapy. Such schemes can also provide important information for comparing the hemorrhage risk of patients enrolled in clinical studies or when comparing the safety of different anticoagulation strategies(18).
Acknowledgments
Funding: This study was supported by the National Institute on Aging (R01 AG15478 and K23 AG028978), the National Heart, Lung and Blood Institute (U19 HL91179 and RC2HL101589), the Eliot B. and Edith C. Shoolman fund of the Massachusetts General Hospital (Boston, MA), and a research grant from Daiichi Sankyo, Inc. The funding sources had no role in study design, data collection, data analysis, data interpretation, or preparation of this manuscript. Dr. Fang had full access to all of the data in the study and takes responsibility for the integrity of the data and the accuracy of the data analysis.
Abbreviations
- ATRIA Study
AnTicoagulation and Risk factors In Atrial fibrillation Study
- CI
confidence interval
- eGFR
estimated glomerular filtration rate
- HEMORR2HAGES risk scheme
acronym for Hepatic/renal disease, Ethanol abuse, Malignancy, Older age, Reduced platelet count, Rebleeding risk, Hypertension, Anemia, Genetic factors, Excessive fall risk, and Stroke
- ICD-9
International Classification of Diseases, Ninth Revisions, Clinical Modification
- INR
international normalized ratio
- IQR
interquartile range
- RIETE
Registro Informatizado de la Enfermedad TromboEmbólica
Footnotes
Potential Financial Conflicts of Interest: D.E. Singer has consulted for Boehringer Ingelheim, Daiichi Sankyo, Inc., Johnson & Johnson, Inc., Merck and Co., Bayer Schering Pharma, and Sanofi Aventis, Inc., and has received research support from Daiichi Sankyo, Inc. A.S. Go has received research support from Johnson & Johnson, Inc.
Publisher's Disclaimer: This is a PDF file of an unedited manuscript that has been accepted for publication. As a service to our customers we are providing this early version of the manuscript. The manuscript will undergo copyediting, typesetting, and review of the resulting proof before it is published in its final citable form. Please note that during the production process errors may be discovered which could affect the content, and all legal disclaimers that apply to the journal pertain.
References
- 1.Hart R, Pearce LA, Aguilar MI. Meta-analysis: Antithrombotic therapy to prevent stroke in patients who have nonvalvular atrial fibrillation. Annals of Internal Medicine. 2007;146:857–867. doi: 10.7326/0003-4819-146-12-200706190-00007. [DOI] [PubMed] [Google Scholar]
- 2.Bungard TJ, Ghali WA, McAlister FA, et al. The relative importance of barriers to the prescription of warfarin for nonvalvular atrial fibrillation. Canadian Journal of Cardiology. 2003;19:280–284. [PubMed] [Google Scholar]
- 3.Go AS, Hylek EM, Borowsky LH, Phillips KA, Selby JV, Singer DE. Warfarin use among ambulatory patients with nonvalvular atrial fibrillation: The AnTicoagulation and Risk Factors in Atrial Fibrillation (ATRIA) study. Annals of Internal Medicine. 1999;131:927–934. doi: 10.7326/0003-4819-131-12-199912210-00004. [DOI] [PubMed] [Google Scholar]
- 4.Go AS, Hylek EM, Chang Y, et al. Anticoagulation therapy for stroke prevention in atrial fibrillation: how well do randomized trials translate into clinical practice? JAMA. 2003;290:2685–2692. doi: 10.1001/jama.290.20.2685. [DOI] [PubMed] [Google Scholar]
- 5.Beyth R, Quinn L, Landefeld C. Prospective evaluation of an index for predicting the risk of major bleeding in outpatients treated with warfarin. Am J Med. 1998;105:91–99. doi: 10.1016/s0002-9343(98)00198-3. [DOI] [PubMed] [Google Scholar]
- 6.Kuijer P, Hutten B, Prins M, Buller H. Prediction of the risk of bleeding during anticoagulant treatment for venous thromboembolism. Arch Intern Med. 1999;159:457–460. doi: 10.1001/archinte.159.5.457. [DOI] [PubMed] [Google Scholar]
- 7.Kearon C, Ginsberg JS, Kovacs MJ, et al. Comparison of low-intensity warfarin therapy with conventional-intensity warfarin therapy for long-term prevention of recurrent venous thromboembolism. N Engl J Med. 2003;349:631–639. doi: 10.1056/NEJMoa035422. [DOI] [PubMed] [Google Scholar]
- 8.Gage BF, Yan Y, Milligan PE, et al. Clinical classification schemes for predicting hemorrhage: results from the National Registry of Atrial Fibrillation (NRAF) Am Heart J. 2006;151:713–719. doi: 10.1016/j.ahj.2005.04.017. [DOI] [PubMed] [Google Scholar]
- 9.Shireman TI, Mahnken JD, Howard PA, Kresowik TF, Hou Q, Ellerbeck EF. Development of a contemporary bleeding risk model for elderly warfarin recipients. Chest. 2006;130:1390–1396. doi: 10.1378/chest.130.5.1390. [DOI] [PubMed] [Google Scholar]
- 10.Ruíz-Giménez N, Suárez C, González R, et al. Predictive variables for major bleeding events in patients presenting with documented acute venous thromboembolism. Findings from the RIETE Registry. Thrombosis and Haemostasis. 2008;100:26–31. doi: 10.1160/TH08-03-0193. [DOI] [PubMed] [Google Scholar]
- 11.Levey AS, Stevens LA, Schmid CH, et al. A new equation to estimate glomerular filtration rate. Ann Intern Med. 2009;150:604–612. doi: 10.7326/0003-4819-150-9-200905050-00006. [DOI] [PMC free article] [PubMed] [Google Scholar]
- 12.Austin PC, Tu JV. Bootstrap Methods for Developing Predictive Models. The American Statistician. 2004;58:131–137. [Google Scholar]
- 13.Kremers WK. Technical Report Series #80. Rochester, MN: Mayo Clinic; 2007. Concordance for Survival Time Data: Fixed and Time-Dependent Covariates and Possible Ties in Predictor and Time. [Google Scholar]
- 14.Pencina MJ, D'Agostino RB, Steyerberg EW. Extensions of net reclassification improvement calculations to measure usefulness of new biomarkers. Statistics in Medicine. 2011;30:11–21. doi: 10.1002/sim.4085. [DOI] [PMC free article] [PubMed] [Google Scholar]
- 15.Fang MC, Go AS, Chang Y, Borowsky L, Pomernacki N, Singer DE. Comparison of Risk Stratification Schemes to Predict Thromboembolism in People with Nonvalvular Atrial Fibrillation. Journal of the American College of Cardiology. 2008;51:810–815. doi: 10.1016/j.jacc.2007.09.065. [DOI] [PMC free article] [PubMed] [Google Scholar]
- 16.Fang MC, Go AS, Chang Y, et al. Death and disability from warfarin-associated intracranial and extracranial hemorrhages. American Journal of Medicine. 2007;120:700–705. doi: 10.1016/j.amjmed.2006.07.034. [DOI] [PMC free article] [PubMed] [Google Scholar]
- 17.Mant J, Hobbs R, Fletcher K, et al. Warfarin versus aspirin for stroke prevention in an elderly community population with atrial fibrillation (the Birmingham Atrial Fibrillation Treatment of the Aged Study, BAFTA): a randomised controlled trial. Lancet. 2007;370:493–503. doi: 10.1016/S0140-6736(07)61233-1. [DOI] [PubMed] [Google Scholar]
- 18.Connolly SJ, Ezekowitz MD, Yusuf S, et al. Dabigatran versus Warfarin in Patients with Atrial Fibrillation. N Engl J Med. 2009;361:1139–1151. doi: 10.1056/NEJMoa0905561. [DOI] [PubMed] [Google Scholar]