Abstract
Previous indicator dilution experiments in isolated blood-perfused dog hearts suggested that there was intramyocardial diffusional shunting of water relative to a flow-limited solute, antipyrine. Two sets of studies have been done to assess the importance of this shunting, since it implies the possibility of a diffusional bypass for oxygen and other substances, which may be important in ischemia. Nonconsumed tracers were used to show the phenomenon. In the first set, bolus injections of 133Xe dissolved in saline were made into the coronary inflow and the tracer content of the organ recorded by an external gamma detector. The initial Xe washout was disproportionately rapid at low flows, and the late phase was also relatively retarded. In the second set, boluses of cool saline containing indocyanine green were injected into the coronary arterial inflow while coronary sinus outflow dilution curves were recorded via a thermistor and a dye densitometer over a wide range of flows. The thermal curves showed emergence of heat preceding the dye; the degree of precession was much greater at low flows, and, unlike the dye curves, the thermal dilution curves showed dramatic differences in shape at different flows. A model for ditfusional countercurrent exchange shows similar changes in residue curves and outflow dilution curves. The conclusion is that there is diffusional shunting of small lipid-soluble molecules whose diffusion coefficients in tissue are high. While the shunting of heat is great, the shunting of soluble gases will not be large and that of normal substrates will be negligible.
INTRODUCTION
The washout of a highly diffusible substance from an organ is commonly used for estimating flow, based on the assumption that the rate of washout is governed by the flow. We had observed that the washout curves of 133Xe and 131I-antipyrine (IAp) from the heart were consistently different (Bassingthwaighte and Yipintsoi, 1970), despite the high diffusivities of the solutes and the generally held view that both were flow-limited in their exchange and washout. 133Xe washout was more rapid than IAp at early times and less rapid at later times. The degree of difference was related to the flow; at low flows early washout of Xe was relatively faster and at high flows was closer to the rate of washout of IAp. This raised the question of whether or not the escape of Xe could be governed in part by diffusional shunting in the heart.
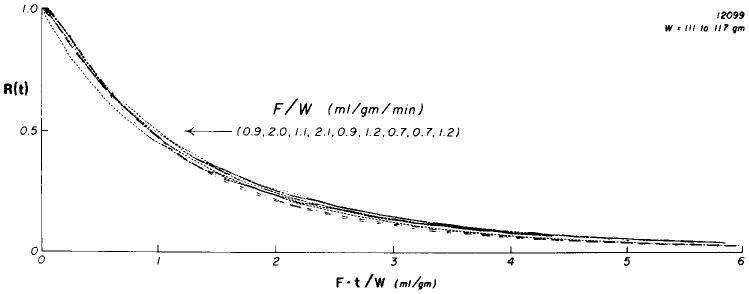
Data taken from the experiments of Yipintsoi and Bassingthwaighte (1970) illustrate that the forms of the washout curves for antipyrine are virtually dominated by the flow, and therefore by direct inference, not at all influenced by any diffusional events. Figure 1 shows a set of their washout curves for 125I-antipyrine following its injection into the root of the aorta of an isolated blood-perfused dog heart. The curves are normalized with respect to the flow, which varied over a three-fold range, by using an abscissa of flow times time, so that the abscissa is the volume which has emerged. The curves are almost superimposed on one another, indicating that flow dominates the overall transport. Any diffusional influence would take a constant amount of time, independent of the flow, but since the curves become superimposed by this scaling, any influence by diffusion must be negligible. There are no systematic differences at different flows, again suggesting that the influence of diffusion is negligible. The conclusion is that IAp is flow-limited in the heart. This evidence denies both diffusional shunting and any incompleteness of exchange during transcapillary passage.
Fig. 1.
Residue function curves, R(t), for 125I-antipyrine in an isolated blood-perfused dog heart. The blood flows ranged from 0.7 to 2.1 ml g−1 min−1; these flows are indicated with respect to each of the curves at the position from left to right as they cross the 50% washout point indicated by the arrow. The curves are very similar in shape; there is no systematic influence of flow on the position at which an individual curve reaches 50, 30, or 10% retained tracer. These curves therefore show “similarity” in their residue functions.
However, Yipintsoi and Bassingthwaighte (1970) observed a difference between IAp and tritiated water dilution curves in these same hearts. The coronary sinus outflow dilution curves for water, especially at low flows, exhibited an earlier more rapid emergence than did antipyrine, which was interpreted (Yipintsoi et al., 1969) as evidence of countercurrent diffusional shunting. At high flows, even as high as four times a normal flow of 1 ml g−1 min−1, the water and IAp curves were essentially similar; this demonstrated that there was no difference in transcapillary extraction, and, since the diffusion coefficients are quite different, strongly implied that there was no diffusion limitation to transport across the capillary membrane and that the transport of both tracers was limited solely by the flow through each capillary–tissue region.
The same type of phenomenon was observed for xenon (Bassingthwaighte and Yipintsoi, 1970) while recording by external gamma detection the washout curves for 133Xe and IAp; the xenon at low flows showed relatively high emergence rates during the initial phases of the washout but showed a relative retention within the tissue. This reinforced the observations of Bassingthwaighte et al. (1968) on paired but temporally separated washout curves for IAp and 133Xe. The only explanation for the rapid emergence of the more diffusible tracers at low flows seems to be a diffusional shunting, presumably from the arterial inflow region of the microvasculature to the venous outflow region; at high flows there is less time for such shunting to occur, and as with the renal countercurrent system, the efficiency of any countercurrent exchange system diminishes with increased flow. The general concepts of flow versus diffusion limitation to microvascular exchanges in the heart have been reviewed by Bassingthwaighte (1977).
It is the diffusional shunting of gases of metabolic importance that is of particular interest. Perl and Chinard (1968) showed the importance of diffusional transport of gases and of tritiated water in the renal circulation, where it is to be expected. Recently, with collaboration from this laboratory, Roth and Feigl (1981) demonstrated in the open-chested dog with controlled perfusion of the coronary arteries that hydrogen gas shunted from the arterial inflow to the coronary sinus outflow quickly enough that at low flows its emergence into the outflow preceded both red cell and plasma tracers injected simultaneously with it into the inflow. While one cannot extrapolate from these studies to estimate the degree of such shunting for oxygen and carbon dioxide, such studies do raise the question of whether or not the shunting might be important.
It is the purpose of this study to demonstrate both subtle and massive diffusional shunting in the heart, and to begin an approach to the interpretation in terms of the convection–diffusion interrelationships. The approach may prove useful in detecting and evaluating the role of diffusional shunting in the delivery of solutes to tissue.
Five sets of studies were done: (1) comparisons of residue function for curves for antipyrine and xenon in isolated blood-perfused dog hearts; (2) comparisons of indocyanine green and thermal responses; (3) thermodilution studies performed on a wide range of flows; (4) anatomic studies; and (5) a model analysis illustrating the form of impulse responses in a simple countercurrent system. Specific hypotheses are tested in the first three sets: (1) Do xenon curves exhibit forms that deviate from similarity and flow-limited transport? (2) Can thermal indicator reach the outflow before an intravascular indicator? (3) Is the change in form of thermal dilution curves with flow in accord with diffusional shunting rather than flow limitation or barrier limitation? The latter two sets are brought in as points of discussion, providing evidence for the veracity of diffusional shunting of high diffusible substances in the heart.
METHODS
Experimental procedures
Experiments were done using isolated Langendorffperfused hearts from dogs weighing 7 to 10 kg. The hearts were perfused with blood from the cannulated femoral artery of a support dog weighing 20 to 30kg, much as described by Yipintsoi and Bassingthwaighte (1970). The temperature of the perfusing blood was maintained between 37 and 38°C by using a heat exchanger on the inflow, and carefully insulating the whole heart and its attached apparatus with Mylar film and plastic foam. Background temperature variations were minimized by using a 45liter heat exchanger water bath; the variation was less than 0.03° during the time for a particular thermal dilution curve. The flows were controlled with an occluding roller pump. The total coronary sinus outflow was collected via a multiperforated silastic cannula placed through the pulmonary artery into the right ventricle, from which blood was returned to the femoral vein of the support dog.
Perfusion pressures, flow, blood temperature, and heart rate were monitored throughout the experiment.
Indicators
Indocyanine green (Hynson, Westcott, and Dunning, Baltimore, Md.) was used at a concentration of 1.25 mg/ml in cool saline between 15 and 25°. 133Xe or [4-125I]odoantipyrine was dissolved in sterile isotonic saline to give an activity of about 0.2 mCi/ml; injection volumes were 0.1 to 0.2 ml, the larger dose being used at higher flows, giving peak counts of 2500 to 10,000 counts per second. Counting intervals were I.0 set; the detection system was a 2-in. NaI crystal-photomultiplier system described by Knopp et al. (1972) (133Xe and IAp were supplied by the Radiochemical Centre, Amersham, England).
Concentration–time curves
Dilution curves for indocyanine green were sampled in the coronary sinus outflow via a catheter (volume, 0.12 ml; length, 15 cm) using a flow rate of 7.4 mUmin through an XC302 densitometer (Waters Corporation, Rochester, Minn.) while recording the output onto a magnetic tape recorder. The dye output signal is linear with respect to concentration, being more or less identical to the Waters XC250 (Bassingthwaighte et al., 1966) and the 90% response time for the instrument about 0.09 sec. Baseline drift was normally less than 1% over a 3-min period, and sensitivity changes less than 3% over 6-hr periods. The mean transit time of the dye sampling system was 0.97 set, which was taken into account in the analysis by shifting the dye curve forward in time by 0.97 set, but the dispersion of the sampling system was considered to be negligibly small.
The thermistor used to detect the temperature transients was affixed to the tip of a No. 3 French cardiac catheter with epoxy glue, and positioned beside the tip of the dye sampling catheter in the coronary sinus. The thermistor system normally showed a rapid time response and was slowed by the use of a first-order filter with a time constant of 0.04 set, giving a 90% response time of 0.10 set to match the densitometer. The gain of the system was set so that the dye densitometer and the thermistor system had matched dilution curves at the outflow of a tube system with a volume of 20 ml using the same injectate volumes as used in the experiment. (This means that if no indicator were lost, the areas of the recorded curves such as in Fig. 5 would be identical.) The first-order filter had too short a time constant to filter out noise with respiratory and cardiac frequency in the thermal signal during the experimental runs. There was substantial drift in the system over a period of a few minutes, up to 4% of peak signal during a curve, but baseline drift during the seconds between injection and outflow response was less than 1% of the peak of the dye curves.
Fig. 5.
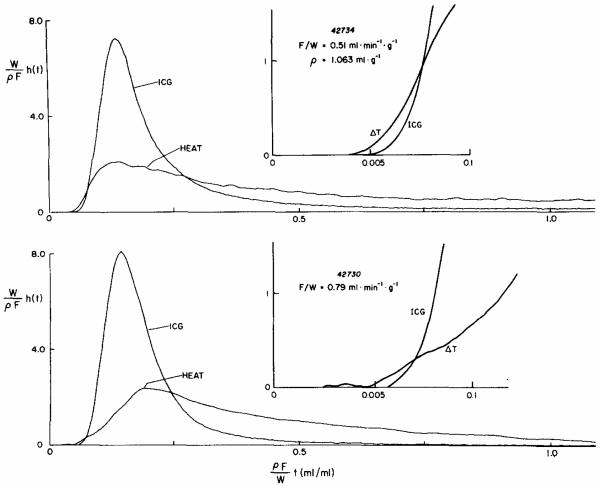
Transcoronary transport of heat and indocyanine green. The curves in both panels are the normalized impulse response, h(t), sampled from the coronary outflow from an isolated blood-perfused dog heart. The h(t)'s are normalized by the factor W/ρF, the weight divided by the density times flow, and the abscissa by the reciprocal factor; the abscissa is the volume having come out of the heart by time t as a fraction of the volume of the heart itself, so that 1.O means that the total volume of effluent from the time of injection = the heart volume. Upper panel: At a low flow, F/ W = 0.51 ml g−1 min−1, there is a significant precession of the thermal dilution curve so that in the early few seconds the heat dilution curve is above the indocyanine green dilution curve. Lower panel: At a higher flow, F/W = 0.79 ml g−1 min−1, the degree of precession is less (arrow) and the shape of the curve is different in that the peak is more delayed and rounded than at the lower flow.
Stochastic functions used in the analysis
In these analyses, the slug injection into the inflow is assumed to be satisfactorily represented as an impulse input. Actually, the injection itself causes some dispersion: the injection lasts about 0.25 set and also spreads the indicator within the aorta, but this spreading affects the estimates of neither flow nor mean transit times, t̄. Thus the venous outflow concentration–time curve closely represents impulse response, h(t), the fraction of the injected tracer appearing at the outflow per unit time. The complement of its integral is the residue function, the fraction of indicator remaining in the organ at a time t after the injection, and is given by
| (1) |
When the driving function or input concentration is an impulse input, the emergence rate, η(t), which is the instantaneous washout rate (Bassingthwaighte and Yipintsoi, 1970), is given by
| (2) |
In this study we used the leftmost definition. It provides a description of the instantaneous logarithmic slope of the residue function since −[dR(t)/dt]/R(t) is equal to −d logeR(t)/dt. (If R(t) were to become monoexponential, then η(t) would become constant and equal to the monoexponential rate constant.) After smoothing R(t) by a weighted moving average, thereby taking advantage of its monotonic nature, η(t) was given at 1-sec intervals by (Ri − Ri−1)/Ri, with the units (seconds)−1. For presentation these were normalized by multiplying by W/F, heart weight divided by flow, in milliliters per second, and plotted on an abscissa of time, seconds, multiplied by F/W. On such plots the shapes of the η(t)'s from the IAp curves in Fig. 1 are all superimposed, as will occur for the impulse responses for any indicator whose transport is governed by flow and not by diffusion, when the character of the flow does not change.
Anaromic studies
For portraying the anatomy of the coronary microcirculation, the left anterior descending coronary arteries of two open-chest dog hearts were perfused with a silicone rubber which polymerizes in situ (Microhl MV112, Canton Biomedical Products, Inc., Boulder, Colo.) after degassing under partial vacuum. The perfusion pressure was held constant and equal to the aortic pressure and continued until the flow stopped, at about 5 min. The hearts were removed; tissue water was replaced by soaking in increasing concentrations of ethanol, and the ethanol replaced with methyl salicylate, rendering the tissue sufficiently transparent for photography. Methods of preparation and of photography are given in detail by Bassingthwaighte et al. (1974).
RESULTS
Washout of xenon and iodountipyrine
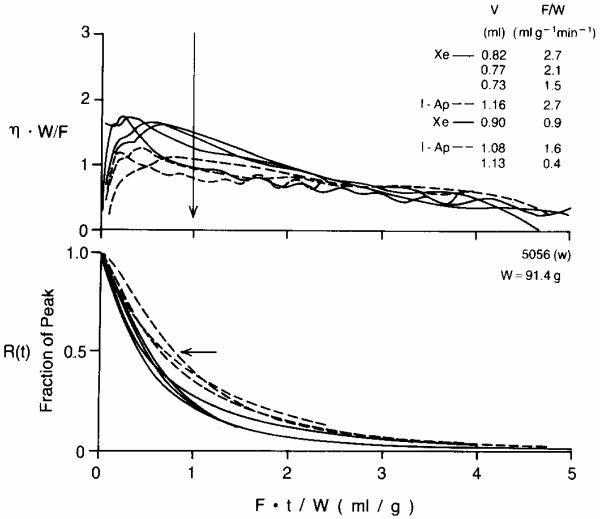
Washout curves of xenon and IAp were observed using external residue detection, as displayed in Fig. 2. The residue function curves (lower panel) for Xe are consistently lower at early times (Ft/W < 2) than the IAp curves, but at late times (off the plot) cross over to lie above. This is the same phenomenon shown in paired IAp and Xe curves shown by Bassingthwaighte et al. (their Fig. 3, 1968). This difference occurs in spite of the fact that the volume of distribution for Xe is about the same or possibly larger than that for IAp (Bassingthwaighte et al., 1968; Yipintsoi and Bassingthwaighte, 1970). In addition, it may be seen that the form of the curves changes as a function of how. This is most readily seen on the upper panel where the instantaneous slopes, the emergence functions, are plotted for both Xe and IAp. Compared to IAp, the Xe curves show higher emergence rates at early times and lower rates of emergence at late times. The IAp curves showed no systematic dependence on flow, in general, although in this particular set there are substantial differences in the shapes at the three flows. See also Fig. 1, where no systematic influences of flow are evident. The critical qualitative features are (1) all η's for Xe are above those for IAp at the time where Ft/W = 0.5, i.e., at half the mean transit time; (2) R(t)'s for Xe diminished to 0.5 before those for IAp; (3) the η's for Xe are ordered—those at the lowest flows have the highest values of ηW/F at Ft/W = 0.25 and the lowest values of ηW/F at Ft/W = 1.0. (Supporting statement 1 are observations in four animals in which 25 xenon curves and 18 IAp curves were recorded. There was only one exception, an IAp curve with a flow of 1.4 ml g−1 min−1 had a value of ηW/F similar to 2 Xe curves which had peaked earlier. Supporting statement 2 are the same 43 observations in four animals; there were no exceptions. Statement 3 requires qualification because of scatter in the data, but the ordering is unmistakable over large flow ranges.)
Fig. 2.
Xenon and antipyrine emergence and clearance in an isolated blood-perfused dog heart (weight = 91.4 g). The time scale is normalized by multiplying by F/W so the scale is the volume which has emerged divided by heart weight; e.g., at Ft/W = 2 the volume of flow which has emerged is the volume in ml of twice the heart weight in grams. Continuous lines are Xe; dashed lines are I-Ap. Upper panel: The emergence function η(t) is scaled by W/F as required for a self-consistent transformation. At the time of the vertical arrow, Ft/W = 1, the volumes V which had emerged and the flows F/W are listed in the same order as the curves cross the arrow. Note that the xenon escape is consistently higher for all times up to Ft/W = 1, and at late times the xenon washout is slower than antipyrine washout. Lower panel: Residue functions for xenon are consistently lower than those for antipyrine up until Ft/W is 3 or greater.
Fig. 3.
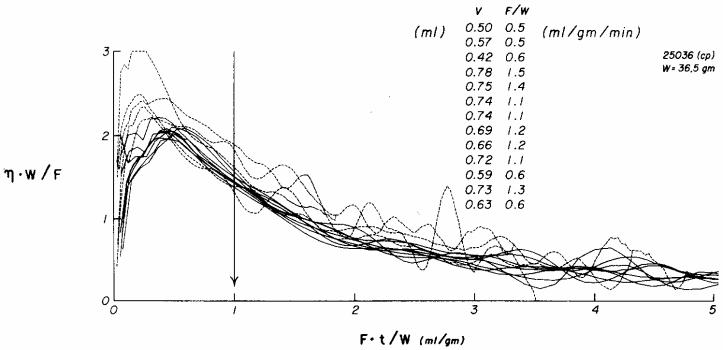
Myocardial emergence functions for xenon over a threefold range of flows in a blood-perfused dog heart. The time axis is normalized by multiplying by F/W, flow divided by heart weight, and the ordinate η(t) is appropriately scaled reciprocally. The flows for each of the curves are indicated by the listing from above downward at the arrow. Those recorded at the lowest flows (dotted lines = F/W < 1.0 ml g−1 min−1) gave the high emergence rates at early times, suggesting shunting, while those at higher flows (continuous lines = F/W > 1.0) had later but lower peaks and were grouped more closely together indicating a more precise dependence on flow alone, that is, less diffusional shunting.
The explanation would appear to be related to some diffusional phenomenon and, since it occurs preferentially at lower flows where there is relatively more time for diffusion to occur and preferentially for the indicator of the higher diffusibility. Slow flow and rapid diffusivity led to earlier emergence than can be expected due to intravascular convection. This implies the presence of diffusional shunting from inflow to outflow. Any barrier limitation in the capillary–tissue exchange region cannot give a comparable result over a range of flows. Nor can such results be explained by a red cell carriage phenomenon for the Xe, even though binding of Xe to hemoglobin has been described by Carlin and Chien (1977); this would give rise to an apparent hindrance to exchange which would be more evident at high flows than at low flows, just the opposite of what is seen in the figure.
That the early phases of xenon washout are more rapid at low flow is clearly illustrated by a plot of the emergence functions from one heart over a range of flows from 0.5 to 1.5 ml g−1 min−1 (Fig. 3). To normalize the curves to one another the independent variable t has been multiplied by F/W as in Fig. 2; this is almost equivalent to dividing by the mean transit time t̄: in theory t̄ = λW/(ρFB,) where λ = tissue/blood partition coefficient, W = heart weight (g), ρ = density (g/ml), and FB = blood flow, ml/min. The antipyrine curves from the same heart showed no dependence on flow.
The values of η(t) during the initial phase of washout provide a sensitive method for demonstrating the existence of diffusional shunting. An empirical but reproducible approach is to examine the ratio of η's at particular times; η's at times l/4 to l/2 of the mean transit time can be compared to η's at the mean transit time. The ratios of η at t̄/4 to η at t̄ are shown in Fig. 4 for studies on four hearts (25 xenon curves) in which IAp curves (N = 18) were also recorded. (Ranking the ratios and classifying as either high or low flow (relative to 1.4 ml g−1 min−1) the Wilcoxon test showed a significant difference with P < 0.01.) In two of the hearts (experiments 3036 and 5056) a wide range of flows was encompassed, and showed a hyperbolic relationship between the ratio and the flow. In two others (24036, 25036) the range of flows was. narrower and the ratios more scattered, but the trend was similar, a diminution at higher flows. For the same hearts the plots of these ratios for IAp curves did not decrease with increasing flow. For experiment 3036, the one with the widest range of flows, the values of the ratio ranged from 0.87 at FB = 0.8 ml g−1 min−1 to highest values of 1.20 and 1.12 at FB's of 2.7 and 3.1 ml g−1 min−1, an insignificant upward trend, in the opposite direction to that for xenon. Two hearts showed no trend; the only ratio for IAp greater than 1.2 was 1.5 for the curve obtained at the lowest flow in experiment 5056 (0.4 ml g−1 min−1) and shown in Fig. 2 (lowest curve). The stability of the ratios for IAp affirms that its washout is apparently completely flow-dependent, while the diminution in xenon's relatively high early emergence with increasing flow indicates that the process having a strong effect at low flows, presumably diffusion, is too slow to have much effect at high flows.
Fig. 4.
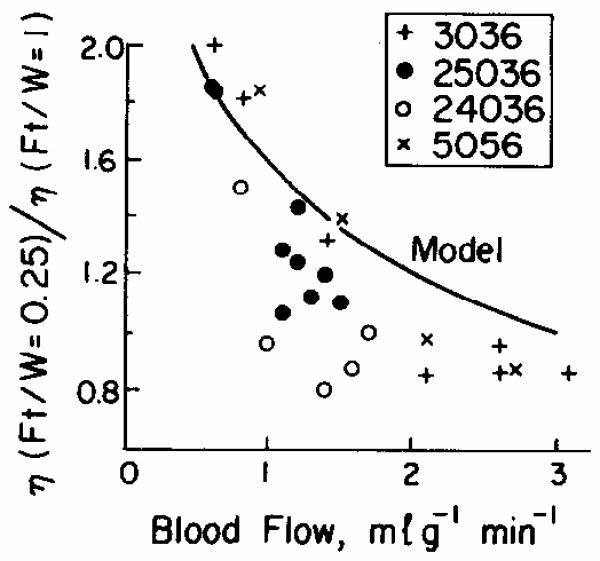
Ratios of initial escape rate for xenon to that at one mean transit time, η(Ft/W = 0.25)/ η(Ft/W = 1.0). Data are taken from 25 curves from four dog hearts. The comparable data from 20 IAp curves were ratios less than 1.2 (with one exception) and no statistical relationship to flow. The one exceptional IAp point was a ratio of 1.5 at FB = 0.4, from the bottom curve of Fig. 2, upper panel. The model curve is taken from solutions such as Fig. 8.
Diffusional shunting of thermal indicator
In Fig. 5 are shown pairs of impulse responses, normalized to unity area, for indocyanine green and thermal indicator simultaneously at two different flows. The abscissae are normalized by multiplying time by flow per unit volume of heart, as before. The dye curves are similar in shape on this axis, as one would expect if its outflow is governed solely by flow, and which has been demonstrated to be so for an intravascular indicator when the flow is changed (Knopp et al., 1976). This result means that there has been no major change in volume and also that there is no significant redistribution of flows between pathways having slow versus fast transit times, even though there was over a 50% increase in flow, from 0.51 to 0.79 ml g−1 min−1. Thus the dye curves serve as stable references for the thermal curves. Note that the heat and dye curves have the same areas, and therefore that differences in shapes indicate differences in mechanisms of transport between inflow and outflow.
At low flow the disparity between the temperature–time curve and the dye concentration–time curve is substantially greater than at high flow, although the difference is quite marked at all flows because of the very much larger volume of distribution for the thermal indicator (presumably approximately the tissue volume, as opposed to merely the vascular volume for the dye). At low flow, upper panel of Fig. 5, there is definite precession of the heat over the dye. If there were no diffusional shunting, the large volume of distribution for heat (i.e., the whole of the organ) would be expected to cause a delay of the heat relative to the dye, whose volume of distribution is limited to the vascular space, 10% of the organ. If the heat were strictly flow-limited, as is the dye, then the heat curve could be exactly superimposed on the dye curve by scaling both relative to their mean transit times, as was shown for a set of flow-limited indicators in the liver by Goresky (1963); but they cannot be so superimposed, for the precession would be made even more evident by such scaling.
At a slightly higher flow (Fig. 5, lower panel), a smaller fraction of the heat curve preceded the dye curve; this is to be expected for a diffusional shunt since an increase of flow allows less time for the diffusional exchange. More importantly, the heat dilution curve is differently shaped, having a later peak. The shape appears to be closer to that of the dye curve shape but spread over the longer mean transit time that the heat must have due to its volume of distribution. In both curves, there is a brief period during which the temperature change is finite but no dye has appeared. Since the dye curves were shifted to the left by 0.97 set to account for the sampling system but not corrected for temporal dispersion in the sampling system, the degree of precession is inevitably and systematically underestimated. This demonstration of precession therefore errs on the conservative side. By comparison of the shapes of these two curves with the hydrogen and erythrocyte and albumin curves recorded by Roth and Feigl (1981), it can be seen that preferential carriage of heat in the red cells, unlikely as that is, could not explain the heat precession at low flow. In any case, thermal exchange between red cells and plasma must be so extremely rapid that precession by red cell carriage could not occur.
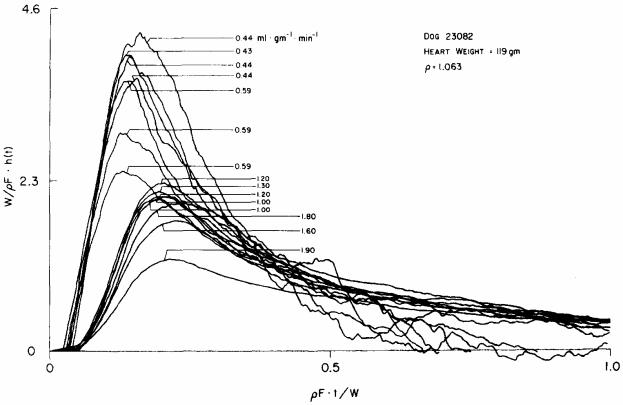
The remarkable degree of diffusional shunting for heat in the heart is shown in Fig. 6. Again the curves are normalized to time times flow per unit volume of organ to compare the curves obtained at different flows; using the mean transit times for the normalization would have introduced considerable error in the process because of the indeterminacy of the heights of the tails of the thermal dilution curves, and the consequent large error in the calculation of the first moment. Flow was measured at the time of each injection, the weight W was measured continuously and calibrated by the final weight of the heart at the end of the experiment, and ρ was taken as 1.063 for dog heart from the data of Yipintsoi et al. (1972). The figure shows that the curves are ordered more or less in accordance with the flow, those recorded at low flow having high early peaks and those at high flow having somewhat later but much lower peaks and smoother, more extended downslopes. The length of the abscissa for this plot is equivalent to only one mean transit time: the tails of these curves are very long. Some error in the tails is evident in some of the low flow curves where there were negative values, drooped below the baseline; this is physically impossible from the point of view of conservation of mass and must be due to instability of the temperature of the blood with respiration, or to some extent the thermal detector system over the long times required to record the curves at the lowest flows.
Fig. 6.
Transcoronary transport functions for thermal indicator at various flows. Thermal indicator was injected into the aortic root in an isolated blood-perfused dog heart and the resultant temperature change in the coronary sinus outflow was recorded from a thermistor. Normalization of the axes is the same as in Fig. 5. The flows are indicated for each of the curves. At low flows there is much higher earlier appearance of indicator in the outflow. The curves tended to become more similar at higher flows.
The 15 curves from one dog shown in Fig. 6 were recorded over a four-fold range of flows; 18 curves obtained from another dog gave a similar result. The indocyanine green dye–albumin curves from this study were, as in the study of Knopp et al. (1976) in intact dogs (their Fig. 3), superimposed on each other by this transformation, demonstrating similarity and flow limitation to transorgan transport. The conclusion to be drawn from the changes in shape of the thermodilution curves with flow is that it is not possible to explain their shapes in terms of flow-limited transport. Moreover, the direction of the change in shape, earlier and higher peaks at the lower flows, is exactly the opposite of what one can expect with a permeability limitation to transport; a barrier limitation, which must become more, and not less, evident at higher flows, will give higher peaks of the same shape as the dye–albumin curve, but cannot give rise to precession of even the smallest degree.
A feature of the curves which gives additional information is the time of appearance of the indicator in the outflow. Figure 6 shows that when the heat was first detectable at the outflow only about half as much volume had traversed the system at low flow as at high flow. As one would expect, the precession was graded, the lowest flow curves showing the greatest precession. Thus, the precession was greater for the curves with flows from 0.43 to 0.59 ml g−1 min−1 than for those with flows of 1.0 to 1.3 ml g−1 min−1. The ordering within narrow groups is not precise but the order of peak heights and upslope positions fall into ordered groups with flows around 0.4, 0.6, 1.0 to 1.3, 1.6 to 1.8, and 1.9 ml g−1 min−1. Those in the low-flow group had appearance times of about 0.05 t̄ less than those at higher flows. This implies that the shortest pathway for the thermal indicator to traverse the organ from inflow to outflow has less volume than the pathway taken by the indicator at higher flows. Similar effects are seen on the position of the peaks of the curves; the abscissa is volume emerged after injection; the linear regression observed is ρFtP,/W = 0.127 + 0.06 F/W (correlation coefficient = 0.87, N = 15); the statistical significance of the slope differing from zero (P < 0.01) indicates that raising flow reduces the degree of initial shunting.
While these data are consistent with thermal diffusion from an inflow region to the outflow region faster than the convected intravascular blood can carry it, the experiments would be more persuasive had an intravascular indicator, injected simultaneously, as in Fig. 5, been included to prove that its curves were similar at all flows in the same plot. This experiment, unlike that of Fig. 5, does not directly prove precession, but the systematic change of form and three-fold range of peak heights defies interpretation as convective or flow-limited transport. Most importantly, it will be shown in the discussion that the observed behavior is analogous to that shown by a countercurrent exchange model.
DISCUSSION
The evidence from our previous studies (Yipintsoi and Bassingthwaighte, 1970) and from the data presented above strongly support the concept of diffusional shunting in the myocardium—there seems to be no other alternative explanation for the phenomena! Therefore the question for discussion is the anatomic and physiologic basis for the exchange and the nature of the functional relationship between convection and diffusion, given the various possible geometric arrangements for flow and diffusion in the myocardium. Four classes of possibilities seem reasonable, but are not mutually exclusive:
(a) Diffusional exchange between inflow and outflow conduit vessels.
(b) Axial diffusion parallel to the flow path.
(c) Diffusional exchange between capillaries or groups of capillaries with offsetting of beginnings and ends.
(d) Diffusional exchange between neighboring capillaries with differing blood velocities.
We shall argue that the evidence favors diffusional exchange between inflow and outflow vessels, and probably also to some extent between offset capillaries or those with differing velocities, but that axial diffusion is unlikely to be significant.
Axial diffusion
Explorations with a Krogh cylinder model (Bassingthwaighte, 1974) which accounts for axial diffusion in capillary and in extravascular tissue suggested that axial diffusion could be consequential only if capillary lengths were exceedingly short or diffusion coefficients higher than realistic. Using the bulk diffusion coefficients for tritiated water in heart tissue (Suenson et al., 1974; Safford et al., 1978), that is, 7 × 10⁻⁶ cm2 sec−1, a 5% higher early escape rate for water by axial diffusion could be obtained only if the capillary lengths were less than about 100 μm. Anatomic data from photographs of the microvasculature using Microfil (Bassingthwaighte et al., 1974) suggest that venous drainage areas are on the average 500 μm apart and that capillary lengths are longer than this, implying that the contribution of axial diffusion must be insignificant. This argument would eliminate the applicability of the Perl–Chinard (1968) model to diffusional shunting in the heart, although it may be appropriate for other tissues.
Offset neighbors
If neighboring capillaries had starting points and ending points that were offset substantially from one another's then, as Johnson and Wilson (1966) and Levitt (1971) have argued, there would be a possibility for tracer entering the tissue at the upstream end of one capillary to exchange with the tissue in capillary blood nearer the downstream end of the neighboring capillary tissue region. This would lead to high early fractional escape rates which would be greater for tracers of greater diffusibility. Although the idea seems reasonable, since groups of capillaries cannot have precisely identical starting and ending points, the evidence from the antipyrine washout experiments indicates that this mechanism is of no consequence for iodoantipyrine. In the heart, diffusion distances between capillaries, 2R, are very short, 17–20 μm (Bassingthwaighte et al., 1974; Martini and Honig, 1969), so that an intercapillary diffusional relaxation time, R2/2D, would be about 0.2 sec (using a diffusion coefficient for antipyrine of one-third that of water), a time which is short compared to capillary transit times of a few to several seconds (Rose and Goresky, 1976). With such rapid intercapillary diffusion, any substantial offsetting of capillary inflow points would have allowed IAp to precess an intravascular solute by diffusing from the upstream end of one capillary to the outflow end of another; this would have resulted in more rapid early diminution in the iodoantipyrine residue function curves obtained by Bassingthwaighte and Yipintsoi (1970) at the low end of the rather wide range of flows that they explored. This could also amount to a few (1 to 4) seconds precession. However, there was no detectable influence of diffusion at low flows on the shape, and the conclusion is that the degree of offset of starting points from one another or of ending points from one another must be very small compared with the capillary length in total. This conclusion seems reasonable in the light of the anatomic evidence of Bassingthwaighte et al. (1974), who showed that the branching of an arteriole into a capillary bed occurred over distances of much less than 100 μm and the confluence of the capillaries into a venule occurred over the same sort of distance, both of which might be rather short compared with the 500- to 1000-μm-long capillary.
Variation in intracapillary velocities
Heterogeneity of velocities in some neighboring capillaries is expected because of the normal heterogeneity of regional myocardial flows. There is about a five-fold range of flows, observed by microsphere deposition in about 0.1-g sections of heart by Yipintsoi et al. (1973) and by King et al. (1984). If velocities in neighboring capillaries differed by a factor of 2, then diffusional shunting from one capillary region to another would occur not only for antipyrine but also for tracers of relatively low diffusivity such as sodium and glucose. Since there is no evidence for this, the conclusion is that heterogeneity is a macroscopic phenomenon occurring over regions substantially larger than the distances from one capillary to the next. The antipyrine data, supported by the xenon and water data which show so little diffusional shunting, suggest that within small tissue regions, i.e., large groups of capillaries, the velocities of flow may be fairly uniform.
The data on the thermal indicator (Figs. 5 and 6) and on hydrogen gas (Roth and Feigl, 1981) also argue against exchange between concurrent capillaries of differing velocities being important. Both indicators emerged before the intravascular reference albumin. Capillaries with the highest velocities would tend to lose heat or H2 to a neighboring capillary with a slower velocity, while retaining the albumin; the result would be a delay in the emergence of heat or H2 compared to albumin, just the opposite of what is observed.
Shunting between inflow and outflow vessels
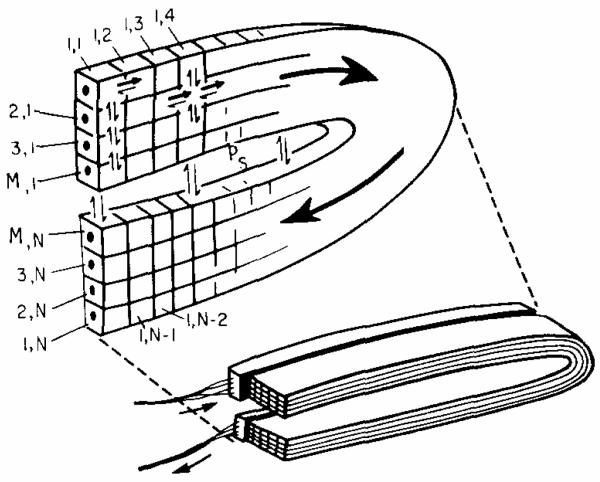
The most likely possibility is for diffusional exchange between arteriolar inflow and venular outflow vessels or between the beginnings of a group of capillaries and the outflowing ends. A simple configuration for such a situation is shown in Fig. 7, a folded slab model. Diffusional shunting from the inflow region to the outflow region of a microvascular unit occurs across the intervening tissue space (vertical arrows). The representation is in one plane, but the real situation is three-dimensional. In the ventricle, a capillary–tissue unit occupies about 1 mm3 (from the photographs of Barlow and Chance, 1976) and contains approximately 3000 capillaries of l-mm length (Bassingthwaighte et al., 1974). The folded slab model used for numerical solutions is considered as an approximation to such a region of microscopic dimensions. For computational purposes, the inflow and outflow regions were taken to be 10 to 40 capillaries deep with flows running in parallel concurrent fashion through all of the capillaries. The slab of length L is folded in the middle so that its outflow region is close to the inllow region. Each capillary and its surrounding tissue region are considered to be instantaneously in local radial (but not axial) equilibrium; the axial transport of fluid is via intracapillary flow. The axial diffusion coefficient, DX, was taken to be 2.5 × 10⁻⁶ cm2 sec−1, which is that from Safford et al. (1978) for water in myocardium. With instantaneous radial diffusion from each capillary to the boundaries of its region, the shape of each region is of no consequence, but in this case the distance between the sides of the squares was equal to the intercapillary distance. The x direction is considered to be the direction of flow from left to right in the inflow region and from right to left in the outflow half of the slab. In addition to the radial diffusion between capillaries, there is also the diffusion between the elements of the capillary regions closest to the plane of the fold, that is, between the two halves of the Mth sheet of the slab, shown by the exchanging arrows through the gap in the slice of the slab.
Fig. 7.
Model for diffusional shunting between inflow and outflow in a spatially distributed system. The space in the fold, with exchange rate constant Ps, in the region across which diffusional shunting occurs; this shunting produces concentration gradients throughout the tissue at all times, preventing equilibration. A numerical scheme for computing solutions is indicated above: positions along the capillary axis from x = 0 to x = L are represented by segments 1 to N. There are M capillaries in the folded slab. While the exchange is greatest between the upstream and downstream halves of the Mth capillary, there is also diffusion in all directions which means that the first segment of the first segment of the first capillary (segment 1.1) also changes with its last segment (1, N), but indirectly.
The basic design for the model follows that of Bassingthwaighte (1974), a single capillary model for blood–tissue exchange across a capillary wall. However, the proposed model has no permeability barrier. It is a multicapillary model rather than a single capillary model. The key feature is that there is diffusion between regions near the arteriolar inflow and venular outflow, which is similar in effect to diffusion across the fold of the slab between capillaries flowing in opposite directions. A general equation is
| (3) |
where C = concentration (mM); t = time (sec); vF (cm sec−1) = capillary velocity, which is the flow of solute-containing mother fluid divided by the cross-sectional area for solute-containing fluid in capillary plus that in the surrounding region (there being infinitely rapid diffusion across the capillary wall); and Dx, and Dy (cm2 sec−1) are diffusion coefficients in the x and y directions. For the finite difference approximation diagrammed in Fig. 7, the number of elements in the x direction was N = 30 to 60, and the number of sheets of capillaries in the y direction was M where M was 10 to 40. For a capillary–tissue unit of total length L, with a fold at L/2, there was a flux across the fold from the surface of the Mth sheet from x = 0 to L/2 to the surface of the same sheet extending from x = L upstream to L/2. The intervening sheet or region of countercurrent exchange is characterized by a rate constant for exchange, Ps, (sec−1), which is equivalent to a permeability–surface area product of the interface divided by the volume of the Mth capillary–tissue component:
| (4) |
When Ps = 0 there is no countercurrent exchange and the model behaves exactly as does that of Perl and Chinard (1968), and if, in addition, the axial diffusion coefficient Dx, is put to zero the model reduces to that of Goresky (1963), a purely flow-limited transport from entrance to exit.
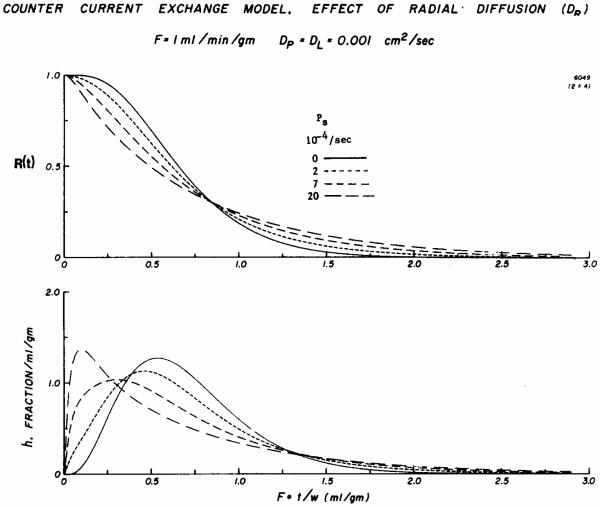
In Fig. 8 are shown residue functions and impulse reponses for this model with no countercurrent exchange flux, i.e., Ps = 0, and at three higher levels of permeability which might encompass a reasonable range for xenon and for thermal indicator. As permeability increases the residue functions show a more rapid washout of the first third or half of the contained tracer but have less steeply sloped and much longer tail portions. There is substantial precession (early arrival) of tracer at the outflow compared to that occurring when there is no countercurrent exchange. These events would explain the early emergence of xenon, heat, or water compared to iodoantipyrine. Like the shift in the thermal dilution curves with lowering flow (Fig. 6), the peak of h(t) appears progressively earlier in time with higher permeabilities. In addition, as was seen on the residue functions, the tails become progressively prolonged. Thus increasing the countercurrent exchange causes progressively more rapid early emergence, but also, as a corollary, increasing the countercurrent exchange retards the emergence of tracer which had penetrated deep into the tissue, in the midregion near x = L/2. In all cases the mean transit times were identical. Model solutions like these reproduce in a general way the observations of Aukland et al. (1964) on H2 washout from isolated gracilis muscles after equilibration: an intramuscular electrode showed substantial delay before washout became exponential, while an electrode in the venous outflow showed a rapid early diminution so that venous concentration remained about 40–50% lower than the tissue concentration.
Fig. 8.
Solutions to a countercurrent exchange model showing the responses to an impulse injection at the input to the system in four situations ranging from no countercurrent exchange, a continuous line, to substantial countercurrent exchange, the long dashes. Upper panel: The residue function R(t) shows a much more rapid early diminution in the presence of countercurrent exchange, with accordingly much slowed washout of the tracer retained at longer times. The nodal point at Ft/W = 0.8 ml g−1 is a normal feature of such models, but the position of the node depends on the exact configuration of the model. Lower panel: The impulse responses for the three cases with diffusional shunting show precession and earlier appearance in the outflow. Although the values for h(t) with diffusional shunting are higher than those without, after Ft/W = 1.3 the curves become difficult to distinguish from each other during the late phase of washout.
In this modeling, the effect of the reduction in flow is approximately the same as a proportional increase in diffusion across the fold. The general relationship of the curves in the bottom panel of Fig. 8, the peaks progressing leftward with increasing countercurrent exchange, can be considered to be more or less similar to the normalized thermodilution curves seen in Fig. 6. What is most evident in Fig. 8 is the precessing and the rapid early peaking of the curves, while the prolongation of the tails is not so clearly evident. One might anticipate this lack of definition in the tails of the curves of the impulse responses; the tails of the impulse responses in the lower panel of Fig. 8 seem to be very low and relatively close to each other compared with the distinct separation of the tails of the residue function curves. This slowing of the tails of the curves is compatible with the data shown in Figs. 2 and 3 where antipyrine and xenon curves obtained at similar flows were shown to differ. The xenon curves showed more rapid early diminution of the residue function, a crossover of the antipyrine curve, and a relatively delayed tail portion. The ratios of fractional escape rates at Ft/W = 0.25 and Ft/W = 1.0 were calculated from model impulse responses including those in Fig. 8, lower panel, multiplied by 2.5 for display purposes, and superimposed on the data of Fig. 4. Although the model gives an appropriately shaped curve, this should not be taken as proof that the model is correct, only that it is an adequate descriptor.
The combination of features shown by data and model does, however, speak strongly for a diffusional exchange which is at least partially countercurrent. Chang et al. (1982) have observed countercurrent, concurrent, and asymmetric patterns of flow in atria1 muscle. Ventricular muscle is likely to differ: the intercapillary distances are much greater (~19 μm) than the 5.2 μm reported for the atrium by Chang et al. (1982), and the flow in the left ventricular myocardium is about three times as high as atria1 flow per gram of tissue. Therefore we expect that the flow is mainly in effect concurrent, or rather that diffusional interactions are small, except in favored locations.
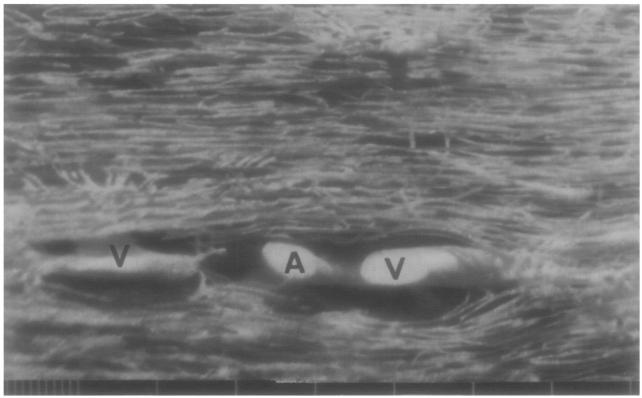
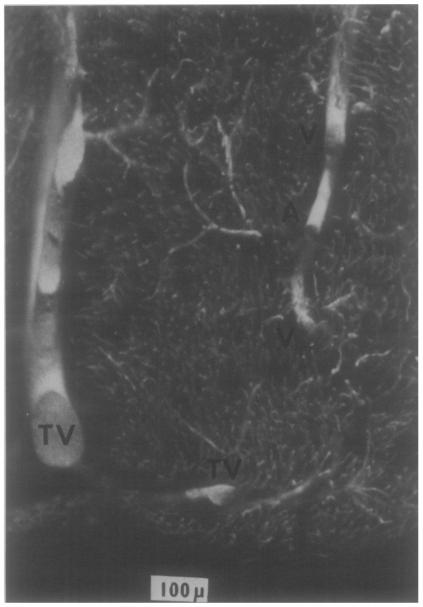
The likeliest candidates for “favored locations” for countercurrent exchange, if they are not between capillaries, are between small arterioles and their venae comitantes. Blood reaches the depths of the ventricular myocardium via arteries and arterioles penetrating from the epicardium toward the endocardium. There are usually venules accompanying arterioles all the way down to the small arterioles of 10- to 20-μm diameter (Bassingthwaighte et al. 1974). A photograph of this arrangement using their technique is shown in Fig. 9 of vessels in LV myocardium filled with Microfil; the central arteriole is 3.5 μm in diameter; the accompanying venules are each 50% or so larger in cross-sectional areas. The distances between the arterioles and venules are only about 40 to 80 –m and they run together for many millimeters. Figure 10 shows a similar arteriolar–venular grouping in the subendocardial region of the left ventricle. This source-sink arrangement is an inevitable countercurrent exchange region for substances (soluble gases like O2, CO2, H2, Xe, etc., and highly diffusible solutes like water) which penetrate vessel walls. This is scarcely surprising in view of Duling and Berne's (1970) observations on O2 loss from arterioles of 50- to 100-μm diameter in the rat cremaster, and the gain in O2 concentration in parallel venules.
Fig. 9.
Microvasculature of the left ventricular myocardium showing an arteriole, A (about 35 to 40 μm diameter), and two venae comitantes, V. The scale below gives 10- and 100-μm intervals. The venule on the right is about 40 × 80 μm. This arrangement is the usual one for arterioles from l-mm diameter down to those of 15-μm diameter.
Fig.10.
Arteriole and venules in the subendocardium of an adult dog. The microvasculature is filled with silicon elastomer and the tissue cleared by immersion in methylsalicylate. The ventricular cavity is below. In the right upper region is a 25μm arteriole, A, separated by 30 to 50 μm from venae comitantes, V, one about 4.5 μm and the other about 25 μm in diameter. Along the left side and below are a Thebesian vein and its branch, TV.
The diffusional shunting of heat through the coronary circulation can be looked on as an exaggeration of that of oxygen or diffusible tracers used for the determination of myocardial blood flow.
The anatomic potentiality for diffusional shunting is clear, but the conditions under which it is physiologically important are still the subject of surmise. Obviously lowering the flow increases the time for diffusional A–V exchange; subendocardial ischemia due to raised intraventricular pressure with reduced coronary blood flow is an obvious situation in which shunting might occur, with the inevitable result of reduced delivery of oxygen to the subendocardium.
Perhaps there is some subendocardial diffusional shunting of O2 and CO2 in the normal state. This can only be a suggestion, but it would fit the observations that subendocardial flows are normally higher than subepicardial flows, as measured by microspheres (King et al., 1984); the countercurrent exchange would tend to retain the CO2 generated in the subendocardium and to inhibit the inflow of the O2 to be consumed in the tissue, both effects being to produce subendocardial arteriolar dilatation. The shunting might well occur more in systole than diastole: Chilian and Marcus (1982) showed that an intramural (septal) artery had a very low average forward velocity during systole, in fact the velocity was backward during isovolumic systole. This is not surprising since the tissue pressure must be as high as intraventricular pressure. Moreover, venular pressures must also be highest during early systole. Although to our knowledge intramural venular pressures have not been measured, peak pressures in small epicardial veins during systole were almost 30 mm Hg (Armour and Klassen, 1981). Since the pressure peak in the veins is in late systole, there may be a time during late systole when low velocities in arterioles and venules promote A→V shunting of O2 and V→A shunting of CO2.
There are a good many situations in which diffusional shunting serves useful functions. Heat shunting has been observed as a useful mechanism for maintaining reduced testicular temperature (Dahl and Herrick, 1960) and for preventing loss of body heat from whale fins (Scholander and Schewill, 1955) and from the legs of wading birds (Scholander, 1957). These studies made it clear that heat shunting can occur not only in capillary beds but also between arteries and veins that intertwine or parallel each other with flows in opposite directions. It can be anticipated that if heat participates in diffusional shunting, other highly diffusible substances will as well. Accordingly, Setchell et al. (1966) observed slowed washout of kyrpton from the ram's testis which has a long vascular rete favoring diffusional countercurrent exchange.
Countercurrent exchange has long been recognized in the kidney. Aukland (1967) demonstrated that heat clearance from the medulla was much less than the perfusion rate, attributing this to an efficient countercurrent exchange. Perl and Chinard (1968) modeled the transport of gases and highly diffusible solutes (including tritiated water) through the renal circulation in a fashion in which exaggerated axial diffusion was proposed as an analog to countercurrent exchange. The solutions to our model are quite different from theirs, although the general trends are similar.
The existence of countercurrent diffusional shunting has led to confusion in methods of analysis of regional blood flows by indicator washout. Thorburn et al. (1963) attempted to use krypton washout to measure renal medullary blood flow. However, as appreciated soon thereafter by Aukland and Berliner (1964), the countercurrent exchange, as seen by the tails of R(t)'s in Fig. 8, slows the rate of escape of tracer injected into the tissue. The clearance is therefore less than the flow, even though the local blood–tissue exchange is completely flow-limited. The more efficient the exchanger the slower the washout:
The rate of hydrogen washout from the gracilis observed by Auklund et al. (their Fig. 17, 1964), discussed above, would give an exchanger efficiency of nearly 50% by this measure; this matches the data given in their figure, a flow of 9.7 ml (100 8))−1 min−1 but a clearance (from the logarithmic slope) of 5 ml (100 8)−1 min−1.
There is not yet a good measure of reporting the “amount” of countercurrent exchange. The problem is that when tracer is shunted or retained by the exchanger, an individual molecule is transported repeatedly. For example, on washout from deep in the tissue, diffusion from effluent venule to inflowing arteriole causes the molecule to reenter the tissue. Diffusional shunting thus has a high probability of retaining molecules which are deep in the tissue, while simultaneously promoting early emergence of tracer which diffuses from the arteriole to a venule very near the exit from the organ. While some suggestions for quantitating the exchange have been made (Bassingthwaighte, 1977), these cannot be precisely related to the anatomic-physiological system.
Supplementary Material
ACKNOWLEDGMENT
The authors appreciate the help of Geraldine Crooker in the preparation of the manuscript.
Footnotes
This research has been supported by NIH Grants HL19139 and HL19135, RR7, and RRl243.
REFERENCES
- Armour JA, Klassen GA. Epicardial coronary venous pressure. Canad. J. Physiol. Pharmacol. 1981;59:1250–1259. doi: 10.1139/y81-196. [DOI] [PubMed] [Google Scholar]
- Aukland K. Renal medullary heat clearance in the dog. Circ. Res. 1967;20:194–203. doi: 10.1161/01.res.20.2.194. [DOI] [PubMed] [Google Scholar]
- Aukland K, Berliner RW. Renal medullary countercurrent system studied with hydrogen gas. Circ. Res. 1964;15:430–442. doi: 10.1161/01.res.15.5.430. [DOI] [PubMed] [Google Scholar]
- Aukland K, Bower BF, Berliner RW. Measurement of local blood flow with hydrogen gas. Circ. Res. 1964;14:164–187. doi: 10.1161/01.res.14.2.164. [DOI] [PubMed] [Google Scholar]
- Barlow CH, Chance B. Ischemic areas in perfused rat hearts: measurement by NADH fluorescence photography. Science. 1976;3:909–910. doi: 10.1126/science.181843. [DOI] [PubMed] [Google Scholar]
- Bassingthwaighte JB. A concurrent flow model for extraction during transcapillary passage. Circ. Res. 1974;35:483–503. doi: 10.1161/01.res.35.3.483. [DOI] [PMC free article] [PubMed] [Google Scholar]
- Bassingthwaighte JB. Physiology and theory of tracer washout techniques for the estimation of myocardial blood flow: Flow estimation from tracer washout. Progr. Cardiovasc. Dis. 1977;20:165–189. doi: 10.1016/0033-0620(77)90019-6. [DOI] [PMC free article] [PubMed] [Google Scholar]
- Bassingthwaighte JB, Ackerman FH, Wood EH. Applications of the lagged normal density curve as a model for arterial dilution curves. Circ. Res. 1966;18:398–415. doi: 10.1161/01.res.18.4.398. [DOI] [PMC free article] [PubMed] [Google Scholar]
- Bassingthwaighte JB, Strandell T, Donald DE. Estimation of coronary blood flow by washout of diffusible indicators. Circ. Res. 1968;23:259–278. doi: 10.1161/01.res.23.2.259. [DOI] [PMC free article] [PubMed] [Google Scholar]
- Bassingthwaighte JB, yipintsoi T. The emergence function: Effects of flow and capillary–tissue exchange in the heart. In: Lassen NA, editor. Capillary Permeability. Munksgaard; Copenhagen: 1970. pp. 239–252. [Google Scholar]
- Bassingthwaighte JB, Yipintsoi T, Harvey RB. Microvasculature of the dog left ventricular myocardium. Microvasc. Res. 1974;7:229–249. doi: 10.1016/0026-2862(74)90008-9. [DOI] [PMC free article] [PubMed] [Google Scholar]
- Carlin R, Chien S. Partition of xenon and iodoantipyrine among erythrocytes, plasma, and myocardium. Circ. Res. 1977;40:497–504. doi: 10.1161/01.res.40.5.497. [DOI] [PubMed] [Google Scholar]
- Chang B-L, Yamakawa T, Nuccio J, Pace R, Bing RJ. Microcirculation of left atria1 muscle, cerebral cortex and mesentery of the cat: A comparative analysis. Circ. Res. 1982;50:240–249. doi: 10.1161/01.res.50.2.240. [DOI] [PubMed] [Google Scholar]
- Chilian WM, Marcus ML. Phasic coronary blood flow velocity in intramural and epicardial coronary arteries. Circ. Res. 1982;50:775–781. doi: 10.1161/01.res.50.6.775. [DOI] [PubMed] [Google Scholar]
- Dahl EV, Herrick JE. Counter-current exchange: Vascular mechanism for maintaining reduced testicular temperature. In: Glasser O, editor. Medical Physics. Vol. 3. Yearbook; Chicago: 1960. pp. 208–211. [Google Scholar]
- Duling BR, Berne RM. Longitudinal gradients in periarteriolar oxygen tension: a possible mechanism for the participation of oxygen in local regulation of blood flow. Circ. Res. 1970;27:669–678. doi: 10.1161/01.res.27.5.669. [DOI] [PubMed] [Google Scholar]
- Goresky CA. A linear method for determining liver sinusoidal and extravascular volumes. Amer. J. Physiol. 1963;204:626–640. doi: 10.1152/ajplegacy.1963.204.4.626. [DOI] [PubMed] [Google Scholar]
- Johnson JA, Wilson TA. A model for capillary exchange. Amer. J. Physiol. 1966;210:1299–1303. doi: 10.1152/ajplegacy.1966.210.6.1299. [DOI] [PubMed] [Google Scholar]
- King RB, Bassingthwaighte JB, Hales JRS, Rowell LB. Stability of heterogeneity of myocardial blood flow in normal awake baboons. Circ. Res. 1984 doi: 10.1161/01.res.57.2.285. revisions requested. [DOI] [PMC free article] [PubMed] [Google Scholar]
- Knopp TJ, Anderson DU, Bassingthwaighte JB. A computer interface for radioisotope data processing. Comput. Bomed. Res. 1972;5:479–483. doi: 10.1016/0010-4809(72)90054-7. [DOI] [PMC free article] [PubMed] [Google Scholar]
- Knopp TJ, Dobbs WA, Greenleaf JF, Bassingthwaighte JB. Transcoronary intravascular transport functions obtained via a stable deconvolution technique. Ann. Biomed. Eng. 1976;4:44–59. doi: 10.1007/BF02363557. [DOI] [PMC free article] [PubMed] [Google Scholar]
- Levitt D. Theoretical model of capillary exchange incorporating interactions between capillaries. Amer. J. Physiol. 1971;220:250–255. doi: 10.1152/ajplegacy.1971.220.1.250. [DOI] [PubMed] [Google Scholar]
- Martini J, Honig CR. Direct measurement of intercapillary distance in beating rat heart in situ under various conditions of O2, supply. Microvasc. Res. 1969;1:244–256. doi: 10.1016/0026-2862(69)90026-0. [DOI] [PubMed] [Google Scholar]
- Perl W, Chinard FP. A convection-diffusion model of indicator transport through an organ. Circ. Res. 1968;22:273–298. doi: 10.1161/01.res.22.2.273. [DOI] [PubMed] [Google Scholar]
- Rose CP, Goresky CA. Vasomotor control of capillary transit time heterogeneity in the canine coronary circulation. Circ. Res. 1976;39:541–554. doi: 10.1161/01.res.39.4.541. [DOI] [PubMed] [Google Scholar]
- Roth AC, Feigl EO. Diffusional shunting in the canine myocardium. Circ. Res. 1981;48:470–480. doi: 10.1161/01.res.48.4.470. [DOI] [PubMed] [Google Scholar]
- Safford RE, Bassingthwaighte EA, Bassingthwaighte JB. Diffusion of water in cat ventricular myocardium. J. Gen. Physiol. 1978;72:513–538. doi: 10.1085/jgp.72.4.513. [DOI] [PMC free article] [PubMed] [Google Scholar]
- Scholander PF. The wonderful net. Sci. Amer. 1957;196:96. [Google Scholar]
- Scholander PF, Schewill WE. Counter-current vascular heat exchange in fins of whales. J. Appl. Physiol. 1955;8:279. doi: 10.1152/jappl.1955.8.3.279. [DOI] [PubMed] [Google Scholar]
- Setchell BP, Waites GMH, Thorburn GD. Blood flow in the testis of the conscious ram measured with krypton—Effects of heat, catecholamines and acetylcholine. Circ. Res. 1966;18:755–763. doi: 10.1161/01.res.18.6.755. [DOI] [PubMed] [Google Scholar]
- Suenson M, Richmond DR, Bassingthwaighte JB. Diffusion of sucrose, sodium and water in ventricular myocardium. Amer. J. Physiol. 1974;227:1116–1123. doi: 10.1152/ajplegacy.1974.227.5.1116. [DOI] [PMC free article] [PubMed] [Google Scholar]
- Thorburn GD, Kopald HH, Herd JA, Hollenberg M, O'Morchoe CCC, Barger AC. Intrarenal distribution of nutrient blood flow determined with kyrpton85 in the unanesthetized dog. Circ. Res. 1963;13:290–307. doi: 10.1161/01.res.13.4.290. [DOI] [PubMed] [Google Scholar]
- Yipintsoi T, Bassingthwaighte JB. Circulatory transport of iodoantipyrine and water in the isolated dog heart. Circ. Res. 1970;27:461–477. doi: 10.1161/01.res.27.3.461. [DOI] [PMC free article] [PubMed] [Google Scholar]
- Yipintsoi T, Dobbs WA, Jr., Scanlon PD, Knopp TJ, Bassingthwaighte JB. Regional distribution of diffusible tracers and carbonized microspheres in the left ventricle of isolated dog hearts. Circ. Res. 1973;33:573–587. doi: 10.1161/01.res.33.5.573. [DOI] [PMC free article] [PubMed] [Google Scholar]
- Yipintsoi T, Knopp TJ, Bassingthwaighte JB. Countercurrent exchange of labeled water in canine myocardium. Fed. Proc. 1969;28:645. [Google Scholar]
- Yipintsoi T, Scanlon PD, Bassingthwaighte JB. Density and water content of dog ventricular myocardium. Proc. Sot. Exp. Biol. Med. 1972;141:1032–1035. doi: 10.3181/00379727-141-36927. [DOI] [PMC free article] [PubMed] [Google Scholar]
Associated Data
This section collects any data citations, data availability statements, or supplementary materials included in this article.


