

Abstract
The initiation of atherosclerosis involves retention of colloidal atherogenic lipoproteins, primarily low density lipoprotein (LDL), in the arterial intima. This retention occurs when LDL binds to smooth muscle cell extracellular matrix (SMC ECM), and is enhanced by lipoprotein lipase (LpL) and sphingomyelinase (Smase). Here we use a fluorescence assay and dynamic light scattering to study the individual and combined effects of these two enzymes on LDL aggregation. Our results show: 1. LpL is self-sufficient to induce LDL aggregation with aggregate sizes up to ∼400 nm; 2. Smase induces LDL aggregation due to generation of ceramide and subsequent hydrophobic interactions; 3. Smase hydrolysis of LpL-induced LDL aggregates does not cause further aggregation and results in a ∼3-fold diminished production of ceramide, while LpL treatment of Smase-induced aggregates does enhance aggregation; 4. The simultaneous addition of LpL and Smase causes increased variability in aggregation with final sizes ranging from 50-110 nm. Our data suggest a new proatherogenic function for LpL, namely, bridging between LDL particles causing their aggregation and consequently enhanced retention by SMC ECM. The mechanism of LpL-and-Smase-mediated LDL aggregation and binding to SMC ECM provides specific points of intervention to design novel effective antiatherogenic therapeutics.
Keywords: Low density lipoprotein, LpL, Smase, aggregate, atherosclerosis
Introduction
The initiation of atherosclerosis is caused by subendothelial retention of atherogenic lipoproteins; primarily low density lipoprotein (LDL) [1-2]. LDL is a spherical particle that is typically 20-25 nm in diameter (Scheme 1). It is composed of a phospholipid monolayer shell surrounding a hydrophobic lipid core. Additionally, a single molecule of the apoB-100 protein is associated with the monolayer; the LDL protein:lipid mass ratio is 1:4 [3]. The lipid portion of LDL consists of 25% phospholipids, 14% unesterified cholesterol, 46% esterified cholesterol, and ∼15% glycerides; cholesterol esters and glycerides occupy the LDL core. Additionally, sphingomyelin accounts for 26% of all phospholipids [4-7].
Scheme 1. Drawing of structure and composition of LDL.
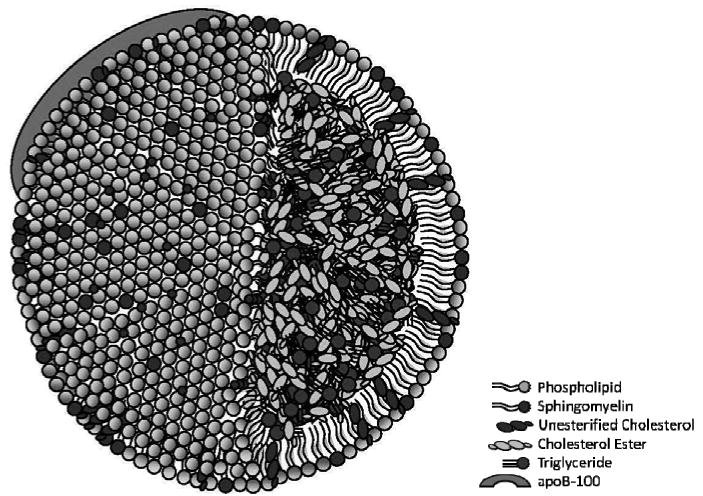
Under healthy conditions the cholesterol in LDL, which comprises 60% of its total lipids, is delivered to cells as part of their normal physiology. Under pathological conditions, however, LDL is retained by and accumulates in the portion of the artery wall between the endothelial cell layer and smooth muscle cells. This retention can occur due to the electrostatic interaction of positively charged amino acids in apolipoprotein B with negatively charged glycosaminoglycans in the SMC ECM [8-12]. Atherogenic foam cell formation, fatty streaks, and lesion development are all consequences of this retention [1].
Lipoprotein lipase (LpL), found in the arterial intima, enhances LDL retention [13-14]. LpL has a molecular weight of 50.3 kDa and is known to hydrolyze triglycerides contained in chylomicrons and very low density lipoproteins, contributing to the sequence of events leading to the production of LDL [15-17]. This enzymatic function is activated by factors like the presence of apolipoprotein C-II which is found on very low density lipoprotein particles [18]. Here, we are interested in another role of LpL, its non-enzymatic binding/bridging function, whereby it binds LDL to SMC ECM proteoglycans, enhancing LDL retention [13-15]. The enzyme contains both hydrophobic regions, thought to be responsible for binding lipids, and also distinct regions responsible for binding proteoglycans [16, 19-20].
Sphingomyelinase (Smase) is another atherogenic enzyme that is secreted locally by endothelial cells and macrophages in its Zn2+-dependent form [21-23]. Smase has a molecular weight of 23.3 kDa. Its pI is 5.6, thus has a negative charge under our experimental conditions (pH 7.4) [24]. It is known to hydrolyze membrane-bound sphingomyelin, cleaving its phosphorylcholine headgroup and exposing ceramide in the phospholipid monolayer on the LDL surface. (Eq. 1) The critical change in lipid chemical structure accompanying this hydrolysis reaction is the loss of the polar phosphorylcholine headgroup of sphingomyelin. With the headgroup missing, the hydrophobic effect causes ceramide molecules to shield each other from the polar aqueous environment, causing LDL aggregation, and subsequently leading to increased foam cell formation and atherogenesis [25-26].
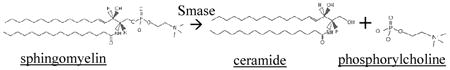 |
Eq. 1 |
LpL and Smase together cause a dramatic enhancement in the binding of LDL to SMC ECM: 10-fold compared to binding with either enzyme alone and 50-100-fold compared to binding with neither enzyme present [14]. The mechanism of this synergy is not clear, but the magnitude of its effect on atherogenesis indicates that studying it may have great translational value.
The in vivo retention and accumulation of LDL in the arterial intima involves a complex combination of factors. In order to study the mechanism causing this observed accumulation, model studies in vitro, which allow the separation of specific steps of the LDL-to-SMC ECM interaction, are important and also practically useful in the design of the novel antiatherogenic therapies. Our goal is to study the mechanism(s) of LDL aggregation caused by LpL and Smase in vitro and their effects on the retention of these aggregates by SMC ECM.
Materials and Methods
Materials
LDL from human plasma was purchased from EMD Biosciences/Calbiochem (San Diego, CA). Dulbecco's Modification of Eagle's Medium (DMEM), Penicillin-Streptomycin Solution, L-glutamine solution, and Dulbecco's Phosphate-Buffered Saline (DPBS) were purchased from Mediatech/Cellgro (Manassas, VA). Heat-inactivated Fetal Bovine Serum (FBS) was obtained from Gemini (West Sacramento, CA). Bovine aortic smooth muscle cells were kindly provided by Dr. Peter Lelkes (Drexel University). Lyophilized, neutral, Mg2+-dependant sphingomyelinase (Smase), Lipoprotein lipase (LpL) from bovine milk, NaCl, HEPES (4-(2-Hydroxyethyl)piperazine-1-ethanesulfonic acid), NaOH, Bovine serum albumin (BSA), Sodium dodecyl sulfate (SDS), phosphorylcholine chloride (calcium salt tetrahydrate), KH2PO4, KI, NaN3, Triton X-100, benzalkonium chloride, ammonium molybdate, BHT, and EDTA were purchased from Sigma Aldrich (St. Louis, MO). Ammonium hydroxide was purchased from Fisher Scientific (Waltham, MA).
Preparation of LDL and Smase Samples
LDL was supplied by the manufacturer in 150 mM NaCl, 0.01% EDTA, pH 7.4 (density range 1.02-1.063 g/mL, ≥95% pure). The composition was specified as 78-81% lipid and 19-22% protein. LDL aggregates were formed by treatment of 100 or 234 μg LDL/mL (total lipids plus protein mass, for experiments without and with matrix present, respectively) with 0, 1.0, 3.7, 10.0, 30.0, or 78.7 μg LpL/mL and/or 10, 108, or 150 mU Smase/mL. LDL was prepared in HEPES buffer and filtered before use with a 0.45 μm Millex™ sterile filter (Millipore, Billerica, MA) to clarify the suspension and remove any larger impurities remaining in the density fraction, which would interfere with DLS analysis. All experiments in this study were performed using the same batch of LDL in order to eliminate any experimental error from variability in LDL preparations. Using DLS, we measured the size of all material received and it was uniformly 22-28 nm. Additionally, we observed that LDL remains stable in the manufacturer's stock solution, as no aggregation was detected before any of our experiments.
Ceramide Assay
Generation of ceramide was measured using Nunc 96-well microplates in the Tecan Infinite 200™ (Männedorf, Switzerland) fluorescence microplate reader. The Amplex Red-phosphorylcholine-coupled Smase fluorescence assay kit, purchased from Invitrogen (Carlsbad, CA), was used according to vendor instructions, and using HEPES buffer as described before [27-28]. It should be noted that the enzymatic activity observed in this work is likely less pronounced than it would be in an experimental system containing divalent cations, or in the subendothelial space or blood. Here, the absence of additional Mg2+ and Ca2+ enabled us to observe kinetic changes on measurable time scales in order to gain mechanistic insights on kinetic changes in this experimental system.
Particle Size Measurement
Aggregation kinetics experiments were performed using dynamic light scattering 90 Plus Particle Sizer (Brookhaven Instruments, Holtsville, NY) with a BI-9000AT digital autocorrelator. The equipment contains a 15 mW solid-state laser and operates at 678 nm. The method of cumulants was used to calculate apparent diffusivity and polydispersity using the first and second cumulants, respectively, of a cumulant fit. The Stokes-Einstein equation was used to calculate the hydrodynamic radius of particles or aggregates[29], presented in the data as effective diameter.
Preparation of Cell-Free Extracellular Matrix
Bovine aortic smooth muscle cells were cultured to ∼70% confluence at 37°C and 5% CO2 in T75 Corning tissue culture flasks in DMEM, containing 8.85% (v/v) FBS, 88.5 I.U. penicillin, 88.5 I.U. streptomycin, and 4.5 g/L glutamine. Cells were transferred to BD Biosciences 6-well tissue culture plates and grown again to ∼60% confluence in their 11th passage and then switched to serum-free media for 6 days before use in experiments. Extracellular matrix was prepared by removing only the cells from the culture wells using a 30 minute room temperature incubation with 0.1 M NH4OH. The removal of cells was confirmed using by light microscopy (Zeiss Axiovert 40 CFL). To confirm that any effects observed was the result of matrix and not exposed plastic in the culture wells, control samples with no cells present were also incubated with NH4OH.
Statistical Methods
All data presented in each part of this work are the mean ± SD from three independent experiments, n=3. Statistical analysis of the data was performed using the t-test. In cases where p > 0.05 we reported no statistically significant difference between the two data sets in question.
Results
LpL-Mediated Aggregation of LDL
In this work we focus on understanding the individual and combined effects of LpL and Smase on LDL modification and aggregation. Since LpL is responsible for retention of LDL by SMC ECM [8-10], and since Smase is known to cause atherogenic aggregation of retained LDL [25-26], we were first interested in investigating any direct effect of LpL on LDL aggregation.
LDL (100 μg/mL) was incubated with various concentrations of LpL. Significant aggregation was observed as kinetics data showed an increase and then plateau of aggregate sizes over time (Figure 1a). This aggregation data was fitted with curves of the form y=y0+a(1-exp(-bx)) to determine the plateau values. A saturation effect was observed whereby higher LpL concentrations caused an increase in aggregate size that began to plateau ∼400 nm (Figure 1b). This experiment shows that LpL alone is sufficient to induce LDL aggregation. No effect was observed at the lowest LpL concentration (1.0 μg/mL), indicating that the ratio of LpL molecules to LDL particles was sufficiently small such that any aggregation was insignificant. This low LpL concentration results in ∼1 LpL molecule for every 5 LDL particles. At higher LpL concentrations, including 3.7, 10.0, 30.0, and 78.7 μg LpL/mL, there are ∼1, 2, 6, and 16 LpL molecules for every 1 LDL particle, respectively (MWLDL=2300 kDa and MWLpL=110 kDa [3, 14]). The finding that higher LpL-to-LDL ratios are necessary for aggregation is consistent with a nonenzymatic bridging model of LpL binding to LDL [13-14].
Figure 1.

LpL-mediated aggregation of LDL: (a) 100 μg LDL/mL was incubated with 0 (●), 1.0(▼), 3.7(■), 10.0(◆), 30.0(▲), and 78.7 (hexagon) μg LpL/mL. Aggregation was observed at LpL concentrations greater than 1.0 μg/mL. (b) Final, plateau aggregate sizes from Figure 1A, plotted against LpL concentration, began to reach saturation at higher values.
Smase-Mediated Generation of Ceramide from LpL-Pretreated LDL
We have shown that LpL and Smase each cause LDL aggregation [27-28]; however they do so through different mechanisms that can both occur in lesional tissue [25-26]. Since they each modify LDL in different ways, it is likely that one mechanism could affect the other. Here, we aim to better characterize Smase-mediated generation of ceramide by studying it in a more physiologically relevant environment, in the presence of LpL.
LDL (100 μg/mL) was pretreated with various concentrations of LpL to form aggregates, and after 24 hours of incubation at room temperature Smase was added to each sample (final concentration, 10 mU Smase/mL). Ceramide generation kinetics were measured for ∼6 hours and were fit with sigmoidal curves (Figure 2a) due to the typical sigmoidal shape of Smase-mediated ceramide generation data from LDL [27]. There was no statistically significant difference between ceramide concentrations from the last two time points in each curve in Figure 2a, reinforcing that the curves reached saturation. The final, plateau ceramide concentration for each kinetic curve (in Figure 2a) was plotted vs LpL-pretreatment concentration (Figure 2b) and together show that the pretreatment affects ceramide generation from LDL-sphingomyelin. At smaller values, increased LpL concentration reduces ceramide generation (in Figure 2 b&d, statistically significant differences in ceramide concentration were observed between the first and second data points and also between the second and fourth data points), and at larger values the reduction in ceramide generation levels off, whereby increased LpL causes no further decrease (there were no significant differences between the fourth, fifth, and sixth data points, showing saturation in those curves). Finally, when fresh LDL is added 24 h after Smase addition, no additional ceramide is generated (Figure 2c), and the same amount of ceramide is generated for all aggregates greater than ∼100 nm (Figure 2d). The results presented here show that the presence of LpL caused a change in the kinetics of ceramide generation; next we wanted to understand the subsequent effects of this process on LDL aggregation.
Figure 2.

Smase-Mediated Generation of Ceramide from LpL-Pretreated LDL: Panel a, Samples pre-treated with varying concentrations of LpL: 0 (●), 1.0(▼), 3.7(■), 10.0(◆), 30.0(▲), and 78.7 (hexagon) μg LpL/mL, and then incubated with a uniform concentration of Smase, show suppressed ceramide generation at higher LpL concentrations, indicating that LpL-mediated aggregation of LDL may block Smase access to LDL-sphingomyelin substrate. Panel b, Plateau values from curves in Panel a vs. LpL concentration show the suppression-of-ceramide-generation effect. Panel c, The subsequent addition of fresh LDL causes no additional ceramide generation Panel d, For any aggregate larger than ∼100 nm (pre-formed with LpL), the same amount of ceramide is generated.
Effect of Order of Enzyme Addition on Aggregation Kinetics
Samples consisting of LDL treated with LpL and Smase were prepared with identical compositions but the enzymes were added in different orders. When LDL was treated with 108 milliunits Smase/mL ∼110 nm aggregates were formed after 6 h (Figure 3a, first section of top curve). This sample was then treated with 4.0 μg LpL/mL and aggregation continued to ∼140 nm by 10 h (Figure 3a, second section of top curve). Conversely, when LDL was first treated with 4.0 μg LpL/mL aggregates with a ∼70 nm diameter were observed (Figure 3a, first section of bottom curve). This sample was then treated with 108 milliunits Smase/mL and no additional aggregation was observed (Figure 3a, second section of bottom curve). When identical concentrations of the two enzymes were added simultaneously, variability in aggregate sizes was large (Figure 3b) and aggregate sizes ranged from ∼50-110 nm over the course of 10 h. When the enzymes were co-incubated 1 h before addition to the LDL solution aggregate sizes ranged from ∼50-85 nm (Figure 3b). One additional set of three independent experiments was performed where both enzymes were co-incubated 1 min before addition to the LDL solution to confirm the aggregation behavior of this two-enzyme sample (Figure 3c). The resulting aggregates, with final sizes ranging from 70-110 nm, also showed increased variability especially when compared to LDL treated only with Smase (shown on the same plot). The increased variability in the data where LpL and Smase are added together is similar to the variability in the second sections of both curves in Figure 3a, and suggests that together, LpL and Smase affect LDL in different and possibly competitive ways. Three mechanistic schemes, which attempt to explain changes in aggregate size due to treatment with Smase and/or LpL, were developed to describe LDL aggregation under each set of conditions investigated here (Figure 3d).
Figure 3.

LpL-and-Smase-mediated aggregation of LDL: Order of enzyme addition affects aggregation: Panel a bottom curve, (experimental data points shown along with mathematical fits) LDL aggregate size after 4.0 μg LpL/mL pre-treatment (▼) followed by incubation with 108 mU Smase/mL (■), Panel a top curve, LDL aggregate size after 108 mU Smase/mL pre-treatment (◆) followed by incubation with 4.0 μg LpL/mL (▲). In each case, control samples containing only LDL showed no aggregation (●). Panel b, LDL aggregate sizes for samples where 4.0 μg LpL/mL and 108 mU Smase/mL were simultaneously added (○) or co-preincubated (▼) and added. Panel c, Aggregate sizes of LDL solution where 4.0 μg LpL/mL and 108 mU Smase/mL were co-preincubated for 1 min before addition (▼) are shown with aggregates formed from LDL treated only with 108 mU Smase/mL (■). Panel d, Schematic showing LDL aggregation via LpL pretreatment followed by incubation with Smase (Sequence I), Smase pretreatment followed by incubation with LpL (Sequence II), and simultaneous treatment with LpL and Smase followed by a reorganization step (Sequence III).
We show here that LpL pre-treatment reduces Smase-induced aggregation. It is possible that the ceramide generated from this Smase treatment may bind, via the hydrophobic effect, with local ceramide that is already part of the LpL-bound aggregate (Figure 3, Sequence I). Larger aggregates are formed when aggregation follows the reverse pathway (Sequence II), and when both enzymes are added simultaneously (Sequence III) aggregate sizes show increased variability.
Effect of Matrix on Enzyme Kinetics and Aggregation
All experiments reported above involve interactions of LpL and Smase with LDL in solution, however, physiologically relevant atherogenesis involves subendothelial retention of LDL by the SMC ECM followed by modification and aggregation of the lipoproteins on this two dimensional surface. The next logical step for this work was to perform the experiments presented above with LDL that is retained on a two dimensional surface containing SMC ECM. Modification and aggregation of LDL on this surface could likely behave differently than LDL in solution. As a first step toward this work we investigated the possibility of a sorting effect of SMC ECM on LDL in solution. We compared Smase hydrolysis and final aggregate size of LDL in solution above a two dimensional surface with and without SMC ECM.
Ceramide generation was measured in the presence and in the absence of SMC ECM for samples containing 234 μg LDL/mL incubated with 150 mU Smase/mL with and without 3.74 μg LpL/mL. The production of ceramide was not affected by the presence of matrix, as the saturation values are similar for samples incubated with and without matrix; this is true both for cases where only Smase is added and also where Smase + LpL is added (Figure 4a). A significant difference in ceramide generation was observed between samples treated with Smase alone versus those treated with LpL and Smase simultaneously. When final aggregate sizes were measured for samples containing only LDL, LDL + Smase, or LDL + Smase + LpL, there were no statistically significant differences between the final aggregate sizes for each sample type incubated with and without matrix present (Figure 4b). We show that the presence of SMC ECM did not affect ceramide generation or aggregation of LDL in solution, demonstrating that no sorting effect or selective binding of aggregates to matrix was observed.
Figure 4.

Effect of extracellular matrix on Smase kinetics and aggregation: SMC ECM was incubated with different combinations of 234 μg LDL/mL, 150 mU Smase/mL, and 3.74 μg LpL/mL. Panel a, Ceramide generation kinetics of samples containing Smase (■), Smase + LpL (◆), matrix + Smase (●), matrix + Smase + LpL (▼). Panel b, Aggregate sizes of LDL incubated with combinations of matrix (M), Smase (S), and LpL (L) after 29 hours of incubation. Control samples (Ctrl) contained LDL + matrix or LDL alone.
Discussion
The effects of LpL are relevant to atherogenesis as LpL is known to bind LDL to matrix proteoglycans, enhancing subendothelial LDL retention [13-14]. Here we show that LpL can also cause the aggregation of multiple LDL particles at LpL-to-LDL ratios of ∼1-16. Since aggregation did not occur when there were fewer LpL molecules in solution than LDL particles, and aggregation proceeded and increased at ratios of LpL-to-LDL greater than 1, it is likely that multiple LpL molecules are required for each aggregation event.
We investigated the possibility that LpL-mediated aggregation of LDL could block the subsequent access of Smase to LDL-sphingomyelin substrate by measuring ceramide generation in LpL-pretreated samples incubated with Smase. We observed that more LpL-mediated aggregation resulted in decreased subsequent ceramide generation. We propose that this decrease (Figure 2a&b) could be due to substrate unavailability for Smase hydrolysis.
In the Smase-and-LpL-mediated aggregation of LDL, we have observed that the order in which the enzymes are added affects aggregation. The differences observed here coincide with the driving forces involved in aggregation in each case. In one case, Smase-mediated generation of ceramide molecules in phospholipid monolayers causes different LDL particles attract each other in order to shield themselves from contact with the polar aqueous environment. In the other case, hydrophobic regions of LpL bind with multiple LDL particles causing aggregation by non-enzymatic bridging. Treatment with LpL first (Figure 3a, first section of bottom curve) resulted in an aggregation profile similar to that reported in Figure 1a. Subsequent treatment with Smase then generated ceramide (Figure 2), which is known to cause aggregation via hydrophobic shielding. In this case however, no further aggregation was observed; possibly because other LDL particles containing ceramide, and available for hydrophobic shielding, were present locally within the same LpL-induced aggregate (Figure 3a second section of bottom curve, and Figure 3d Sequence I).
Conversely, treatment of native LDL with Smase first resulted in an aggregation profile similar to what we have observed in past studies (Figure 3a, first section of top curve) [27]. Subsequent treatment with LpL caused an increased final aggregate size (Figure 3a second section of top curve, and Figure 3d Sequence II), which may have resulted from the binding of multiple Smase-induced aggregates with each other. When both enzymes were added together, either simultaneously or after a co-preincubation, aggregate sizes showed increased variability (Figure 3 b&c). It is possible that hybridized aggregates, containing both “LpL-bound” and “ceramide-aggregated” LDL, reorganized into more stable aggregates due to a competition between aggregation mechanisms, thus increasing the variability in this data set (Figure 3d Sequence III).
If LDL is exposed to LpL first, as might be the case for early lesions when LDL is retained by the SMC ECM but not modified, sequence I could apply. Then, in more advanced lesions Smase and LpL might both have access to newly retained LDL and sequences II and III could apply. If therapeutic inhibition of LpL or Smase were used, it would be useful to consider the potential effects this would have on directing LDL aggregation through a particular aggregation sequence (I, II, or III).
In conclusion, we have demonstrated the individual and combined effects of LpL and Smase on atherogenic LDL modification and aggregation. Though the experiments studied here focused on atherogenic processes occurring in solution and not on a SMC ECM, this work can be used as a model of an in vivo system because it is likely that there are similarities in how the enzymes would behave in the two systems. We show that that LpL alone is sufficient to cause LDL aggregation and that ceramide production decreases due to LpL-mediated aggregation of LDL. By changing the order of enzyme addition we show that ceramide generated from LpL-pretreated samples does not cause additional aggregation of pre-formed aggregates. Measurement of aggregation kinetics of LpL-and-Smase treated samples suggests a possible competition between aggregation mechanisms. Finally, the similar ceramide production and aggregation in the presence and absence of extracellular matrix indicates that the SMC ECM does not sort LDL by selectively binding aggregates of different size or chemical composition. Understanding the mechanisms of LpL-and-Smase-mediated aggregation of LDL may provide specific points of intervention to design novel effective antiatherogenic therapeutics.
Acknowledgments
This work was supported by Grant Number 5 R01 GM071355 from the National Institute of General Medical Sciences. We would also like to thank Dr. Kevin J. Williams (Temple University, School of Medicine) for his extensive advice and support.
References
- 1.Williams KJ, Tabas I. Arterioscler Thromb Vasc Biol. 1995;15:551. doi: 10.1161/01.atv.15.5.551. [DOI] [PMC free article] [PubMed] [Google Scholar]
- 2.Skalen K, Gustafsson M, Rydberg EK, Hulten LM, Wiklund O, Innerarity TL, Boren J. Nature. 2002;417:750. doi: 10.1038/nature00804. [DOI] [PubMed] [Google Scholar]
- 3.Lodish H, et al. Molecular Cell Biology. 5th. W H Freeman; 2003. [Google Scholar]
- 4.Nelson GJ, Freeman NK. J Biol Chem. 1960;235:578. [PubMed] [Google Scholar]
- 5.Skipski VP, Barclay M, Barclay RK, Fetzer VA, Good JJ, Archibald FM. Biochem J. 1967;104:340. doi: 10.1042/bj1040340. [DOI] [PMC free article] [PubMed] [Google Scholar]
- 6.Lindgren FT, Nichols AV, Hayes TL, Freeman NK, Gofman JW. Ann N Y Acad Sci. 1959;72:826. doi: 10.1111/j.1749-6632.1959.tb44208.x. [DOI] [PubMed] [Google Scholar]
- 7.Fielding CJ. FASEB J. 1992;6:3162. doi: 10.1096/fasebj.6.13.1327930. [DOI] [PubMed] [Google Scholar]
- 8.Boren J, Olin K, Lee I, Chait A, Wight TN, Innerarity TL. J Clin Invest. 1998;101:2658. doi: 10.1172/JCI2265. [DOI] [PMC free article] [PubMed] [Google Scholar]
- 9.Iverius PH. J Biol Chem. 1972;247:2607. [PubMed] [Google Scholar]
- 10.Tran-Lundmark K, Tran PK, Paulsson-Berne G, Friden V, Soininen R, Tryggvason K, Wight TN, Kinsella MG, Boren J, Hedin U. Circ Res. 2008;103:43. doi: 10.1161/CIRCRESAHA.108.172833. [DOI] [PMC free article] [PubMed] [Google Scholar]
- 11.Malmsten M, Siegel G. Journal of Colloid and Interface Science. 1995;170:120. doi: 10.1006/jcis.1999.6689. [DOI] [PubMed] [Google Scholar]
- 12.Rodríguez M, Ringstad L, Schäfer P, Just S, Hofer HW, Malmsten M, Siegel G. Atherosclerosis. 2007;192:438. doi: 10.1016/j.atherosclerosis.2007.02.021. [DOI] [PubMed] [Google Scholar]
- 13.Gustafsson M, Levin M, Skalen K, Perman J, Friden V, Jirholt P, Olofsson SO, Fazio S, Linton MF, Semenkovich CF, Olivecrona G, Boren J. Circ Res. 2007;101:777. doi: 10.1161/CIRCRESAHA.107.149666. [DOI] [PubMed] [Google Scholar]
- 14.Tabas I, Li Y, Brocia RW, Xu SW, Swenson TL, Williams KJ. J Biol Chem. 1993;268:20419. [PubMed] [Google Scholar]
- 15.Goldberg IJ, Kandel JJ, Blum CB, Ginsberg HN. J Clin Invest. 1986;78:1523. doi: 10.1172/JCI112744. [DOI] [PMC free article] [PubMed] [Google Scholar]
- 16.Kirchgessner TG, Svenson KL, Lusis AJ, Schotz MC. J Biol Chem. 1987;262:8463. [PubMed] [Google Scholar]
- 17.Posner I, DeSanctis J. Biochemistry. 1987;26:3711. doi: 10.1021/bi00386a067. [DOI] [PubMed] [Google Scholar]
- 18.Kinnunen PK, Jackson RL, Smith LC, Gotto AM, Jr, Sparrow JT. Proc Natl Acad Sci U S A 74. 1977:4848. doi: 10.1073/pnas.74.11.4848. [DOI] [PMC free article] [PubMed] [Google Scholar]
- 19.Saxena U, Klein MG, Vanni TM, Goldberg IJ. J Clin Invest. 1992;89:373. doi: 10.1172/JCI115595. [DOI] [PMC free article] [PubMed] [Google Scholar]
- 20.Sendak RA, Bensadoun A. J Lipid Res. 1998;39:1310. [PubMed] [Google Scholar]
- 21.Marathe S, Schissel SL, Yellin MJ, Beatini N, Mintzer R, Williams KJ, Tabas I. J Biol Chem. 1998;273:4081. doi: 10.1074/jbc.273.7.4081. [DOI] [PubMed] [Google Scholar]
- 22.Schissel SL, Schuchman EH, Williams KJ, Tabas I. J Biol Chem. 1996;271:18431. doi: 10.1074/jbc.271.31.18431. [DOI] [PubMed] [Google Scholar]
- 23.Tabas I. Chem Phys Lipids. 1999;102:123. doi: 10.1016/s0009-3084(99)00080-8. [DOI] [PubMed] [Google Scholar]
- 24.Tomita M, Taguchi R, Ikezawa H. Biochim Biophys Acta. 1982;704:90. doi: 10.1016/0167-4838(82)90135-2. [DOI] [PubMed] [Google Scholar]
- 25.Kinnunen PK, Holopainen JM. Trends Cardiovasc Med. 2002;12:37. doi: 10.1016/s1050-1738(01)00143-8. [DOI] [PubMed] [Google Scholar]
- 26.Schissel SL, Jiang X, Tweedie-Hardman J, Jeong T, Camejo EH, Najib J, Rapp JH, Williams KJ, Tabas I. J Biol Chem. 1998;273:2738. doi: 10.1074/jbc.273.5.2738. [DOI] [PubMed] [Google Scholar]
- 27.Walters MJ, Wrenn SP. Langmuir. 2008;24:9642. doi: 10.1021/la800714w. [DOI] [PubMed] [Google Scholar]
- 28.Walters MJ, Wrenn SP. J Colloid Interface Sci. 2010;350:494. doi: 10.1016/j.jcis.2010.06.059. [DOI] [PMC free article] [PubMed] [Google Scholar]
- 29.Evans DF, Wennerström H. The Colloidal Domain: Where Physics, Chemistry, Biology, and Technology Meet. 2. 1999. [Google Scholar]