Microarray analysis of embryonic stem cell-derived retinal cells demonstrates the effectiveness of the directed differentiation protocol.
Abstract
Purpose.
A number of protocols have been published to induce retinal determination from human embryonic stem cells (hESC) and induced pluripotent stem cells (iPSC). Although all these studies have shown some degree of expression of markers of retinal cells, fewer than 30 markers are typically used to characterize the ESC-derived retinal cells. Hence, it is not known whether they express all the genes present in normal developing retinal cells. To assess the efficiency of their retinal determination protocol at the transcriptome level and to understand the changes in human retinal gene expression patterns during development, the authors conducted a microarray-based analysis comparing human retina to hESC-derived retinal cells.
Methods.
The authors extracted total RNA from 60-day, 80-day, and 96-day human fetal retina and hESC-derived retinal cells at 3 weeks and 9 weeks after induction. RNA was subjected to analysis using a commercial microarray. Data were normalized using Affymetrix Power Tools and analyzed using commercial microarray software.
Results.
On K-median clustering analysis, the authors found that overall there was a very high correlation between genes expressed in human fetal retina and those in ESC-derived retinal cultures. The cultures were at similar developmental ages to the corresponding fetal retinal ages. They found only 1% of the genes on the array to be expressed at a higher level in ESC-derived retinal cells than in fetal retina, and most of these were expressed in the retinal pigment epithelium and ciliary epithelium.
Conclusions.
In sum, gene array profiling provides an effective method for characterization of the efficiency of directed differentiation of hESCs to retinal cells.
Hereditary and age-related photoreceptor degenerative diseases can lead to the death of sufficient numbers of photoreceptor cells to cause significant visual impairment and blindness. The mammalian retina does not have an innate capacity to regenerate the dying cells (see Ref. 1 for review); visual prosthetics or cell replacement strategies are therefore being pursued in an effort to restore some vision to the most severely affected patients. Human embryonic stem cells (hESCs), because of their property of pluripotency, may have a significant role in cell replacement therapies in the eye. However, this same property requires that the cells be directed in their differentiation to retinal cell fates before use in therapies to minimize the risks of developing teratomas. Several groups, including our own, have previously shown that a combination of signaling molecules can direct ESCs to retinal cell fates (see Discussion). The retinal determination (RD) protocol we developed uses a combination of a BMP inhibitor (e.g., Noggin), a Wnt Inhibitor (DKK-1), and the growth factor IGF-1 (RD factors). With the RD protocol we can specifically induce retinal determination in hESCs,2 hiPSCs,3 and mouse ESCs (La Torre et al., unpublished observations, 2010) with very high efficiency. We also found that photoreceptors from these hESC-derived retinal progenitors have the capacity to convey some light responsiveness in a mouse model of Leber congenital amaurosis4 showing in principle that cell-based replacement therapy might be applicable to some forms of inherited retinal degeneration.
Before these hESC-derived retinal cells can be used therapeutically, they must be highly characterized. The presence of undifferentiated ESCs in a transplant may result in teratoma formation in the recipient eye, whereas the presence of other ESC-derived tissues, such as muscle or bone, would likely interfere with normal visual function. In our earlier studies, we used quantitative PCR (QPCR) to assess the levels of markers of the various lineages. However, these studies provided only a limited view of the status of differentiation of the population of cells treated with the RD factors. Here, we instead used cDNA microarrays to get a more global view of the efficiency of our RD protocol. We performed microarray analysis on hESC-derived cells from two different time points (3 weeks and 9 weeks) and on human fetal retinas from three different ages (60, 80, and 96 days after conception). This allowed us to compare the efficiency of our protocol and to stage our cells with relation to human retinal development in vivo. Our results indicate that most cells in the cultures treated with the RD protocol develop as retinal progenitors and ultimately differentiate into retinal cells. Markers for nonocular tissues were absent or expressed at very low levels, though we did find evidence for the presence of pigmented epithelial cells and ciliary epithelial cells in the cultures. This is the first study to assess the purity of hESC-derived retinal cells at the transcriptome level, and it provides a baseline for comparison for future studies using other directed differentiation protocols.
Methods
Cell Culture and Retinal Induction
The H-1 (WA01) hESC line was obtained from the WiCell Research Institute. The cells were cultured and passaged on a feeder layer made of irradiated mouse embryonic fibroblasts in accordance with the University of Washington Institutional Animal Care and Use Committee–approved protocols, as previously described.2 Retinal induction was performed as previously described. Briefly, embryoid bodies (EBs) were formed by treating undifferentiated hES cell colonies with type IV collagenase (Invitrogen, Carlsbad, CA) and resuspending approximately 150 clumps/mL (100 cells/clump) in a six-well, ultra-low attachment plate (VWR, West Chester, PA). These EBs were cultured for 3 days in the presence of mouse Noggin (R&D Systems, Minneapolis, MN), human recombinant DKK-1 (R&D Systems), and human recombinant insulin-like growth factor-1 (IGF-1; R&D Systems). On the fourth day, EBs were plated onto poly-d-lysine-extracellular matrix (Matrigel; Collaborative Research, Inc., Bedford, MA)–coated plates and cultured in the presence of DMEM/F12, B-27 supplement, N-2 supplement (Invitrogen), mouse Noggin, human recombinant DKK-1, human recombinant IGF-1, and human recombinant basic fibroblast growth factor (R&D Systems). The media were changed every 2 to 3 days for up to 3 weeks. Thereafter, the cells were cultured in the media without any growth factors. For further aggregate culture, rosette-like regions from the plate were manually transferred to low-attachment plates and allowed to self-aggregate and grow. Half the media were changed every 2 days.
Immunocytochemistry and Immunohistochemistry
hESC-derived retinal aggregates were fixed with 4% paraformaldehyde, embedded in OCT, and cryosectioned. The cells were analyzed with the following antibodies: rabbit anti-recoverin (gift from Jim Hurley, University of Washington), mouse anti-Hu C/D (Molecular Probes), mouse anti-Pax6 (DHSB), goat anti-Sox2, rabbit anti-Nrl (gift from Anand Swaroop), and rabbit anti-Sox9 (Abcam, Cambridge, MA). Secondary antibody staining was performed using the corresponding Alexa Fluor-488, Alexa Fluor -568, and Cy5 fluorescent-tagged antibodies (Molecular Probes, Eugene, OR). Nuclei were labeled using DAPI. Images were captured using a confocal microscope (Olympus, Tokyo, Japan). Image analysis was performed using confocal imaging software (Volocity; Improvision; PerkinElmer, Waltham, MA) and graphics editing software (Photoshop; Adobe, Mountain View, CA).
Microarray and QPCR Analysis
For microarray analysis, human eyes from fetal ages 60, 80, 96, and 145 days were obtained from the University of Washington's Laboratory of Developmental Biology without any identifiers. Fresh tissue was received within 2 to 3 hours postmortem, and the retina was dissected of all extraocular tissue and retinal pigment epithelium (RPE) in cold HBSS. For RPE microarray, RPEs from the 145 fetal day eye was used. The retinas were lysed in reagent (Trizol; Invitrogen). Similarly, 3-week hESC-derived retinal cells and retinal aggregates at 9 weeks after retinal induction were lysed in reagent (Trizol; Invitrogen). Total RNA was extracted from the cultures by phenol-chloroform extraction and ethanol precipitation in accordance with the manufacturer's instructions. This was followed by DNase-I (Qiagen, Valencia, CA) treatment followed by RNA cleanup using the Qiagen RNA mini cleanup kit. RNA was then checked for integrity and run in accordance with the manufacturer's guidelines on gene chip array (Human Gene 1.0 ST chip; Affymetrix, Santa Clara, CA) at the University of Washington's Center for Array Technologies. The data were then normalized with Affymetrix Power Tools software and were analyzed using microarray software (TM4 Multi-Experiment Viewer; Dana Farber Cancer Institute, Boston, MA).5 The RNA was also used to make cDNA using a reverse transcription kit (Superscript II; Invitrogen) as previously described, and real-time QPCR was performed after β-actin normalization. The primers used for PCR are listed in Supplementary Table S1 (http://www.iovs.org/lookup/suppl/doi:10.1167/iovs.10-6504/-/DCSupplemental).
Results
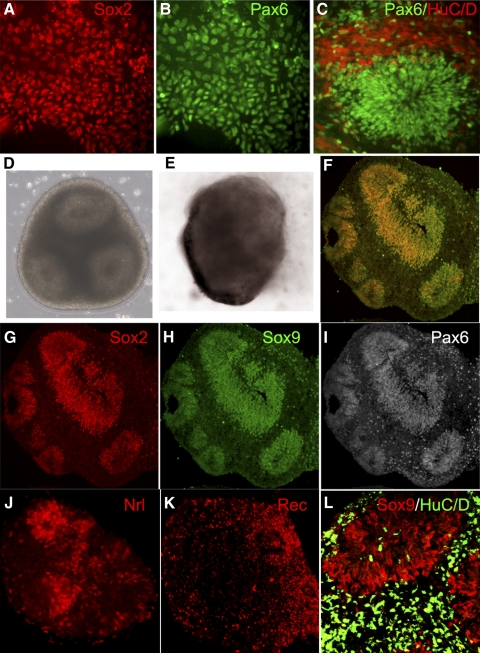
We have previously reported that hESCs can be directed to a retinal identity using a combination of Dkk1, Noggin, and IGF-1 treatment. For microarray comparisons, hESCs from the WA01 line were differentiated in the presence of these factors for 3 weeks (Figs. 1A–C), and RNA was extracted. We also allowed similarly treated cultures to develop for an additional 3 weeks, and at this time regions of neural rosettes were manually picked and allowed to self-aggregate and were grown for an additional 3 weeks (9 weeks total). This was done to enhance intercellular interactions in a three-dimensional environment akin to normal retinal development. When we analyzed these retinal aggregates, we found that the cells had arranged themselves into multiple rosettes (Fig. 1D). The centers of the rosettes had retinal progenitors expressing Pax6, Sox2, and Sox9 (Figs. 1F–I), whereas the differentiated cells were frequently found between the rosettes and expressed markers of differentiation such as Recoverin, NRL, and HuC/D (Figs. 1J–L). We also found evidence for RPE differentiation at the periphery of these rosettes (Fig. 1E). The RNA extracted from the hESC cultures at 3 and 9 weeks was compared with that from human fetal retina at 60, 80, and 96 fetal days using arrays (Human Gene 1.0 ST; Affymetrix).
Figure 1.
hESC-derived retinal cells at 3 weeks (A–C) and 9 weeks (D–L). At 3 weeks, RD cells expressed Sox2 (A, red), Pax6 (B, C, green), and HuC/D (C, red). (D, E) Floating retinal aggregates at 9 weeks with rosettes and RPE. On immunostaining, the centers of the rosettes express Sox2 (F, G, red), Sox9 (F, H, green), and Pax6 (F, I, white; F, merge). The rosettes also express Nrl (J, red) and Recoverin (K, red). (L) HuC/D (green) expressing ganglion and amacrine cells within and around Sox9-expressing neural progenitors (red) in rosettes.
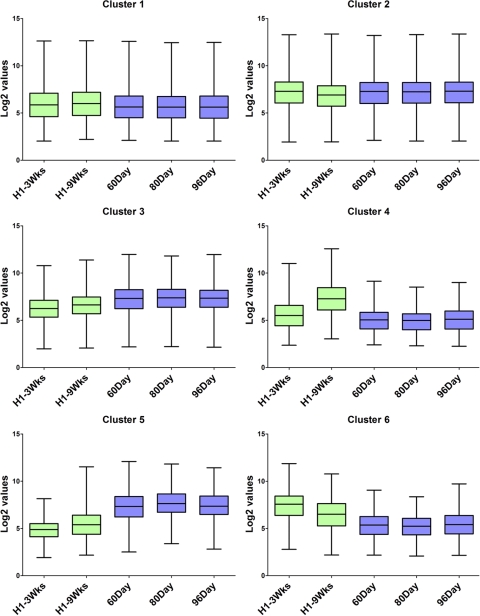
The microarray data were subjected to K-medians clustering using the cosine correlation distance metric to subdivide the gene set into six clusters based on the expression profiles of the different groups (Fig. 2). Eighty-two percent of the genes lay in clusters 1 and 2, which consisted of genes whose expression was similar between human fetal and hESC-derived retinal cells, and 11% of the genes lay in cluster 3, which consisted of genes with low expression in the hESCs treated with RD factors for 3 weeks, higher expression in the 9-week cultures, and even higher expression in the fetal retinal samples. Cluster 4, representing 2% of the total genes on the microarray, consisted of genes that were more highly expressed in the 9-week cultures over any other sample. Cluster 5, also representing 2% of the total genes on the array, contained genes that were more highly expressed in fetal retinal samples than in either of the RD-treated hESCs. Cluster 6 contained genes with a pattern opposite that of cluster 5 in that it contained genes that were expressed more highly in the RD-treated cultures than in the fetal retinal samples. Overall, the clustering algorithm shows that most of the genes on the microarray have a similar pattern of expression among the samples but that 17% have sufficient differences in their pattern of expression to be clustered differently. Heat maps of each of these clusters are shown in Supplementary Figures S1 to S6 (http://www.iovs.org/lookup/suppl/doi:10.1167/iovs.10-6504/-/DCSupplemental).
Figure 2.
K-median clustering of the microarray data using cosine correlation distance metric into six clusters represented as a box and whiskers plot. Whiskers represent minimum and maximum values. The y-axis represents Log2 values.
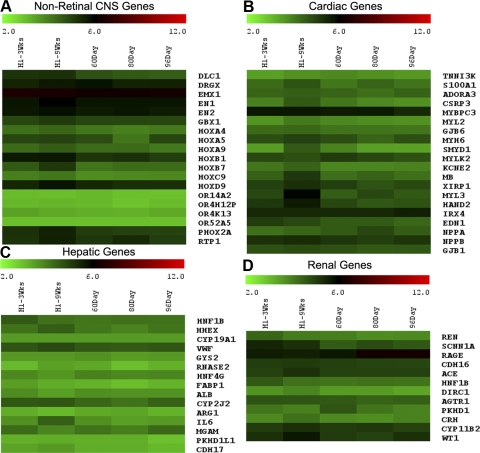
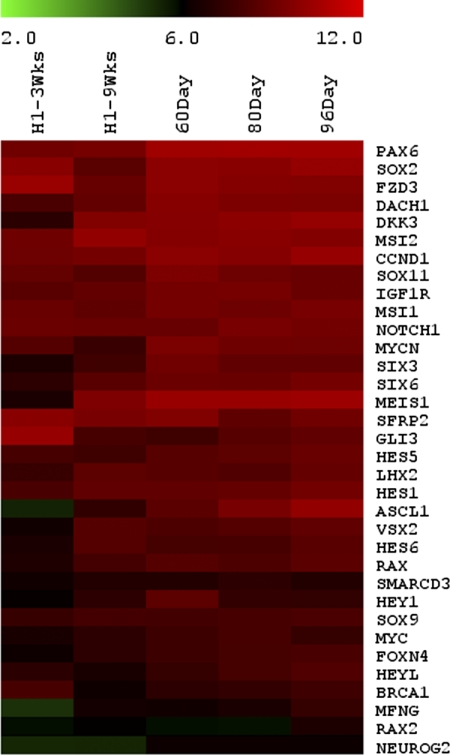
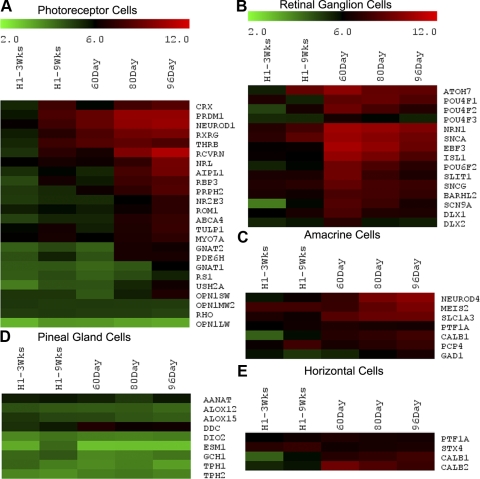
The genes represented in clusters 1 and 2 have similar expression levels in the two ESC-derived retinal cell samples and the three ages of fetal retina. Heat maps for all the genes in these two clusters are shown in Supplementary Figures S1 and S2 (http://www.iovs.org/lookup/suppl/doi:10.1167/iovs.10-6504/-/DCSupplemental) and for specific subsets of these genes in Figures 3 and 4. Most of the genes on the array have similar expression patterns in the ESC-derived retinal cells and the human fetal retinal samples. Figure 4 shows examples of genes with high levels of expression in all samples; these include the early neural ectodermal genes SOX2, SOX9, NES, NOTCH1, JAG2, and NUMBL, consistent with our previous characterization of these cells in earlier publications. By contrast, Figure 3 shows specific examples of genes that are expressed at low levels in all samples. Many of these genes are expressed highly in other tissues, such as the liver, kidney, and heart.6–9 Figure 3 also shows examples of genes expressed highly in other regions of the CNS during development. None of these genes are expressed in the RD-treated hESCs, showing that the retinal determination conditions do not produce cells of diverse tissues types or CNS regions. The pineal gland is known to express a number of genes that are also expressed in the retina. However, pineal-specific genes such as AANAT, TPH1, TPH2, DIO2, ESM1, and DDC10 are not expressed in any of the samples, including the hESC-derived retinal cells at 3 and 9 weeks (Fig. 5D). Taken together, the data from clusters 1 and 2 indicate that at 3 weeks of differentiation of the hES cells with the RD factors, the cells have already adopted a neural progenitor phenotype, and this is maintained to 9 weeks.
Figure 3.
Heat map of the nonretinal-specific genes. Log2 expression levels are shown in a green-black-red gradient. Nonretinal CNS-, liver-, heart-, and kidney-specific genes are not expressed in our cultures or fetal retinas.
Figure 4.
Heat map of various genes expressed by retinal progenitor cells. Log2 expression levels are shown in a green-black-red gradient. Retinal progenitor genes are highly expressed in our cultures and in fetal retina.
Figure 5.
Heat map of various genes expressed by differentiated retinal neurons and the pineal gland. Log2 expression levels are shown in a green-black-red gradient. Genes expressed by photoreceptors (A), ganglion cells (B), amacrine cells (C), and horizontal cells (E) are present by 9 weeks, whereas those in the pineal gland (D) are absent in our cultures. Mature markers of photoreceptors such as opsins are poorly expressed by 9 weeks in culture or by 96 days in vivo.
Cluster 3 represents genes that are more highly expressed in the fetal samples than in the hESC-derived retinal cells and that show an increase in expression between 3 and 9 weeks. Cluster 3, with 11% of the genes on the array, contains many genes known to be expressed in retinal progenitors (Supplementary Fig. S3, http://www.iovs.org/lookup/suppl/doi:10.1167/iovs.10-6504/-/DCSupplemental). Heat maps for several of these genes are also shown in more detail in Figure 4 and include PAX6, SIX3, SIX6, LHX2, RAX, HES1, HES5, DKK3, and MEIS1. There is a clear progression in the level of expression of these genes from 3 weeks of RD treatment to 9 weeks of culture. It is also interesting that ASCL1 and HES6, previously described markers of later-staged progenitors, show a progressive increase in expression across the three ages of human fetal retina, and an increase from 3 weeks to 9 weeks in the hESC-derived retinal cells. These data allow us to “stage” the ESC-derived retina as close as possible to 60 days of human fetal development, suggesting that the development of retinal cells from hESCs approximates that of normal development.
Cluster 5 contains genes that are expressed more highly in the fetal retinal samples than in the hESC-derived retinal cells compared with cluster 3. Many of the genes in this cluster are those normally expressed in the various types of differentiated retinal neurons. Figure 5 shows the expression of several of these genes organized by cell type. In Figure 5A, genes expressed in photoreceptors are shown. Those genes that are expressed early in photoreceptor cell differentiation, such as CRX, PRDM1 (BLIMP1), THRB, RXRG, and NEUROD1, are expressed at all stages of fetal retinal development and in the 9-week hESC-derived retinal cells. A second group of genes, RCVRN, NRL, AIPL1, and RBP3, is expressed at a low level in the 9-week cultures and at 60 days; however, genes typically expressed later in photoreceptor development, such as NR2E3, GNAT1, GNAT2, RS1 and various opsins, are not expressed in either the hESC-derived retinal cells or in the 60 day fetal retina, and are only beginning to be expressed between 80 and 96 days. These data show that the microarrays can detect the normal progression of photoreceptor differentiation in fetal human retinas and that the expression of the photoreceptor markers increases with time in vitro in the hESC-derived retinal cultures.
The genes representing other retinal cell types are also shown in Figure 5. Gene expression data show a gradual increase in the presence of markers of other types of retinal cells in the hESC cultures. Several genes characteristic of ganglion cells, including ATOH7 (MATH5), POU4F1, POU4F2, ISL1, and DLX1, are present in the fetal retina and show a low level of expression in the 9-week hESC-derived retinal cells (Fig 5B). Genes characteristic of amacrine cells, including PTF1A, MEIS2, NEUROD4, and PCP4 (Fig 5C), and horizontal cells, including PTF1A, STX4, CALB1, and CALB2 (Fig 5E), are also expressed in the fetal retina and, to some extent, in the hESC-derived retinal cells, albeit at lower levels. Overall, we found that many early cell type-specific markers were expressed in the hESC-derived retinal cells by 9 weeks of retinal determination.
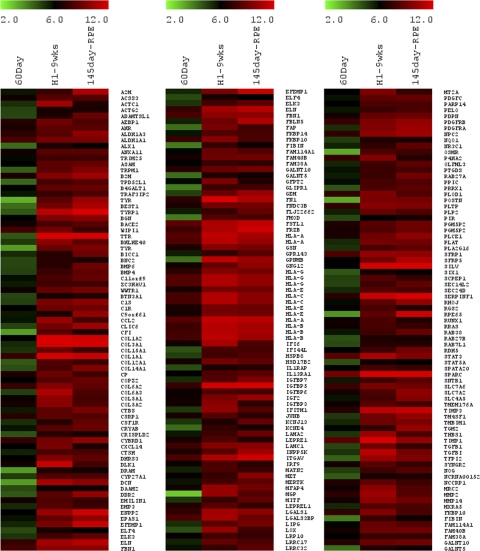
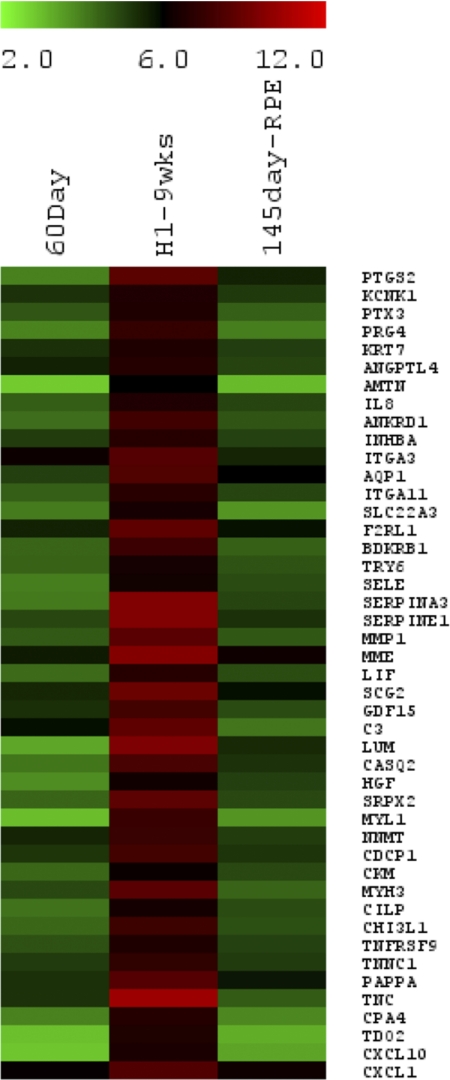
Clusters 4 and 6 included genes that were expressed at greater levels in hESC-derived cultures than in fetal retina. Cluster 4 had genes that were highly expressed only in the hESC-derived 9-week cells. Examination of the genes in this cluster indicated that many had been previously shown to be expressed in the RPE. Given that RPE cell differentiation is also present in the 9-week hESC cultures and that the fetal retinal tissue used in the study was cleared from all RPE, it is not surprising that RPE genes would be enriched in our hESC-derived cultures. To confirm this, we ran a microarray using 145-day human fetal RPE and compared the genes from cluster 4. We found that nearly all the genes in this cluster are highly expressed in the RPE, including MITF, BEST1, ALDH1A1, MERTK, RPE65, TTR, TYR, RDH5, CAV1, CAV2, SILV, TIMP1 TIMP3, MMP2, MMP14, PDGFR-A, C1S, and C1R11(Fig. 6). This cluster also included approximately 45 genes (0.2% of all genes) that were not expressed in fetal RPE (Fig. 7); it is not clear whether these represent some contaminating cell population in the cultures or whether these are abnormally expressed in the hESC-derived retinal cells. These might also represent ciliary epithelial differentiation in the cultures because some of the more highly expressed genes in this subcluster are known to be expressed in the ciliary tissue (SCG2, AQP1, MMP1, CASQ212–15).
Figure 6.
Heat map of various genes expressed by retinal pigment epithelium. Log2 expression levels are shown in a green-black-red gradient. Cluster 4 mainly represented RPE genes seen in the 145-day fetal RPE and absent in the 60-day human fetal retina.
Figure 7.
Heat map of a subset of genes in Cluster 4 that are not expressed in fetal RPE. Log2 expression levels are shown in a green-black-red gradient. This group may represent aberrant gene expression as a result of culture and some ciliary genes such as AQP1, MMP1, and SCG2.
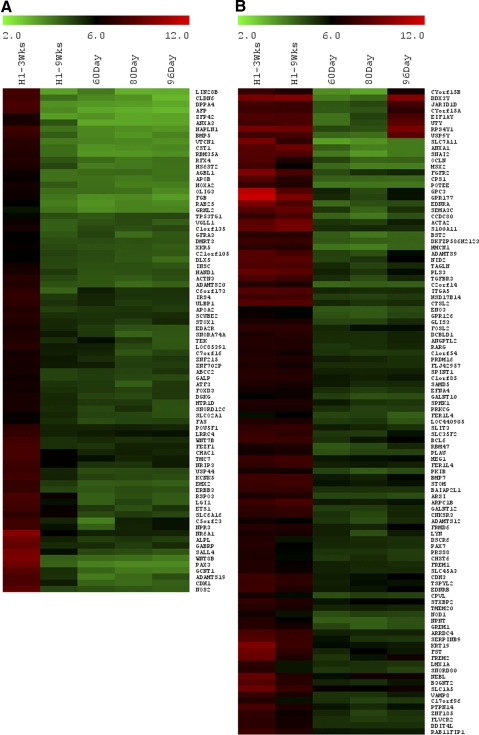
Cluster 6 had two subsets of genes (Fig. 8). One group included genes that had higher expression at 3 weeks of retinal determination but that declined by 9 weeks (102 genes or ∼0.5%). This cluster included some early undifferentiated, pluripotency markers such as POU5F1, DPPA4, LIN28, and LIN28B. Also represented in this subcluster are OLIG3, FEZF1, DLX5, WNT8B, WNT7B, and PAX3. These genes are all expressed in the embryonic thalamus, near the zona limitans intrathalamica.16 This region of the developing diencephalon appears to be induced by the RD factors, particularly at 3 weeks of treatment. Other genes in this subcluster may reflect the pattern of gene expression in this region of the CNS as well, though these have not been characterized at these stages of brain development. Alternatively, these other genes may represent a small level of contaminating cells of an unknown phenotype. Nevertheless, by 9 weeks, these genes are all at levels close to those of the fetal retina, and so it appears that this region of the CNS is not maintained through our culture conditions and purification steps. The second subset contains 115 (∼0.5%) genes that are expressed more highly in both stages of hESC cultures than in the fetal retina samples (Fig. 8). Some of these genes are known to be expressed in ventral thalamus (SEMA3C; SLIT3),17 RPE (PRDM16, BMP7, KRT19),11 and ciliary epithelium (MSX2, FST),18,19 though one of the most highly expressed genes in this subcluster, GPC3, is expressed during development in the Rathke's pouch, and the posterior wall of the diencephalon at high levels,20 suggesting that this region of the CNS may also be induced in the hESCs by the RD conditions. Nevertheless, most of the genes in this cluster decline in expression between 3 and 9 weeks, consistent with the increasing purity of the cultures for retinal cells with our protocol.
Figure 8.
Heat map of various genes in Cluster 6. Log2 expression levels are shown in a green-black-red gradient. This included two subsets: high at 3 weeks only (A) and high at both 3 and 9 weeks (B) compared with the human fetal retina.
Microarray data were validated by running QPCR for a number of genes. For this we picked genes expressed in neural retinal progenitors (e.g., PAX6, SOX2, LHX2, RX, SIX3, NOTCH1, ASCL1, and HES1), genes expressed in differentiated retinal cells (e.g., CRX. RCVRN, THRB, NRL, PRDM1, OPNSW, RHO, OPN1MW, and BRN3B), and genes expressed in the RPE (e.g., MITF, TYR, and TTR). We also analyzed the expression of genes not expressed in the retina but known to be expressed in other regions of the developing CNS (e.g., GBX2, EN1, and HOXC9) as well as genes previously shown to be expressed in the mesendoderm (e.g., HHEX, MYH6, MYL2, REN, and VWF). The QPCR profile confirmed the data from the microarrays; 9-week hESC-derived retinal cultures had a gene expression profile similar to that of three different ages of human fetal retina (Fig. 9). Figure 9 shows the XY-scatter plots of these comparisons. The r values indicate a high degree of correlation in gene expression among all three ages of human fetal retina and the 9-week cultures. This correlation was even stronger when the RPE genes were excluded from the comparison (Fig. 9).
Figure 9.

x-y scatterplot of gene expression by QPCR between the 9-week hESC-derived retinal cultures and the 60-, 80-, and 96-day human fetal retina. There is a strong correlation suggested by the r values, and the P values show significant correlation for all three ages of the fetal retina. The r values are further increased once RPE genes are excluded from the correlation analysis.
Discussion
Gene expression profiling allows a comprehensive comparison of hESCs directed to a specific lineage and the normal, developing tissue. This can show how closely ESC-derived tissue resembles normal tissue, at what stage the cells are relative to a similar stage of fetal development, and whether there are significant contaminating cell/tissue populations. These all will have to be taken into account if the cells are to be used for modeling disease or for cell-based therapy. This methodology has been used by a few other laboratories with great success for detailed analysis of hESC-derived progeny.7,21,22
Microarray analysis confirmed that our protocol results in highly efficient differentiation of hESCs toward a retinal lineage. In addition to our studies on directed differentiation of retinal cells from hESCs, several other groups have developed alternative protocols.23–25 Even though there are some similarities between the protocols, there are some key differences. Takahashi et al.26 developed a protocol that is also based on inhibition of the Wnt and BMP/nodal pathways using cytokines25 or small molecules. Gamm et al.23 used a different approach of manually selecting floating spheres that had a neural rosette morphology. In addition, each laboratory used different sets of markers to assess the efficiency of the protocol, and this makes comparison between the different methods difficult. However, global gene expression profiling such as the method we carried out in this report could allow standardization and direct comparisons of these different methods of retinal differentiation.
Comparing the gene expression pattern of cells grown in culture plates with normal tissue provides a way to stage the cells that could be important for cell therapy applications. For example, McLaren et al.27 reported that the best integration efficiency of transplanted photoreceptors depends on the developmental stage of the donor tissue. When comparing 3-week hESC-derived retinal cells with human fetal retinas, we found that the levels of expression of retinal progenitor markers had not yet reached those of the 60-day fetal retina. However, when we compared the status of the hESC-derived retinal cells at 9 weeks, the expression levels of progenitor genes were much closer to those of the 60-day human fetal retina. The hESC-derived retinal cells also expressed early markers of differentiation of ganglion cells, amacrine cell, horizontal cells, and photoreceptors. The photoreceptor gene expression profile at 9 weeks was closer to that of the 60-day fetal retina; the cells did not yet express late markers of photoreceptor differentiation such as NR2E3, ABCA4, ROM1, and TULP1, which are expressed in the 80-day fetal retina. This suggests that the differentiation of the ES-derived retinal cells was moving at a pace similar to that of normal fetal development. Thus, longer culture periods and rod photoreceptor-inducing factors may be necessary to stimulate the expression of later genes.24 However, the correlation coefficient for the QPCR results was highest when comparing the ES-derived cells with the 96-day fetal retina. This disparity may be due to a lack of synchronization in the ES-derived retinal cells that is present in the fetal retinas. Nevertheless, overall the results of the gene expression analysis are consistent with our previous observations that the ESC-derived retinal cells follow a developmental time course similar to that of their in vivo counterparts.
Microarray analysis also allows us to detect any significant contaminating cell or tissue type. The analysis showed that several potential contaminating populations, including other regions of the CNS, were not present in the cultures; there was little expression of genes known to be expressed in other areas of the CNS, such as spinal cord or telencephalon. The exception was that a small number of genes expressed in nonoptic regions of the diencephalon, such as the hypothalamus and pituitary, were expressed in the RD-treated hESCs. This is perhaps not surprising because these cell types are derived from regions of the neural plate immediately adjacent to the optic field, and the factors that we use for optic field differentiation might also direct cells to nearby identities. Another potential contaminating tissue is the pineal gland, a neuroendocrine organ known to play an important role in the maintenance of circadian rhythm through the regulated secretion of melatonin. The pineal gland expresses several genes made in the retina, including photoreceptor genes such as CRX, OTX2, and NEUROD1.10 To rule out the presence of pineal tissue in our cultures, we looked for the expression of genes known to be expressed in the pineal gland but not in the retina. These included genes involved in the melatonin pathway, among them AANAT, TPH1, and TPH2. We did not detect the expression of any of these genes. Gene signatures for other major tissues, such as heart, liver and kidneys, were also not detected in the hESC-derived retinal cells. On detailed analysis of clusters 4 and 6, we found approximately 1% of the genes on the microarray had expression patterns higher than those of fetal retina, which included some ciliary epithelium genes as well as genes in the surrounding areas of the CNS. This indicated a very low level of contamination in our cultures. The expression of markers of undifferentiated, pluripotent embryonic stem cells, such as Oct4 and Nanog, also progressively declined with time in RD conditions, reaching those of the 60-day fetal retina by 9 weeks. Thus, a longer differentiation protocol is likely better suited to minimize any risk of teratoma formation if the cells are to be used in cell replacement therapy.
We did pick up one “contaminating” cell population: the RPE. Because the optic vesicle gives rise to both the retina and the RPE, this is perhaps not surprising. In addition, we3 and others23 have previously reported that RD protocols direct cells to RPE and to neural retina. On microarray comparison, the RD-treated cells have a molecular profile similar to that of human fetal RPE. We found the expression of BEST1, MITF, MERTK, TTR, TYR, and RPE65 and components of the complement pathway known to be expressed in RPE. We also picked up a few genes indicating the presence of the ciliary epithelium (SCG2, AQP1, MMP1, and CASQ2), another derivative of the optic vesicle.
In conclusion, these data confirm that our directed differentiation protocol generates ESCs that are highly similar to those of human retina and RPE. Gene profiling provides an efficient way to determine the approximate stage of development the hESCs have reached in the cultures, and it also provides information about potential contaminating populations. This type of analysis can therefore provide an effective method for the characterization of retinal cells derived from stem cell sources.
Supplementary Material
Acknowledgments
The authors thank the members of the Reh and Bermingham-McDonogh laboratories for their helpful criticism.
Footnotes
Supported by National Institutes of Health Grants 1 PO1 GM081619-01 and TA-CBT-0608-0464-UWA-WG (TAR). Human fetal tissue was obtained through the Laboratory of Developmental Biology project supported by National Institutes of Health Award Number 5R24HD000836 from the Eunice Kennedy Shriver National Institute of Child Health and Human Development. The content does not necessarily represent the official views of the Eunice Kennedy Shriver National Institute of Child Health and Human Development of the National Institutes of Health.
Disclosure: D.A. Lamba, None; T.A. Reh, None
References
- 1. Lamba D, Karl M, Reh T. Neural regeneration and cell replacement: a view from the eye. Cell Stem Cell. 2008;2:538–549 [DOI] [PMC free article] [PubMed] [Google Scholar]
- 2. Lamba DA, Karl MO, Ware CB, Reh TA. Efficient generation of retinal progenitor cells from human embryonic stem cells. Proc Natl Acad Sci U S A. 2006;103:12769–12774 [DOI] [PMC free article] [PubMed] [Google Scholar]
- 3. Lamba DA, McUsic A, Hirata RK, Wang PR, Russell D, Reh TA. Generation, purification and transplantation of photoreceptors derived from human induced pluripotent stem cells. PLoS One. 2010;5:e8763. [DOI] [PMC free article] [PubMed] [Google Scholar]
- 4. Lamba DA, Gust J, Reh TA. Transplantation of human embryonic stem cell-derived photoreceptors restores some visual function in Crx-deficient mice. Cell Stem Cell. 2009;4:1–7 [DOI] [PMC free article] [PubMed] [Google Scholar]
- 5. Saeed AI, Bhagabati NK, Braisted JC, et al. TM4 microarray software suite. Methods Enzymol. 2006;411:134–193 [DOI] [PubMed] [Google Scholar]
- 6. Higgins JP, Wang L, Kambham N, et al. Gene expression in the normal adult human kidney assessed by complementary DNA microarray. Mol Biol Cell. 2004;15:649–656 [DOI] [PMC free article] [PubMed] [Google Scholar]
- 7. Xu XQ, Soo SY, Sun W, Zweigerdt R. Global expression profile of highly enriched cardiomyocytes derived from human embryonic stem cells. Stem Cells. 2009;27:2163–2174 [DOI] [PubMed] [Google Scholar]
- 8. Schwab K, Patterson LT, Aronow BJ, Luckas R, Liang HC, Potter SS. A catalogue of gene expression in the developing kidney. Kidney Int. 2003;64:1588–1604 [DOI] [PubMed] [Google Scholar]
- 9. Challen G, Gardiner B, Caruana G, et al. Temporal and spatial transcriptional programs in murine kidney development. Physiol Genomics. 2005;23:159–171 [DOI] [PubMed] [Google Scholar]
- 10. Bailey MJ, Coon SL, Carter DA, et al. Night/day changes in pineal expression of >600 genes: central role of adrenergic/cAMP signaling. J Biol Chem. 2009;284:7606–7622 [DOI] [PMC free article] [PubMed] [Google Scholar]
- 11. Booij JC, ten Brink JB, Swagemakers SM, et al. A new strategy to identify and annotate human RPE-specific gene expression. PLoS One. 2010;5:e9341. [DOI] [PMC free article] [PubMed] [Google Scholar]
- 12. Coca-Prados M, Escribano J, Ortego J. Differential gene expression in the human ciliary epithelium. Prog Retin Eye Res. 1999;18:403–429 [DOI] [PubMed] [Google Scholar]
- 13. Diehn JJ, Diehn M, Marmor MF, Brown PO. Differential gene expression in anatomical compartments of the human eye. Genome Biol. 2005;6:R74. [DOI] [PMC free article] [PubMed] [Google Scholar]
- 14. Yamaguchi Y, Watanabe T, Hirakata A, Hida T. Localization and ontogeny of aquaporin-1 and -4 expression in iris and ciliary epithelial cells in rats. Cell Tissue Res. 2006;325:101–109 [DOI] [PubMed] [Google Scholar]
- 15. Gaton DD, Sagara T, Lindsey JD, Weinreb RN. Matrix metalloproteinase-1 localization in the normal human uveoscleral outflow pathway. Invest Ophthalmol Vis Sci. 1999;40:363–369 [PubMed] [Google Scholar]
- 16. Scholpp S, Lumsden A. Building a bridal chamber: development of the thalamus. Trends Neurosci. 2010;33:373–380 [DOI] [PMC free article] [PubMed] [Google Scholar]
- 17. Hernandez-Montiel HL, Tamariz E, Sandoval-Minero MT, Varela-Echavarria A. Semaphorins 3A, 3C, and 3F in mesencephalic dopaminergic axon pathfinding. J Comp Neurol. 2008;506:387–397 [DOI] [PubMed] [Google Scholar]
- 18. Monaghan AP, Davidson DR, Sime C, et al. The Msh-like homeobox genes define domains in the developing vertebrate eye. Development. 1991;112:1053–1061 [DOI] [PubMed] [Google Scholar]
- 19. Darland DC, Link BA, Nishi R. Activin A and follistatin expression in developing targets of ciliary ganglion neurons suggests a role in regulating neurotransmitter phenotype. Neuron. 1995;15:857–866 [DOI] [PubMed] [Google Scholar]
- 20. Pellegrini M, Pilia G, Pantano S, et al. Gpc3 expression correlates with the phenotype of the Simpson-Golabi-Behmel syndrome. Dev Dyn. 1998;213:431–439 [DOI] [PubMed] [Google Scholar]
- 21. Li Z, Wilson KD, Smith B, et al. Functional and transcriptional characterization of human embryonic stem cell-derived endothelial cells for treatment of myocardial infarction. PLoS One. 2009;4:e8443. [DOI] [PMC free article] [PubMed] [Google Scholar]
- 22. Liao JL, Yu J, Huang K, et al. Molecular signature of primary retinal pigment epithelium and stem-cell derived RPE cells. Hum Mol Genet. 2010;19:4229–4238 [DOI] [PMC free article] [PubMed] [Google Scholar]
- 23. Meyer JS, Shearer RL, Capowski EE, et al. Modeling early retinal development with human embryonic and induced pluripotent stem cells. Proc Natl Acad Sci U S A. 2009;106:16698–16703 [DOI] [PMC free article] [PubMed] [Google Scholar]
- 24. Osakada F, Ikeda H, Mandai M, et al. Toward the generation of rod and cone photoreceptors from mouse, monkey and human embryonic stem cells. Nat Biotechnol. 2008;26:215–224 [DOI] [PubMed] [Google Scholar]
- 25. Hirami Y, Osakada F, Takahashi K, et al. Generation of retinal cells from mouse and human induced pluripotent stem cells. Neurosci Lett. 2009;458:126–131 [DOI] [PubMed] [Google Scholar]
- 26. Osakada F, Jin ZB, Hirami Y, et al. In vitro differentiation of retinal cells from human pluripotent stem cells by small-molecule induction. J Cell Sci. 2009;122:3169–3179 [DOI] [PubMed] [Google Scholar]
- 27. MacLaren RE, Pearson RA, MacNeil A, et al. Retinal repair by transplantation of photoreceptor precursors. Nature. 2006;444:203–207 [DOI] [PubMed] [Google Scholar]
Associated Data
This section collects any data citations, data availability statements, or supplementary materials included in this article.


