Extraocular muscles display a complex pattern of myosin isoforms during postnatal development. The authors describe the developmental transitions for the distribution of nonmuscle myosin IIb, a novel component of the extraocular muscle sarcomere.
Abstract
Purpose.
To examine the distribution and timing of expression of nonmuscle myosin IIB (nmMyH IIB) and the extraocular muscle (EOM)-specific myosin (EO-MyHC) during postnatal development of the rat extraocular muscles.
Methods.
Whole orbits were collected from postnatal development day (P) 1 through P30 from Sprague-Dawley rats. Samples were analyzed by immunofluorescence microscopy and Western blot to examine the distribution and abundance of nmMyH IIB and EO-MyHC compared with other myosin isoforms and sarcomeric α-actinin. Polyclonal antibodies were produced to specifically detect EO-MyHC. Postnatal limb muscles were used as control.
Results.
Analysis of EOM morphology in the developing orbits indicates that the global and orbital layers are not evident until day P15. The distribution of nmMyH IIB changes between days P10 and P15 from a subsarcolemma distribution to an intrafiber distribution in the global layer. EO-MyHC appears by day p15, primarily in the orbital layer of the EOMs. Sarcomeric α-actinin was equally abundant in the EOMs at all stages. Fetal MyHC was the predominant isoform at day P1 but slowly diminished in abundance with age in a layer-specific manner.
Conclusions.
These data demonstrate that significant changes occur in the EOMs from P10 to P15 and suggest that visual stimulation may play a role in the signals that regulate both nmMyH IIB and EO-MyHC developmental transitions. The pronounced distinctions of the orbital and global layers occurring by P15 establish the adult morphologic phenotype of the muscle.
Extraocular muscles are responsible for all reflexive and voluntary eye movements. One of the defining characteristics of extraocular muscles (EOMs)is the wide array of myosin isoforms they express: adult EOMs contain at least 10 sarcomeric myosins, including an extraocular-muscle specific isoform (EO-MyHC).1–6 To add to this complexity, we recently demonstrated a unique sarcomeric A-band distribution for nonmuscle myosin IIB (nmMyH IIB, a nonsarcomeric myosin) in a subset of global layer fibers.7 nmMyH IIB is found in the same fibers that contain slow sarcomeric MyHC (“tonic” fibers) in adult EOMs.7
The complexities of the adult EOMs have been well documented.8 Less is known about the developmental transitions that lead to the formation of these muscles. This is partially because of the small muscle size, even in the adult, but also because their unique developmental pattern.9,10 Unlike somitic-derived skeletal muscles, EOMs originate from mesodermal primordia associated with the neural crest.9 In somitic-derived skeletal muscles, innervation plays a key role in developmental myosin isoform transitions.11,12 In the EOMs, visual stimulation is believed to play that role.13–16 Rats and mice open their eyes approximately 2 weeks after birth. The EOMs of dark-reared rats have less slow and EO-MyHC, and the expression of these myosins is delayed.17 Analysis of human EOM during gestation has failed to identify the onset of EO-MyHC expression, suggesting it also appears after birth.18 Recently, Zhou et al.19 examined myosin isoform transitions during postnatal development of mouse EOMs. In the mouse, EO-MyHC expression is not detected until postnatal development day (P) 15.19 This study also demonstrates that the complexities of myosin isoform transitions extend to both longitudinal and cross-sectional changes.
Our recent identification of nmMyH IIB as a component of the sarcomeric A band in the slow fibers of the global layers7 and the recent publication of developmental myosin transitions in the mouse EOM19 have led us to question how nmMyH IIB expression and distribution change during postnatal development in the EOMs. For this study, we examined the postnatal developmental transitions for nmMyH IIB and EO-MyHC relative to the distributions of fetal, slow, and fast MyHC isoforms and sarcomeric α-actinin in rat EOM. We found that the transition of nmMyH IIB from a subsarcolemmal position to an internal one to the fibers within the global layers and the onset of expression of EO-MyHC occur during the developmental period from P10 to P15. These changes coincide with the appearance of the global and orbital layers in the EOMs during postnatal development.
Materials and Methods
Animals and Tissue Collection
The Institutional Animal Care and Use Committee at the University of Kentucky approved this study. Adult timed-pregnant Sprague-Dawley rats (300–350 g) were purchased from Harlan (Indianapolis, IN), and time of delivery was monitored. Tissue was collected from pups at P1, P5, P10, P15, and P20 and from weaned littermates at P30. Adult control tissue was collected from the dams, and additional 45-day-old rats were purchased as a young adult group. The animals were euthanatized by CO2 asphyxia followed by pneumothorax. Whole orbits and triceps surae (leg) muscle samples were collected, placed in 2 M sucrose in phosphate-buffered saline (PBS) with 10 mM EDTA, and frozen in 2-methyl butane cooled to its freezing point by liquid nitrogen. Whole EOMs and leg muscle samples were also dissected and flash frozen in liquid nitrogen.
EO-MyHC Antibodies
Polyclonal rabbit antibodies were raised against synthetic peptides corresponding to residues 1840 to 1850 (nonhelical tailpiece) and to residues 1270 to 1280 (hinge) of mouse EO-MyHC (accession no. CAI25994; 100% identical with rat EO-MyHC and nonhomologous to other myosins) coupled through an N-terminal cysteine to keyhole limpet hemocyanin. Peptide synthesis, coupling, and antibody production were performed by ECM Biosciences (Lexington, KY).
Immunoblot Analysis
For this study, muscles from two adult rats per sample were pooled; for younger animals, we used muscles from eight, six, four, two, and two pups per sample for P5, P10, P20, P30, and P45, respectively. For the adult samples, EOMs, gastrocnemius, left ventricle, diaphragm, and laryngeal muscles were collected. For the younger animals, EOMs, gastrocnemius, left ventricle, and diaphragm were collected. Frozen muscles were pulverized under liquid nitrogen, and then approximately 100 mg was plunged into prewarmed SDS sample buffer (58 mM Tris-Cl, pH 6.8, 0.018% SDS, 5.0% glycerol, 100 mM DTT, 0.002% bromophenol blue) or 2% SDS, 10 mM Tris-Cl, pH 7.5. The protein concentration of samples extracted into the 2% SDS, 10 mM Tris-Cl was assayed using the bicinconic assay method (Thermo Scientific, Rockford, IL). For the developmental samples, the protein concentration was adjusted to 0.5 to 1.0 μg/μL, and a total of 10 μg/lane was loaded onto the gels. Muscle samples from adult animals were run on 10% polyacrylamide gels buffered with Tris-glycine and the developmental samples were run on 10% to 20% polyacrylamide gradient gels (Bio-Rad, Hercules, Ca). We used a semidry system to transfer proteins to either nitrocellulose or polyvinylidene difluoride (PVDF).20 Gel replicas for the adult muscle samples were probed with the anti-myosin antibodies, followed by secondary antibodies coupled to horseradish peroxidase and enhanced chemiluminescence detection (Kirkegaard and Perry, Gaithersburg, MD). For the developmental blots, membranes were blocked for 1 hour with a 1:1 dilution of blocking buffer (Odyssey; LI-COR Biosciences, Lincoln, NE) in PBS at room temperature. Membranes were then incubated using the same buffer containing 0.2% Tween and primary antibodies. After washing the membranes with PBS and 0.1% Tween, they were incubated with Alexa Fluor 680-conjugated goat anti-rabbit secondary antibody (1:7500; Invitrogen, Carlsbad, CA) and then washed again with PBS and 0.1% Tween. Membranes were finally rinsed with PBS and scanned using an infrared imaging system (Odyssey LI-COR Biosciences).
Immunofluorescence Microscopy
Ten-micrometer–thick orbital cross-sections were cut using a cryostat (Microm HM525; Thermo Scientific, Waltham, MA) and were collected on slides (Superfrost Plus; Fisher Scientific, Pittsburgh, PA). Whole orbits were sectioned completely through the block. Every 200 μm, a section was stained with hematoxylin to determine the position of the muscle within the blocks. Antibodies to nmMyH IIB were purchased from Sigma (1:500, product number 7939; St. Louis, MO), Covance (1:1000, catalog number PRB-445P; Trenton, NJ), and the Developmental Studies Hybridoma Bank (CMII-23; University of Iowa, Iowa City, IA). Myosin antibodies were also from the Developmental Studies Hybridoma Bank (fetal, F1.652; slow/fast2A, N2.261; adult slow, A4.951; adult slow, A4.840; and all myosin isoforms, MF20 and F59). All Developmental Studies Hybridoma Bank–concentrated supernatants were used at 1:100. Anti–α-actinin antibodies (sarcomeric: EA-53, 1:1000; nonmuscle: rabbit anti-α-actinin, A2543, 1:1000) and rhodamine-phalloidin were purchased from Sigma. Initial analysis of nmMyH IIB indicated that there was not longitudinal variability; thus, all postnatal sections analyzed were from the midbelly of the EOM, when possible, to avoid changes that resulted from positional changes in the proximal and distal ends for other myosin isoforms.
All antibodies were initially tested on adult orbits (not shown) and included nonmuscle myosins and nonmuscle α-actinin for the cytoskeletal proteins, two pan-sarcomeric myosin monoclonal antibodies (F59 and MF20), and an anti-sarcomeric α-actinin monoclonal antibody (EA-53).
Immunolabeling was performed as described previously.21 Briefly, cryostat sections were treated with 1% Triton X-100 in PBS for 15 minutes at 4°C, washed, and then blocked in 1% normal goat serum in PBS for 1 hour at 4°C. Primary antibodies were diluted in the blocking solution, and all incubations were performed at 4°C. After the sections were washed, secondary antibodies diluted in blocking solution were applied. Secondary antibodies were purchased from Jackson ImmunoResearch (West Grove, PA), and all were minimal cross-reacting antibodies, absorbed against both mouse and rat serum proteins. After the samples were washed, mounting media (SloFade Gold; Molecular Probes, Invitrogen, Carlsbad, CA) was applied to the sections, and coverslips were sealed with nail polish. Samples were visualized on an inverted microscope (Axiovert 200M; Zeiss, Thornwood, NY) equipped with a high-resolution digital camera (Orca ER; Hamamatsu, Hamamatsu, Japan).
Statistical Analysis
Image collection and fiber counts were performed (OpenLab; Perkin Elmer, Waltham, MA). Fibers were scored as positive when they contained a myosin isoform specific to the probe or negative when not. The percentage of positive fibers was calculated as the positives divided by the total number of fibers in the field. All statistical analyses were performed using graphing and data analysis software (KaleidaGraph; Synergy Software, Reading, PA). All statistical analyses are reported as the mean ± SEM.
Results
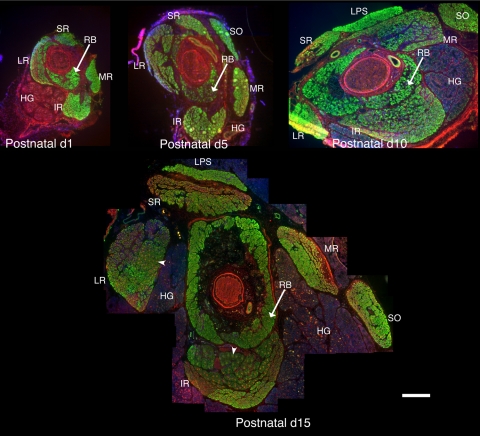
To examine the overall morphology of the developing rat EOMs, we labeled sections from ages P1 to P30 with antibodies to cytoskeletal proteins to visualize the muscles, Harderian gland, and nerves and with antibodies that recognize sarcomeric proteins in the EOMs (Fig. 1). Figure 1 shows the distribution of nmMyH IIB and sarcomeric α-actinin. At P1, sarcomeric α-actinin (Fig. 1, all stages, green) was abundant within the rectus and oblique muscles and the retractor bulbi, an accessory EOM. All the fibers at this stage were similar in diameter, and there was not an obvious distinction between the global and the orbital layers of the EOMs. The optic nerve, blood vessels, and Harderian gland were labeled by the nmMyH IIB antibody (Fig. 1, all stages, red). This antibody also marked the peripheral edge of the α-actinin fibers in both the EOMs and the retractor bulbi. At P1, the Harderian gland was small compared with the volume of the muscles in the developing orbit. By P10, extraocular and retractor muscle fiber size increased, as did the volume of the Harderian gland. During this period, nmMyH IIB remained on the periphery of the extraocular and retractor muscle fibers. By P15, the global and orbital layers became apparent, EOM fiber sizes increased further, and the Harderian gland grew greatly. At this time, nmMyH IIB relocalized to an intrafiber distribution in a subset of global layer fibers (Fig. 1, arrowheads). This change in distribution for nmMyH IIB was documented with three antibodies (polyclonal antisera against nmMyH IIB; Sigma; Fig. 1).22
Figure 1.
Organization of the EOMs in postnatal developing orbits. Cryostat sections from the midbelly of developing orbits were stained with antibodies to sarcomeric α-actinin (green) and nmMyH IIB (red), and DAPI was used to stain the nuclei (blue). The major changes that occurred from P1 to P10 were an increase in the cross-sectional area of the Harderian gland and an increase in fiber size throughout the EOMs. Between P10 and P15, the distinction between the global and the orbital layers became pronounced, with obvious differences in the fiber size between the two layers and a distinct separation between the layers. Arrowheads in the P15 orbit indicate the fibers exhibiting the sarcomeric distribution of nmMyH IIB. RB, retractor bulbi; MR, medial rectus; LR, lateral rectus; SR, superior rectus, IR, inferior rectus; LPS, levator palpebrae superior; HG, Harderian gland. Scale bar, 500 μm.
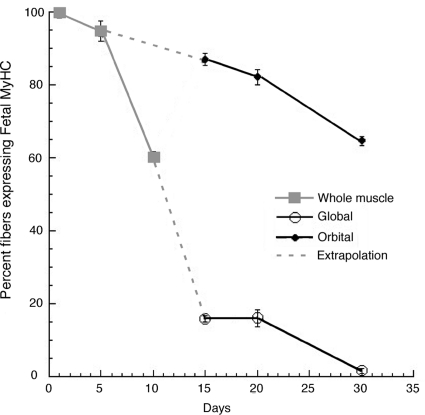
The major sarcomeric myosin isoform expressed in the developing EOMs at P1 to P5 was the fast fetal isoform, which decreased in abundance over time and became restricted to the orbital layer by P30 (Fig. 2). The other fast isoforms were weakly present in fibers at P1 and P5 and increased in abundance at later time points. The percentages of fibers expressing the fetal myosin isoform was dramatically reduced from the global layer from P10 to P15 but was still present in the orbital layer (Fig. 2). At P30, fetal myosin was found in 64% ± 1.3% of the orbital fibers and in only 1.5% ± 0.6% of the global fibers. The last fibers to express fetal myosin in the global layer were the large central fibers of the rosettes (see also Fig. 7).
Figure 2.
Distribution of fetal MyHC. The distribution of the fetal isoform of sarcomeric myosin was monitored with F1.652, and the total number of fibers was monitored by staining with phalloidin. The fibers were scored as either negative or positive for expression of the fetal isoform and were expressed as the percentage of the total number of fibers. P1 to P10 counts were taken over whole EOMs (gray solid lines). At P1 and P5, all the fibers expressed the fetal isoform. Between P5 and P10, the number of fetal fibers began to diminish. As the distinction between the layers became evident between P10 and 15, P15 to P30 counts were scored for the individual layers (black solid lines); the extrapolated trajectory for the distribution in each layer is shown in with gray dashed lines. There was a dramatic drop in the number of positive fibers in the global layer between P10 and P15, whereas the percentage of fetal isoform positive fibers in the orbital layer remained high. By P30, the expression of the fetal isoform became restricted to the orbital layer.
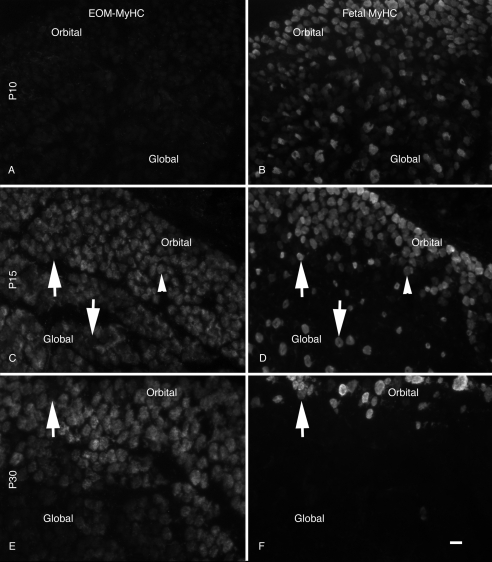
Figure 7.
Distribution of EO-MyHC versus fetal MyHC. Developing orbit sections were stained for the distribution of EO-MyHC (A, C, E) and counterstained with Ab to the fetal MyHC (B, D, F). All samples were from the midbellies of the muscles. At P10 (A, B), a weak signal was observed throughout the EOMs, and fetal MyHC was found in numerous fibers of varying intensities throughout the muscles. At P15 (C, D), there was a dramatic increase in the staining intensity for EOM-specific MyHC throughout both the orbital and the global layers and a significant decrease in the fetal fibers within the global layers. Many of the fetal isoform-positive fibers in the global layer were negative for EOM specific MyHC (arrows). Arrowheads: fibers in the orbital layer that were weakly positive for both proteins. By P30 (E, F), fetal MyHC was absent from the global layers, and the EOM-specific MyHC was spread throughout both EOMs. Arrows: fiber positive for EOM-specific MyHC and negative for the fetal isoform. (E, F) Section from the posterior portion of the muscle exhibiting a lower level of staining in the global layer. Scale bar, 10 μm.
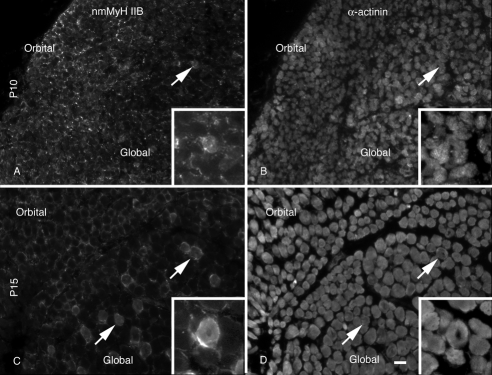
The adult global layer is described as having a series of rosette fibers, with a large central fiber surrounded by smaller fibers.22 This fiber organization was not present until P15. The large fibers, central to the rosettes, were also associated with nmMyH IIB distribution. Higher magnification images of the tissues shown in Figure 1 demonstrate the redistribution of nmMyH IIB (Fig. 3). At P10 (Figs. 3A, 3B), nmMyH IIB was found predominantly at the periphery of fibers in both the orbital and the global layers (Fig. 3A). This antibody also stained the nerves and blood vessels found with the muscle. At this time, <1% of EOM fibers (N = 6052) exhibited an intrafiber distribution (Fig. 3A, arrows; Figs. 3A, 3B, insets). By P15 (Figs. 3C, 3D, insets), 20% of global layer fibers had nmMyH IIB internally—the same fraction as was found in the adult EOMs7 (Fig. 3C, arrows), whereas the distribution of nmMyH IIB remained at the peripheral edges of all the fibers in the orbital layer.
Figure 3.
Distribution of nmMyH IIB versus α-actinin. Cryostat sections from the midbelly of the developing orbits were stained with antibodies to nmMyH IIB (A, C) and α-actinin (B, D). At P10, the majority of nmMyH IIB was found at the peripheral edge of the fibers. A small percentage of the fibers exhibited an internal distribution (note arrows and insets in A and B). By P15 (C, D), the intrafiber staining for nmMyH IIB became pronounced in the global layers of the EOMs (note arrows and insets). Insets in all panels display higher magnification images of fibers displaying the sarcomeric distribution of nmMyH IIB. Scale bars, 10 μm (A–D); 5 μm (insets).
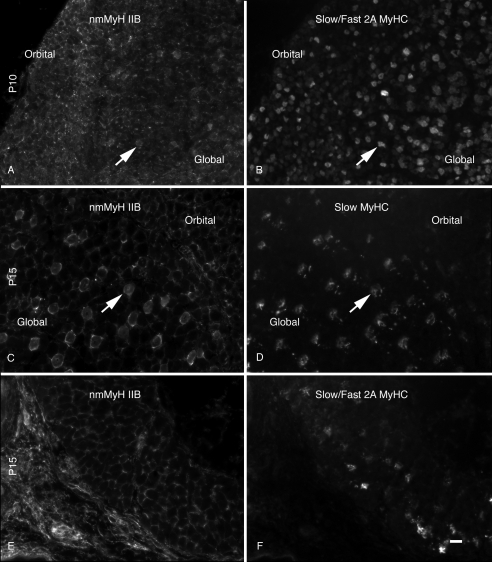
The change in nmMyH IIB distribution correlates with fibers containing slow sarcomeric MyHC within the centers of the rosettes in the global layer (Fig. 4). Slow sarcomeric myosin fibers were present in both the orbital and global layers from P15. At P10, slow myosin is detected in the EOMs using antibodies specific for it (Fig. 4B, A4.951) or that detect both the slow and fast 2A isoforms (not shown). Comparison of the distribution of nmMyH IIB with slow myosin at P10 (Figs. 4A, 4B, arrows) demonstrates the presence of nmMyH IIB within 5% ± 1.2% of the fibers also expressing slow sarcomeric myosin. By P15, all the global layer fibers containing slow myosin are also positive for sarcomeric nmMyH IIB (Figs. 4C, 4D, arrows). These fibers represent 18% ± 2.1% of all global layer fibers. In contrast, the retractor bulbi fibers do not have internal nmMyH IIB at any time during development (Figs. 4E, 4F, P15) or in the adult (not shown).
Figure 4.
Distribution of nmMyH IIB versus slow sarcomeric MyHC. Sections from the midbellies of developing orbits were stained for the distribution of nmMyH IIB (A, C, E) and counterstained for the distribution of slow MyHC (B, D) or slow/fast 2A MyHC (F). At P10 (A, B), the majority of the nmMyH IIB staining occurred at the peripheral edges of the fibers, but a few fibers exhibited intrafiber staining in the global layer that colocalized with fibers positive for the slow isoform (note arrows). At P15 (C, D), all the fibers that stained positive for the slow MyHC isoform in the global layer showed a distinct intrafiber staining pattern for nmMyH IIB (arrows). In contrast, the retractor bulbi at the same stage (E, F) did not exhibit the intrafiber distribution for nmMyH IIB despite the presence of slow/fast 2A-positive fibers. Scale bar, 10 μm.
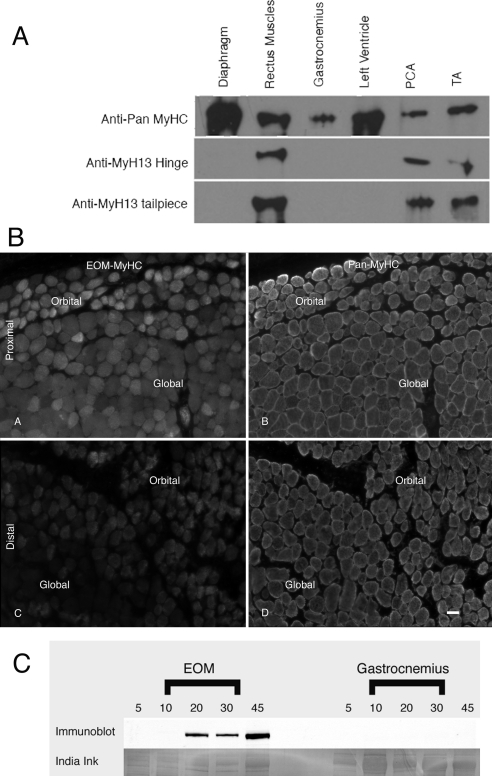
To evaluate the appearance of EO-MyHC, we developed two polyclonal antisera against peptides derived from unique sequences within the EO-MyHC primary structure. One serum was raised against the hinge region (aa 1270–1280) and the other against the nonhelical tailpiece (aa 1840–1850). By Western blot analysis, both antisera identify a myosin in the EOMs but not in the diaphragm, gastrocnemius, or heart (left ventricle) of adult rats (Fig. 5A). Given that the rabbit thyroarytenoid muscles23 are known to express EO-MyHC, we used the laryngeal muscles from adult rats as an added measure of reactivity. To further evaluate the specificity of the reagents, immunofluorescence analysis was performed using both the anti-hinge and the anti-tailpiece antisera on adult EOMs (Fig. 5B), gastrocnemius, and diaphragm (not shown). The anti-hinge antiserum displayed significant fluorescence within the medial sections of the adult orbit (Figs. 5BA, 5BB) with a diminishing signal in the distal portion of the orbit (Figs. 5BC, 5BD). In the adult rat orbit, the anti-hinge antiserum stained both the global and the orbital layers in the midbelly of the EOMs, with a noticeable decrease in the global layers toward the distal end of the muscle. There was no observable signal in the retractor bulbi, gastrocnemius, or diaphragm using the same settings for exposure as in the EOMs (not shown). The anti-tail piece antiserum did not work in this assay (not shown).
Figure 5.
Characterization of antisera for EO-MyHC. Polyclonal antibodies were raised against synthetic peptides corresponding to the hinge region and the nonhelical tailpiece of myh13. (A) To test the specificity of these antisera, immunoblot analysis was performed. Extracts from diaphragm, extraocular, gastrocnemius, left ventricle, posterior cricoarytenoid (PCA), and thyroarytenoid (TA) muscles were separated by SDS-PAGE and transferred to nitrocellulose. The blots were probed with a pan-myosin Ab (F59) or the anti-hinge or tailpiece antisera. The pan myosin Ab recognizes a myosin band in each sample. The anti-hinge and anti-tailpiece antisera only recognize a myosin band in the EOMs and the laryngeal muscles (PCA and TA). (B) Distribution of EO- MyHC in the adult orbit. Cryostat sections of adult orbits were stained with both the anti-hinge (A, C) and the anti-tailpiece antisera and were counterstained with a pan-MyHC Ab, MF20 (B, D). The EOM-specific MyHC was detected in the proximal and midbelly sections of the adult orbits in both the global and the orbital layers using the anti-hinge antisera. The distal portion of the muscles exhibited much weaker staining with the anti-hinge antisera, with the global layer yielding the weakest staining. The anti-tailpiece antisera did not stain the orbits. In the distal portion of the EOM, the orbital layer was slightly oblique. Scale bar, 10 μm. (C) To examine the developmental expression of EO- MyHC, EOMs and somitic skeletal muscles were collected at P5, P10, P20, P30, and P45. Extracts were separated on gels (10 μg total protein per lane) and transferred to PVDF. The blots were probed with the anti-hinge antiserum. EOM-specific myosin was not detected until P20 and increased in abundance through the time course analyzed. The anti-hinge antisera did not detect anything in the control tissues. Extracts from gastrocnemius are shown. After probing with the antisera, the same blot was stained with India ink, demonstrating the presence of a myosin band in all lanes.
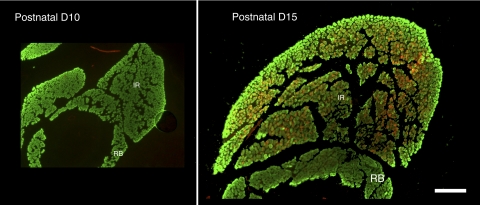
Using either antiserum as probes for immunoblots, we demonstrated EO-MyHC in EOMs at P20, P30, and P45 but not at P5 or P10 (Fig. 5C). These antisera did not crossreact with any postnatal skeletal muscle or heart tested by Western blot (Fig. 5C, gastrocnemius). Using the anti-hinge antiserum, we counterstained the tissues for the distribution of EO-MyHC versus a pan-myosin stain (MF20) in postnatal muscles (Fig. 6). EO-MyHC is not detected at P10 (Fig. 6) or before (not shown). By P15, EO-MyHC was observed in EOM fibers (Fig. 6, inferior rectus is shown) but not in retractor bulbi or levator palpebrae superioris (Fig. 6). The signal for EO-MyHC was strongest in the orbital layer and the adjacent portion of the global layer at P15.
Figure 6.
Distribution of EO- MyHC. Cryostat sections from the midbelly of the muscles of developing orbits were stained for the distribution of EOM-specific MyHC (red) and total sarcomeric myosin (green). EOM-specific MyHC was not detected until P15. At this time it was present in all the EOMs. The retractor bulbi was negative throughout the time course. RB, retractor bulbi; IR, inferior rectus. Scale bar, 500 μm.
The distribution of EO-MyHC was compared to fetal myosin as a function of post-natal development (Fig. 7). Higher magnification images demonstrate a weak signal for EO-MyHC at P10 throughout both layers (Fig. 7A). At P15, orbital layer fibers containing fetal myosin were also weakly positive for EO-MyHC. That was not the case for fetal myosin-positive fibers in the global layer (Figs. 7C, 7D, arrows). In a more mature EOM (Figs. 7E, 7F, P30), fetal myosin is restricted to the orbital layer and EO-MyHC is not abundant in many of these fibers (Figs. 7E, 7F, arrows).
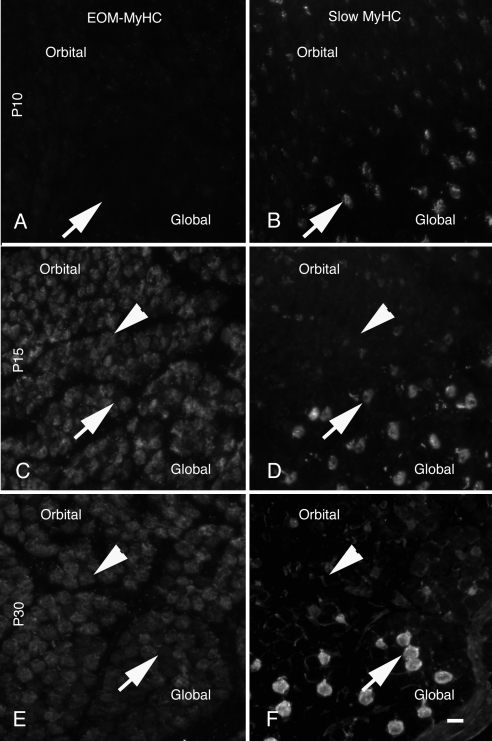
To examine whether the presence of EO-MyHC correlates with the distribution of slow sarcomeric myosin (Fig. 8), we probed the developmental time course with the anti-hinge EO-MyHC antiserum and counterstained with antibodies to either adult slow myosin (A4.951 and A4.840) or adult slow/fast 2A (N2.261). The staining shown in Figure 8 is with A4.951, and identical results were obtained with A4.840 (not shown). Although EO-MyHC and the slow myosin increase from P10 through P15, they do not colocalize at P15 (Figs. 8C, 8D) or more mature animals (Figs. 8E, 8F; note arrows in Figs 8C–F).
Figure 8.
Distribution of EO-MyHC versus slow MyHC. Cryostat sections of orbits were stained with the anti-EO-MyHC antisera (A, C, E) and counterstained for anti-slow sarcomeric MyHC Ab (B, D, F). All sections were from the midbellies of the muscles. At P10 (A, B), the EOMs were weakly positive with both Abs. By p15 (C, D), there was a marked increase in intensity for both EO-MyHC and the slow sarcomeric MyHC. This increase in abundance continued through P30 (E, F). At all time points, the distributions of EOM-specific MyHC and slow sarcomeric MyHC did not overlap. Arrows: positions of fibers positive for slow sarcomeric MyHC; arrowheads: positions of EOM-specific, MyHC-positive fibers. Scale bar, 10 μm.
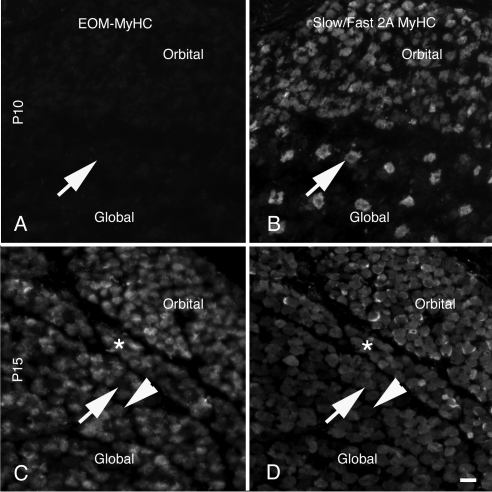
The antibody for the adult slow/fast 2A isoforms reacts with more fibers than the antibody that specifically detects the slow myosin, consistent with its recognition of two different isoforms (Fig. 9). The anti-hinge antiserum recognizes 51% ± 3.1% of the fibers positive for the slow/fast2A isoforms (Figs. 9C, 9D, asterisk). At P15, there are fibers that are positive for the slow/fast 2A antibody, that are negative for EO-MyHC (Figs. 9C, 9D, arrows). In addition, the EO-MyHC antiserum recognizes additional fibers (Figs. 9C, 9D, arrowheads) that presumably contain other fast isoforms.
Figure 9.
Distribution of EO-MyHC versus slow/fast 2A MyHC. Section obtained from the midbellies of the EOMs were stained with the anti-hinge antisera (A, C) and counterstained for the distribution of the slow/fast 2A fibers using monoclonal antibody N2.261 (B, D). At P10 (A, B), the muscles were weakly positive for EO-MyHC, and numerous slow/fast 2A fibers were present. (A–D, arrows) Fibers positive for the slow/fast 2A isoform and negative for EO-MyHC. At P15, there was an increase in the number of fibers expressing EO-MyHC and a variety of fiber types including EO-MyHC and slow/fast 2A positive (a cluster of these fibers is marked by asterisks in C and D). Fibers that positive only for the slow/fast 2A isoform (C, D, arrows) and positive only for EO-MyHC (C, D, arrowheads). Scale bar, 10 μm.
Discussion
Here we demonstrate four events in rat EOMs during 10 to 15 days of postnatal development: the appearance of the orbital and global layers, the loss of fetal myosin in the global layer, the redistribution of nmMyH IIB in a subset of global layer fibers, and the appearance of the EO-MyHC. Rats open their eyes 10 to 15 days after birth. The visual system for felines is immature at birth and requires sensory input for the maturation of both its sensory and its motor components to achieve the adult phenotype.13,14 15 The same may be true for the EOMs. Brueckner et al.17 have demonstrated that rats raised in total darkness from birth have reduced levels of slow sarcomeric myosin and EO-MyHC. The four events presented here occur during this same period, suggesting that each may play an important role in establishing the adult EOM phenotype. These myosin isoform transitions in the first few weeks of postnatal life seem to be more generalized. In the mouse, EO-MyHC expression is not detected until P15.19 Rossi et al.6 recently identified two ancient sarcomeric myosins, MyH14/7b and MyH15, in the EOMs. MyH14/7b follows the same pattern of fetal MyHC that we describe here. It is present throughout the EOMs early after birth and decreases over the next few days. On the other hand, MyH15 does not appear in orbital layer fibers until P7, when it is weakly present and increases in abundance by P14.6
The division of EOMs into two layers, global and orbital, is a morphologic landmark with important functional consequences.8,24–27 Our study demonstrates that the layers cannot be distinguished until P15 (Fig. 1). The seemingly immature nature of the orbital layer is marked by the small fiber size and the presence of the fetal myosin as its expression is maintained through adulthood. The global layer displays a dramatic loss of fetal myosin-containing fibers between P10 and P15; its expression becomes restricted to the large central fibers of the rosettes until it is lost from the global layers by P30. The retention of the fetal isoform in the fibers containing both slow myosin and nmMyH IIB suggests that these fibers have a more complex developmental regimen than other global layer fibers. Electron microscopy studies of the developing rat EOMs demonstrated that the fiber diameter difference between the orbital and the global layers is not present until P14.28
It is possible that the increase in intra-fascicle space between the layers is caused by changes in the extracellular matrix components that may cue myosin isoform transitions. Extracellular matrix transitions serve this role in somitic-derived skeletal muscle.29,30 Extraocular muscle cell lines differentiate better and mature more quickly when they are cocultured with orbital fibroblasts, as opposed to fibroblasts obtained from somitic-derived skeletal muscles, indicating that there are EOM-specific extracellular signals important for appropriate differentiation and growth.31
nmMyH IIB is found within the bare zone of the thick filaments expressing slow myosin isoforms in the global layer of the EOMs7 and in the large central fibers of the rosette in the global layer, the putative tonic fibers. Slow myosin is present in some orbital layer and retractor bulbi fibers during development; however, sarcomeric nmMyH IIB was never observed in these fibers during development. The presence of nmMyH IIB within the thick filaments of the slow fibers is anticipated to create a drag in the system.32 Because nmMyH IIB is capable of producing the highest amount of tension of the nonmuscle myosin isoforms,33 it has been suggested to play a role in smooth muscle tonic contraction.34–36 Light deprivation leads to a maladaption of the feline eye's ability to fixate,15 a function that has been predominantly linked to slow tonic fibers of the EOMs.8 Our current data, in which nmMyH IIB undergoes a major relocation to an internal fiber distribution within the developing slow fibers between P10 and P15, suggest that this distribution may be important for the development of the physiological functions of the tonic fibers.
Our findings on the timing of appearance and distribution of EO-MyHC are in agreement with a recent study on mice.19 The EO-MyHC appears during P10 and P15 throughout the orbital and global layers. This is in contrast with a report showing that EO-MyHC is restricted to the orbital layer.37 Earlier studies used in situ hybridization and found EO-MyHC predominantly in the orbital layer first and then in both layers1.16,17 This discrepancy was compounded when Lucas et al.23 and Lucas and Hoh37 used immunohistochemistry to demonstrate that EO-MyHC was restricted to the orbital layer in rats and the global layer in rabbits. We used the same monoclonal antibody as Lucas and Hoh37 and were unable to detect a signal in the rat EOMs at any time during development (not shown). These inconsistencies may be purely methodological or may reflect the allotype- or strain-specific differences used in these studies; however, analysis of human fetal EOMs failed to detect EO-MyHC during gestation,18 suggesting that, as in rodents, the onset of expression of this isoform in humans associates with postnatal visual experience.
In summary, we have identified four unique transitions in the postnatal development of the rat EOM: increase in fiber size, development of an inter-fascicle space between the global and the orbital layers, changes in the distribution of nmMyH IIB from an extra-fiber to an intra-fiber distribution, and appearance of EO-MyHC. We propose that each of these events plays a significant role in the development of EOMs.
Acknowledgments
The authors thank the members of the Center for Muscle Biology at the University of Kentucky for their insightful comments.
Footnotes
Supported by National Eye Institute Grants R21 EY018112 (CLM) and R01 EY012998 (FHA).
Disclosure: C.L. Moncman, None; M.E. Andrade, None; F.H. Andrade, None
References
- 1. Brueckner JK, Itkis O, Porter JD. Spatial and temporal patterns of myosin heavy chain expression in developing rat extraocular muscle. J Muscle Res Cell Motil. 1996;17:297–312 [DOI] [PubMed] [Google Scholar]
- 2. McLoon LK, Rios L, Wirtschafter JD. Complex three-dimensional patterns of myosin isoform expression: differences between and within specific extraocular muscles. J Muscle Res Cell Motil. 1999;20:771–783 [DOI] [PubMed] [Google Scholar]
- 3. Rubinstein NA, Hoh JF. The distribution of myosin heavy chain isoforms among rat extraocular muscle fiber types. Invest Ophthalmol Vis Sci. 2000;41:3391–3398 [PubMed] [Google Scholar]
- 4. Lucas CA, Hoh JF. Distribution of developmental myosin heavy chains in adult rabbit extraocular muscle: identification of a novel embryonic isoform absent in fetal limb. Invest Ophthalmol Vis Sci. 2003;44:2450–2456 [DOI] [PubMed] [Google Scholar]
- 5. Rubinstein NA, Porter JD, Hoh JF. The development of longitudinal variation of myosin isoforms in the orbital fibers of extraocular muscles of rats. Invest Ophthalmol Vis Sci. 2004;45:3067–3072 [DOI] [PubMed] [Google Scholar]
- 6. Rossi AC, Mammucari C, Argentini C, Reggiani C, Schiaffino S. Two novel/ancient myosins in mammalian skeletal muscles: MYH14/7b and MYH15 are expressed in extraocular muscles and muscle spindles. J Physiol. 2010;588:353–364 [DOI] [PMC free article] [PubMed] [Google Scholar]
- 7. Moncman CL, Andrade FH. Nonmuscle myosin IIB, a sarcomeric component in the extraocular muscles. Exp Cell Res. 2010;316:1958–1965 [DOI] [PMC free article] [PubMed] [Google Scholar]
- 8. Spencer RF, Porter JD. Biological organization of the extraocular muscles. Prog Brain Res. 2006;151:43–80 [DOI] [PubMed] [Google Scholar]
- 9. Evans DJ, Noden DM. Spatial relations between avian craniofacial neural crest and paraxial mesoderm cells. Dev Dyn. 2006;235:1310–1325 [DOI] [PubMed] [Google Scholar]
- 10. Noden DM, Francis-West P. The differentiation and morphogenesis of craniofacial muscles. Dev Dyn. 2006;235:1194–1218 [DOI] [PubMed] [Google Scholar]
- 11. Lefeuvre B, Crossin F, Fontaine-Perus J, Bandman E, Gardahaut MF. Innervation regulates myosin heavy chain isoform expression in developing skeletal muscle fibers. Mech Dev. 1996;58:115–127 [DOI] [PubMed] [Google Scholar]
- 12. Briggs MM, Schachat F. The superfast extraocular myosin (MYH13) is localized to the innervation zone in both the global and orbital layers of rabbit extraocular muscle. J Exp Biol. 2002;205:3133–3142 [DOI] [PubMed] [Google Scholar]
- 13. Wiesel TN, Hubel DH. Effects of visual deprivation on morphology and physiology of cells in the cats lateral geniculate body. J Neurophysiol. 1963;26:978–993 [DOI] [PubMed] [Google Scholar]
- 14. Wiesel TN, Hubel DH. Single-cell responses in striate cortex of kittens deprived of vision in one eye. J Neurophysiol. 1963;26:1003–1017 [DOI] [PubMed] [Google Scholar]
- 15. Cynader M. Interocular alignment following visual deprivation in the cat. Invest Ophthalmol Vis Sci. 1979;18:726–741 [PubMed] [Google Scholar]
- 16. Brueckner JK, Ashby LP, Prichard JR, Porter JD. Vestibulo-ocular pathways modulate extraocular muscle myosin expression patterns. Cell Tissue Res. 1999;295:477–484 [DOI] [PubMed] [Google Scholar]
- 17. Brueckner JK, Porter JD. Visual system maldevelopment disrupts extraocular muscle-specific myosin expression. J Appl Physiol. 1998;85:584–592 [DOI] [PubMed] [Google Scholar]
- 18. Pedrosa-Domellof F, Holmgren Y, Lucas CA, Hoh JF, Thornell LE. Human extraocular muscles: unique pattern of myosin heavy chain expression during myotube formation. Invest Ophthalmol Vis Sci. 2000;41:1608–1616 [PubMed] [Google Scholar]
- 19. Zhou Y, Liu D, Kaminski HJ. Myosin heavy chain expression in mouse extraocular muscle: more complex than expected. Invest Ophthalmol Vis Sci. 2010;51:6355–6363 [DOI] [PMC free article] [PubMed] [Google Scholar]
- 20. Kyhse-Anderson J. Electoblotting of multiple gels: a simple apparatus without buffer tank for rapid transfer of proteins from polyacrylamide to nitrocellulose. J Biochem Biophys Methods. 1984;10:203–209 [DOI] [PubMed] [Google Scholar]
- 21. Moncman CL, Wang K. Nebulette: a 107 kD nebulin-like protein in cardiac muscle. Cell Motility Cytoskeleton. 1995;32:205–225 [DOI] [PubMed] [Google Scholar]
- 22. Kranjc BS, Sketelj J, Albis AD, Ambroz M, Erzen I. Fibre types and myosin heavy chain expression in the ocular medial rectus muscle of the adult rat. J Muscle Res Cell Motil. 2000;21:753–761 [DOI] [PubMed] [Google Scholar]
- 23. Lucas CA, Rughani A, Hoh JF. Expression of extraocular myosin heavy chain in rabbit laryngeal muscle. J Muscle Res Cell Motil. 1995;16:368–378 [DOI] [PubMed] [Google Scholar]
- 24. Porter JD, Poukens V, Baker RS, Demer JL. Structure-function correlations in the human medial rectus extraocular muscle pulleys. Invest Ophthalmol Vis Sci. 1996;37:468–472 [PubMed] [Google Scholar]
- 25. Demer JL, Oh SY, Clark RA, Poukens V. Evidence for a pulley of the inferior oblique muscle. Invest Ophthalmol Vis Sci. 2003;44:3856–3865 [DOI] [PubMed] [Google Scholar]
- 26. Khanna S, Cheng G, Gong B, Mustari MJ, Porter JD. Genome-wide transcriptional profiles are consistent with functional specialization of the extraocular muscle layers. Invest Ophthalmol Vis Sci. 2004;45:3055–3066 [DOI] [PubMed] [Google Scholar]
- 27. Demer JL. Evidence supporting extraocular muscle pulleys: refuting the platygean view of extraocular muscle mechanics. J Pediatr Ophthalmol Strabismus. 2006;43:296–305 [DOI] [PMC free article] [PubMed] [Google Scholar]
- 28. Nag AC, Cheng M. Differentiation of fibre types in an extraocular muscle of the rat. J Embryol Exp Morphol. 1982;71:171–191 [PubMed] [Google Scholar]
- 29. Gullberg D, Sjoberg G, Velling T, Sejersen T. Analysis of fibronectin and vitronectin receptors on human fetal skeletal muscle cells upon differentiation. Exp Cell Res. 1995;220:112–123 [DOI] [PubMed] [Google Scholar]
- 30. Gullberg D, Tiger CF, Velling T. Laminins during muscle development and in muscular dystrophies. Cell Mol Life Sci. 1999;56:442–460 [DOI] [PMC free article] [PubMed] [Google Scholar]
- 31. Kusner LL, Young A, Tjoe S, Leahy P, Kaminski HJ. Perimysial fibroblasts of extraocular muscle, as unique as the muscle fibers. Invest Ophthalmol Vis Sci. 2010;51:192–200 [DOI] [PMC free article] [PubMed] [Google Scholar]
- 32. Cuda G, Pate E, Cooke R, Sellers JR. In vitro actin filament sliding velocities produced by mixtures of different types of myosin. Biophys J. 1997;72:1767–1779 [DOI] [PMC free article] [PubMed] [Google Scholar]
- 33. Wang F, Kovacs M, Hu A, Limouze J, Harvey EV, Sellers JR. Kinetic mechanism of non-muscle myosin IIB: functional adaptations for tension generation and maintenance. J Biol Chem. 2003;278:27439–27448 [DOI] [PubMed] [Google Scholar]
- 34. Morano I, Chai GX, Baltas LG, et al. Smooth-muscle contraction without smooth-muscle myosin. Nat Cell Biol. 2000;2:371–375 [DOI] [PubMed] [Google Scholar]
- 35. Ogut O, Yuen SL, Brozovich FV. Regulation of the smooth muscle contractile phenotype by nonmuscle myosin. J Muscle Res Cell Motil. 2007;28:409–414 [DOI] [PubMed] [Google Scholar]
- 36. Yuen SL, Ogut O, Brozovich FV. Nonmuscle myosin is regulated during smooth muscle contraction. Am J Physiol Heart Circ Physiol. 2009;297:H191–H199 [DOI] [PMC free article] [PubMed] [Google Scholar]
- 37. Lucas CA, Hoh JF. Extraocular fast myosin heavy chain expression in the levator palpebrae and retractor bulbi muscles. Invest Ophthalmol Vis Sci. 1997;38:2817–2825 [PubMed] [Google Scholar]


