The authors used two-photon microscopy to image structures of the conventional aqueous humor outflow pathway in an intact mouse eye. This imaging method may be useful for following the progress of animal models of glaucoma in a noninvasive manner.
Abstract
Purpose.
To image the conventional aqueous outflow pathway and adjacent structures within the intact enucleated mouse eye using a noninvasive microscopy technique.
Methods.
Two-photon microscopy (2PM) techniques, including two-photon autofluorescence (2PAF) and second harmonic generation (SHG), were used to obtain images of the trabecular meshwork (TM) region within an intact mouse eye. Cardiac perfusion of fluorescein-conjugated dextran was used to label blood vessels within the eye to serve as an anatomic reference. Eyes were subsequently fixed, paraffin embedded, sectioned, and stained for comparison to the 2PM images.
Results.
Three-dimensional analyses of multiple 2PM images revealed a well-defined region adjacent to the iris and cornea that is free of SHG signal and consistent with the location of Schlemm's canal. This open region is continuous with smaller tube structures consistent with collector channels. These structures do not label in mice perfused with the vascular probe dextran, supporting the hypothesis that the enclosed spaces are filled with aqueous humor rather than circulating blood. The TM region in the mouse eye was also visible, with a clear SHG signal representing collagen fibers.
Conclusions.
These results support the hypothesis that 2PM may be useful for noninvasively imaging the conventional aqueous outflow pathway in mouse models of glaucoma. Studies are ongoing to validate our methodology in live animals.
Glaucoma is a heterogeneous group of diseases that, as a group, is the second leading cause of blindness worldwide.1,2 Current diagnostic techniques for glaucoma, such as visual field testing and retinal nerve fiber layer measurements, lack disease specificity and provide little additional information beyond that of the common funduscopic examination. Currently, high intraocular pressure (IOP) is the only modifiable risk factor for glaucoma, although it is well known that many patients with glaucoma do not have elevated IOP.3 Furthermore, methods for measuring IOP are predisposed to inaccuracies because of operator error, corneal biomechanical differences, and other poorly understood variables.4 Finally, the measurement of IOP is merely a surrogate metric for the health state of the outflow system of the eye, and more direct structural and functional assessments of aqueous outflow would be desirable.
It is believed that structural abnormalities in the aqueous outflow pathway, especially in the juxtacanalicular trabecular meshwork (TM), the inner wall of Schlemm's canal (SC), or both, may lead to elevated IOP and the development of glaucoma.5 Visualizing the TM region at high resolution would be of potential diagnostic value for the early detection of glaucoma and for following its progression in patients. Although currently available clinical imaging technologies such as optical coherence tomography (OCT) and ultrasound biomicroscopy (UBM) can image SC,6,7 they are unable to achieve high enough resolution to be of clinical value in most forms of glaucoma such as primary open angle glaucoma.
Two-photon microscopy (2PM) is a nonlinear imaging technology with subcellular resolution capabilities that has been previously used to image ocular tissues without the need for fixation.8–11 2PM involves two infrared photons interacting simultaneously with a target molecule. When 2PM is used to excite endogenous fluorophores it is called two-photon excitation autofluorescence (2PAF), and it is similar to traditional confocal fluorescence microscopy except that fluorescence excitation results from the absorption of two photons instead of one. 2PM can also be used to image by a process called second harmonic generation (SHG). SHG occurs when non-centrosymmetric macromolecular structures (principally collagen) simultaneously “scatter” instead of absorb the two infrared photons. This scattered energy resolves as a single higher energy (blue) photon of exactly half the excitation wavelength. The use of 2PM is significantly different in several ways from conventional microscopy (see Refs. 9, 12 for reviews). The excitation source is a high-intensity near-infrared laser with extremely short pulse duration (10−15 seconds). The near-infrared photons have greater tissue penetration than the higher energy photons used in confocal microscopy. The two-photon interaction occurs only where the objective focuses the laser, offering resolution similar in many ways to that of confocal microscopy. However, the duration of the 2PM laser pulse is so short that thermal damage should not occur in the tissue under the general conditions used for imaging. Additionally, the two-photon laser used for imaging is distinct from the two-photon laser used for surgical photodisruption of the TM,13 which is 105 times more powerful.
Our group previously demonstrated the use of 2PM to image deeply into the TM of flat-mounted human cadaver tissue while in its native, unfixed state.8 In the present study, we evaluated the usefulness of 2PM for imaging the TM and nearby outflow structures within intact enucleated unfixed and fixed mouse eyes. Our findings provide the foundation for pursuing live animal ophthalmic imaging to further characterize the in vivo structure and function of the aqueous outflow system.
Methods
Mouse Eye Tissue
Eyes were obtained as post-necropsy tissue from mice euthanatized at the conclusion of other unrelated research projects. Mice from a C57BL/6 strain with no ocular phenotype were provided by Mark Petrash (University of Colorado, Denver), and DBA/2J mice were provided by Moshe Levi (University of Colorado, Denver). The DBA/2J inbred mouse strain develops iris pigment dispersion, iris atrophy, and a spontaneous optic neuropathy that has many features in common with human glaucoma.14 All mice were between 4 months and 21 months of age. After euthanatization, eyes were enucleated and held for imaging either in phosphate-buffered saline (PBS; 8 g/L sodium chloride, 0.2 g/L potassium phosphate monobasic, 2.16 g/L sodium phosphate dibasic heptahydrate, pH 7.4) for unfixed whole eye imaging or in 4% paraformaldehyde in PBS for fixed whole eye imaging.
FITC-Dextran Perfusion
In a single experiment, a euthanatized C57BL/6 mouse (4 months of age) was immediately perfused from a gravity-fed catheter with a 2.5-mL solution of 20 mg/mL fluorescein isothiocyanate (FITC)-labeled dextran (average molecular weight, 150 kDa; Sigma-Aldrich, St. Louis, MO) in PBS. The dextran solution was perfused through a 26-gauge needle placed near the apex of the left ventricle of the heart until the liver of the mouse appeared greenish-yellow from the fluorescein dye under white lighting. The eyes were then immediately enucleated and preserved fresh in PBS on ice until imaged by 2PM (within 0–3 hours).
Two-Photon Microscopy Imaging
Except when noted, all enucleated mice eyes were oriented with the anterior/posterior axis perpendicular to the imaging axis, yielding sagittal/transverse cross-sections of the eye. 2PM imaging was performed using an adapted confocal microscope (LSM 510 META on Axiovert 200M platform; Carl Zeiss MicroImaging Inc., Göttingen, Germany) with Zeiss 510 control software (Zen 2009; Carl Zeiss MicroImaging Inc.) equipped with a tunable mode-locked Ti:Sapphire laser (Chameleon Ultra II; Coherent Inc., Santa Clara, CA). The excitation source (Ti:Sapphire laser) was operated at a centered wavelength of 800 nm with 100- to 200-femtosecond pulses at a repetition rate of 80 MHz. 2PM was performed by focusing the excitation laser through the sclera of the mouse eye using a 25×/0.8 NA objective lens with a 0.21-mm working distance (LCI Plan-NeoFluar; Carl Zeiss MicroImaging Inc.). The emitted signal was first passed through a 650-nm short-pass filter to remove residual excitation of laser light. Unless otherwise noted in the text, 2PM signals were separately detected using non-descanned detectors with filter windows of 390 to 410 nm for SHG and 450 to 650 nm for 2PAF. Multiple x-y images were collected along the z-axis (image stacks) and processed in the control software (Zen 2009; Carl Zeiss MicroImaging Inc.). To image the entire circumference of the mouse eye, a larger mosaic image was generated from multiple adjacent individual images using the image tiling function (see Fig. 4). The laser power used in this study was between 24% and 28% of maximum laser power (>3.5 W), measured to be between 10 and 12 mW at the objective.
Figure 4.
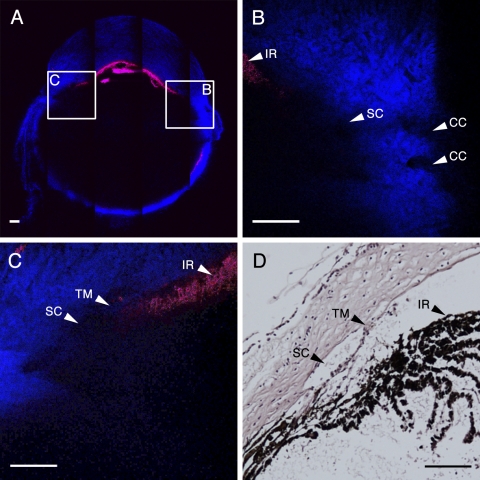
Mouse eye anatomy imaged by simultaneous 2PAF and SHG. 2PM imaging was performed in an unfixed, enucleated C57BL/6 mouse eye imaged with the cornea oriented perpendicularly to the objective lens. (A) A 5 × 5 composite of tiled 2PM images (tiles each 450 μm/side) illustrates a transverse optical slice completely through the mouse eye. Red: 2PAF; blue: SHG. The iris (IR) is apparent by 2PAF signal from the melanin, and the cornea and sclera are apparent by their SHG signal. Two small regions (B, C, insets) centered on the iridocorneal angle of this eye are shown at higher resolution in (B) and (C), respectively. (B) SC is identified by the absence of an SHG signal and as correlated to its anatomic location to the IR (red). Collector channels (CCs) are visible as open structures within the scleral tissue (blue). (C) The IR is visible by the 2PAF signal (red) of the melanin contained within, the corneal is visible as the SHG signal (blue) at the top of the panel, and the SC is located as an area lacking SHG signal near the insertion point of the IR. The thin mouse trabecular meshwork (TM) layer was identified as a hazy strip of SHG signal interior to SC. (D) Hematoxylin and eosin–stained histologic section from the same region shown in C. The relative locations of the SC, TM, and IR in this histologic section are in close approximation to their locations in the 2PM image. Scale bars, 100 μm.
In the experiment performed on the FITC-dextran–perfused C57BL/6 mouse, the eye was first imaged by SHG and 2PAF, as described. Because FITC has a sharp fluorescence peak near 525 nm (Sigma) and melanin exhibits a broad fluorescence ranging from approximately 500 nm to approximately 700 nm,15 the two signals will overlap in the 2PAF channel (450–650 nm). To distinguish between these two signals, the FITC-dextran–perfused eye was also imaged using the attached spectral detector (META, Carl Zeiss MicroImaging Inc.) with user-defined channels of 516 to 548 nm for FITC-dextran fluorescence and 612 to 666 nm for melanin fluorescence.
2PM Image Analysis and Processing
The control software (Zen 2009; Carl Zeiss MicroImaging Inc.) package was used to prepare all 2PM images and animations. This software was used to integrate the two fluorescent signals into single dual-color images and to adjust overall image brightness (see Figs. 2A, 4B, 4C, 5A–D, 6A, 6B, 7A–C). Image stacks were projected into three dimensions using the Render series function to create 3D animations of the stacks seen rotating about the y-axis (Supplementary Movies S1–S3, http://www.iovs.org/lookup/suppl/doi:10.1167/iovs.10-7115/-/DCSupplemental). The Render series function was also used to create a virtual cross-section of the image stack (an x-z image), essentially by rotating the stacked images 90° about the y-axis (see Fig. 2B).
Figure 2.
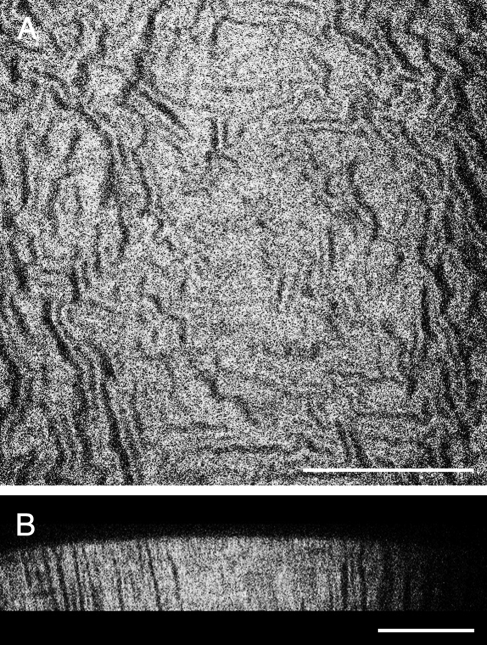
SHG in the mouse cornea. 2PM imaging was performed in an unfixed, enucleated C57BL/6 mouse eye imaged with the cornea toward the objective lens. (A) A single coronal cross-section showing the corneal stroma extracellular matrix imaged by SHG. The SHG signal exhibited an interlocking pattern that has been similarly reported in the literature. This 2PM image was captured at a depth of 90 μm from the anterior surface. (B) A virtual transverse cross-section built from a 90-μm deep image stack of 2PM images taken through the cornea. Scale bars, 100 μm.
Figure 5.
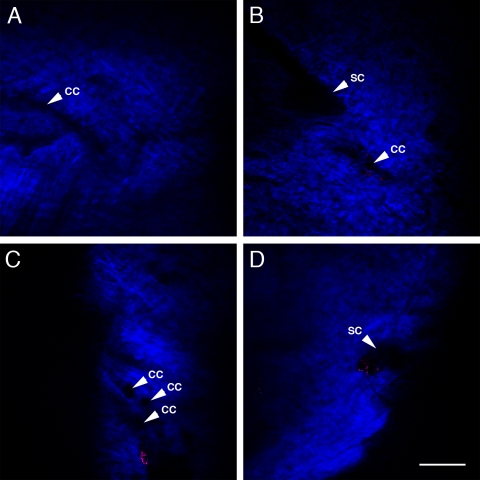
2PAF and SHG imaging of iridocorneal angles from three additional C57BL/6 mouse eyes. 2PM imaging was performed as in Figure 4. Collector channel (CC)-like structures are visible in all the images. (A) An approximately 20-μm wide forked CC runs horizontally through the sclera. (B) A CC structure appears close to the SC structure in a second C57BL/6 mouse eye. (C, D) Two images from different regions of the iridocorneal angle of a third C57BL/6 mouse eye. (C) Contains multiple CC. (D) SC is visible. Scale bar, 100 μm.
Figure 6.
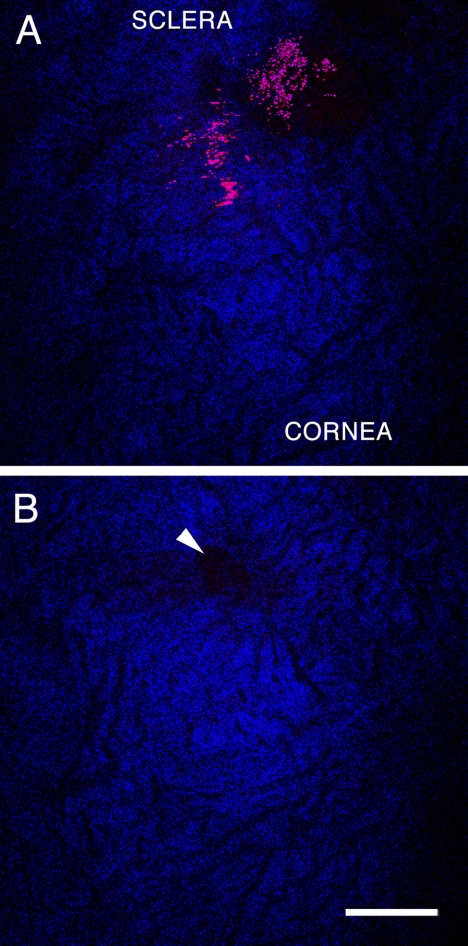
Drainage pores visible by 2PM in an intact enucleated DBA/2J mouse eye. The imaging plane was parallel to the inner surface of the TM, near the attachment of the iris on the interior surface of the eye. (A) Scanned image 3 μm interior to the image in (B). The red 2PAF signal corresponds to pigment granules (either free or within the iris), and the blue SHG signal corresponds to collagen matrix in the sclera and cornea. The collagen matrix of the cornea/sclera is apparent, but the TM was not clearly distinguishable from this angle. (B, arrowhead) Drainage structure in the TM region obstructed by overlying pigment granules or iris in (A). Scale bar, 100 μm.
Figure 7.
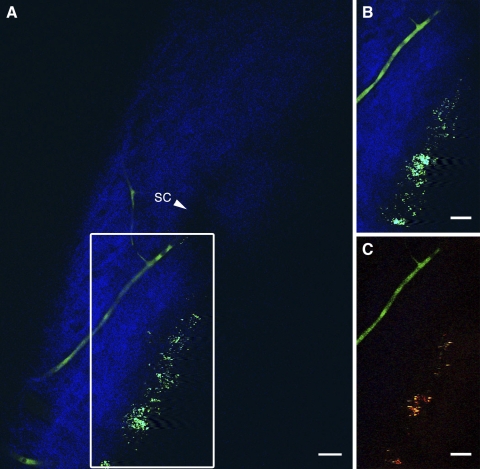
Aqueous humor drainage structures are distinct from fluorescence-labeled blood vessels. 2PM imaging of an intact, unfixed C57BL/6 mouse eye after fluorescein-conjugated dextran perfusion. (A) 2PM imaging of the left iridocorneal angle shows SC visible as an absence of both SHG (blue) and 2PAF signal (green). Both dextran-labeled vessels and autofluorescent structures (most likely melanin granules) are visible within the range of the detector set for 2PAF (450–650 nm). (B) The region boxed in Figure 6A, demonstrating that the 2PAF channel contains fluorescent signals from both melanin (grainy material) and FITC-dextran (tubular structure). (C) Similar region as shown in Figure 6B but imaged using the spectral META detector on the microscope to separate the merged FITC/melanin signals with user-defined channels. Individual FITC-dextran–labeled vessels (green, 516–548 nm) and autofluorescent melanin structures (yellow/red, 612–666 nm) can be seen distinctly. Scale bars, 25 μm.
Histologic Staining and Photography
After 2PM imaging was completed, the eyes (fixed or fresh) were preserved in 4% paraformaldehyde in PBS overnight at 4°C. They were embedded in paraffin and sectioned at a thickness of 6 μm. Tissue sections were then stained with Mayer's hematoxylin and eosin Y (H&E; Richard-Allan Scientific, Kalamazoo, MI). Bright-field imaging (see Figs. 1A, 1B, 4D) was performed using an advanced research microscope (Eclipse 80i; Nikon, Melville, NY) equipped with a color camera (D5-Fi1; Nikon) and a 10×/0.30 Plan Fluor objective lens (Nikon).
Figure 1.
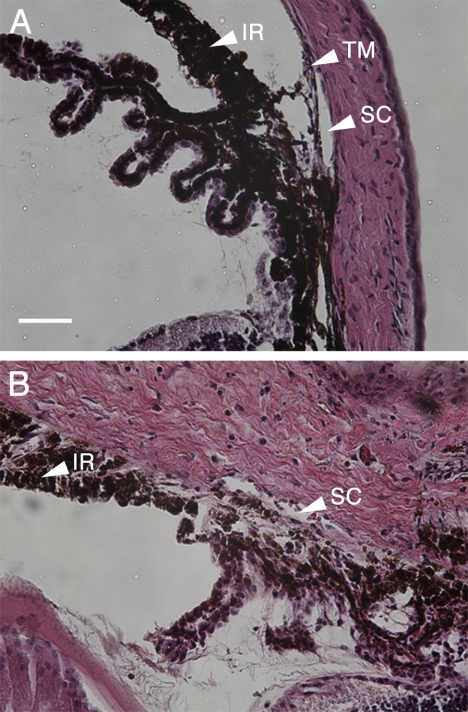
Histologic analysis of normal and diseased eyes at the iridocorneal angle. H&E-stained sections from a C57BL/6 normal mouse (A) and a glaucomatous DBA/2J mouse (B). (A) Histology of a C57BL/6 normal mouse showed an unobstructed SC, a well-defined TM at the angle, and a normal IR. (B) Histology from DBA/2J tissue exhibited marked corneal and scleral edema, hyperpigmentation of the IR, and complete closure of the angle with obliteration of the TM. The SC in (B) appears partially collapsed compared with the SC in (A). Scale bar, 100 μm for both images.
Results
Histology sections clearly demonstrate the anatomy of the aqueous outflow region of the mouse eye. Figure 1 shows H&E-stained thin sections of the iridocorneal angle of a C57BL/6 mouse (Fig. 1A) and a DBA/2J mouse (Fig. 1B) with the following structures labeled: iris (IR), TM, and Schlemm's canal (SC). The normal C57BL/6 mouse (Fig. 1A) contained a clear SC with clearly visible cellular TM (arrowhead). In contrast, the glaucomatous DBA/2J mouse (Fig. 1B) demonstrated marked corneal and scleral edema, hyperpigmentation of the iris (IR) with complete iridocorneal angle closure, and the presence of erythrocytes in the SC structure (arrowhead). Furthermore, the TM of the DBA/2J mouse could not be distinguished in the region of the iris insertion, and SC (arrowhead) appeared shrunken or collapsed. These changes were consistent with the known ocular pathology of this mouse strain, which includes pigment granule accumulation in the TM and eventual blockage of the drainage structures, leading to increased IOP and an eventual optic neuropathy that resembles human glaucoma.14
2PM was performed on an intact eye freshly enucleated from a C57BL/6 mouse, oriented with the corneal surface facing the objective. The strongest signal captured in these scans was SHG from the collagenous extracellular matrix of the corneal stroma; no detectable 2PAF was detected using 800-nm excitation. Figure 2A shows an SHG image generated from a single scanned plane 90 μm below the anterior surface of the mouse cornea. An image stack 90-μm thick was used to generate a virtual cross-section of the cornea, which is represented in Figure 2B. The morphology of the mouse corneal stroma in this study demonstrated a repeated interlocking structural collagen motif that has been similarly demonstrated in the literature.16
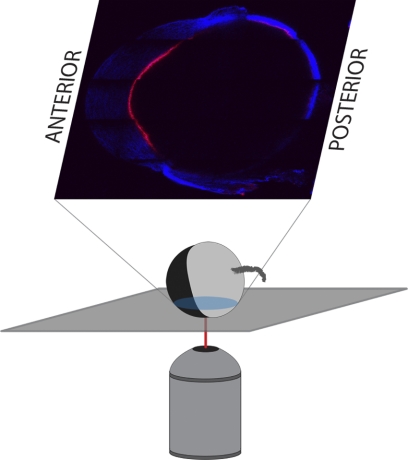
For subsequent imaging of freshly enucleated C57BL/6 eyes, the globes were oriented with the cornea perpendicular to the microscope objective, as shown in the schematic pictured in Figure 3. Automated tiling of the 2PM images allowed for a “bird's eye view” of the entire cross-section of the C57BL/6 eye, enabling anatomic localization based on gross landmark identification (Fig. 4A). This technique was used to locate and scan the iridocorneal angle accurately and reproducibly (Figs. 4B, 4C). Figure 4A is a composite image of 5 × 5 tiles (1 tile = 450 μm × 450 μm) at a depth of 160 μm from the outer surface of the sclera. 2PAF (red) and SHG (blue) were simultaneously detected after excitation at 800 nm. The most abundant 2PAF signal came from iris pigment granules. SHG collagenous structures are visible from the cornea (top of the image), the sclera and choroid (sides and bottom), and conjunctiva and muscle (outside the globe). Figure 4B is a single-frame 2PM scan of the right iridocorneal angle region corresponding to inset B in Figure 4A. The melanin from the peripheral iris (IR) was visible as 2PAF in the upper left of the panel (arrowhead), the cornea was visible as textured SHG at the top of the image, and the sclera was visible as dense SHG signal in the bottom right of the panel. SC was identifiable in the central area of panel B as a large region lacking both the SHG signal of the sclera and 2PAF from the iris (arrowhead). Adjacent tube-shaped regions within the sclera lacking SHG signal are consistent with the size and location of collector channels (CC, arrowheads). These CCs were visible radiating to the right toward the conjunctival surface, away from SC. From the region shown in Figure 4B, an image stack was collected at 1-μm intervals, encompassing a total depth of 40 μm, centered about the plane imaged in Figure 4B. These images were rendered in three dimensions, rotated about the y-axis, and the resultant animation is shown as Supplementary Movie S1 (http://www.iovs.org/lookup/suppl/doi:10.1167/iovs.10-7115/-/DCSupplemental).
Figure 3.
Orientation of enucleated mouse eyes for imaging. Except where noted, all enucleated mouse eyes were imaged with the anterior/posterior axis of the eye perpendicular to the imaging axis. This yielded sagittal/transverse cross-sections of the eye (pictured).
Figure 4C is a single frame 2PM scan of the left iridocorneal angle region corresponding to inset C in Figure 4A. The melanin of peripheral iris (IR) was visible as the 2PAF signal of the melanin contained within these cells (arrowhead), the corneal stroma was visible as the SHG signal at the top of the panel, and SC was identified as the area lacking SHG signal (arrowhead). The thin mouse TM layer was identifiable as a hazy strip of SHG signal interior to SC (arrowhead); however, because of its small volume, this tissue was more difficult to resolve. From the region shown in Figure 4C, an image stack was collected at 1-μm intervals, encompassing a total depth of 40 μm, centered about the plane imaged in Figure 4C. These images were rendered in three dimensions, rotated about the y-axis, and the resultant animation is shown as Supplementary Movie S2 (http://www.iovs.org/lookup/suppl/doi:10.1167/iovs.10-7115/-/DCSupplemental). Finally, Figure 4D is a bright-field image of an H&E-stained histologic section from the same region imaged in Figure 4C in the same eye. The same structures (IR, TM, and SC) are labeled in both Figure 4C and Figure 4D for purposes of reference. Figure 4D shows a thin cellular TM (arrowhead) immediately adjacent to a patent SC (arrowhead) and is remarkably consistent with the 2PM image in Figure 4C.
The images presented in Figure 4 are from a single unfixed C57BL/6 mouse eye but are qualitatively similar to images captured from the eyes of three other C57BL/6 mice. Figures 5A to 5D contain images from a single plane of the iridocorneal angle of three separate eyes. The two images Figures 5C and 5D are from separate regions of the iridocorneal angle of the same eye. CC-like structures (arrowheads) were detected in all three eyes. In Figure 5A, there is a ‘y’-forked CC running horizontally across the sclera. In Figure 5B, a CC structure is close to the SC structure. Figure 5C contains visible CCs, and the SC is visible in Figure 5D.
2PM was also performed on intact enucleated DBA/2J eyes that had been fixed in 4% paraformaldehyde. There was no significant attenuation of 2PAF or SHG when imaging fixed tissue compared with unfixed tissue (data not shown). Figure 6 demonstrates 2PM of an intact fixed DBA/2J mouse eye orientated approximately 30° to the surface of the limbus, with the purpose of imaging along the axis of the mouse iris. Figure 6 shows two adjacent image planes, separated by 3 μm. The image in Figure 6A is located interior to the image in Figure 6B. Panel A is at or near the surface of the TM because both the SHG signal from the interior corneal/scleral surface and the 2PAF signal from the melanin are visible. Located just exterior to this in panel B is a visible open pore consistent with the location of the junction of the SC with a CC (arrowhead). The large amount of overlying melanin (seen with 2PAF) and the difficulty in locating open structures within the sclera suggest that many of these pores are obstructed or collapsed. Furthermore, no large SC structures could be visualized in the iridocorneal angle of the DBA/2J mouse. We believe our 2PM images, showing the obstruction or loss of fluid-filled structures with the sclera, are highly consistent with the histology shown in Figure 1B.
To verify that the regions lacking SHG signal in our 2PM images were aqueous-humor filled spaces, we perfused a C57BL/6 mouse with FITC-labeled dextran immediately after euthanatization and before enucleation of the eyes for imaging. Dextran-labeled blood vessels were present in the sclera near the corneoscleral junction. Figure 7A reveals several of these dextran-labeled vessels as the FITC conjugate was detected in the 2PAF detector range (450–650 nm; green). One major branch terminated near a patch of autofluorescent tissue in the SC wall. This is best visualized in the animation sequence of Supplementary Movie S3 (http://www.iovs.org/lookup/suppl/doi:10.1167/iovs.10-7115/-/DCSupplemental). Supplementary Movie S3 is an animation of a 3D rendering of a 64-μm-thick image stack collected at 1-μm intervals through the left angle drainage region. The center image of this stack was the source of the image in Figure 7A. As the animation rotated, numerous signal-absent structures were in the sclera corresponding to channels that did not label with the dextran. These open structures did eventually connect with dextran-containing vessels similar to the pathway of collector channels and aqueous veins that connected with episcleral vessels in humans. Given that FITC fluoresces in the range used to detect the 2PAF signal from melanin, both are depicted as green in Figures 7A and S3.
Figure 7B is a subset image of Figure 7A, showing how the melanin and FITC-dextran fluorescent signals overlap. 2PAF signals are visible both from a tubular structure, likely a blood vessel located in the scleral wall, and from melanin located near the ciliary body and iris region. To separate these two signals, a spectral detector was used to define channels with specific wavelengths of fluorescent light. The result is shown in Figure 7C, an image that closely correlates to the location of the image in Figure 7B and the box in 7A. In Figure 7C, the two signals from these different structures were separated, with the green signal representing the range for FITC epifluorescence (516–548 nm) and the yellow/red signal representing melanin fluorescence (612–666 nm).
Discussion
The current report demonstrates the usefulness of 2PM for transscleral imaging of the intact mouse eye and for identifying structures in the region of the TM. These findings represent, to our knowledge, the first high-resolution image acquisition of mouse aqueous outflow structures in unfixed tissue, and they provide the framework for advanced aqueous drainage studies in the mouse eye in vivo. These findings build on our previous work showing high-resolution deep tissue 2PM imaging of the human TM region.8
Inadequate drainage of aqueous humor is believed to lead to elevated IOP, a leading risk factor for the development of glaucoma. In the conventional outflow pathway, the fluid seeps through the TM, flows through SC, and then flows into CCs.17 OCT and UBM have resolution within the anterior segment of approximately 15 to 25 μm.18,19 These imaging techniques lack the high resolution to accurately image the fine structures of the TM and CCs. We propose that 2PM is a uniquely qualified technique for the high-resolution acquisition of images necessary for monitoring the progression of primary open-angle glaucoma (POAG) by imaging the aqueous outflow system.20
The complex morphology of the connective tissue and cells in the region of the TM and SC may have significant consequences for the normal outflow of aqueous humor as well as the pathologic blockage of its drainage. Extracellular plaques deposited within the juxtacanalicular TM and the inner wall of SC were first described in electron microscopic analysis of glaucomatous eyes.21 The presence of these sheath-derived (SD) plaques was shown to be dramatically increased in trabeculectomy specimens from POAG eyes compared to normal eye specimens, with no correlation to age.22 Previous experiments pinpoint the juxtacanalicular TM region as a major site in outflow resistance.23 In normal-tension glaucoma, pathologic morphology in the TM region has also been demonstrated, including lattice collagen cluster deposits and a large amount of deposited SD plaque beneath the endothelium of SC.24 These findings and others underscore the importance of obtaining high-resolution structural images to monitor changes occurring in the TM that relate to the development of many types of glaucoma. The ability of 2PM to image collagenous tissue by SHG and autofluorescent structures by 2PAF demonstrate that it may be well suited to detect the changes noted here that occur in the glaucomatous eye.
In this study, we demonstrated the use of 2PM for imaging the iridocorneal angle tissue morphology of intact enucleated mouse eyes. Because of their different spectra, we were able to separate the SHG signal resulting from collagen structures from the 2PAF signal resulting from both the tissue melanin and the exogenously added FITC-dextran. With the numerical aperture of our objective lens and an excitation wavelength of 800 nm, we estimate that our imaging had an estimated lateral resolution of approximately 0.6 μm, with a depth resolution of approximately 3 μm. Thus, we were able to image intact mouse tissue with a resolution near that of histologic sections but without the distortions caused by an infusion of fixatives, tissue shrinkage from alcohols, and fine tissue morphologic changes that can occur with the infusion of paraffin or epoxy.
SC, CCs, and transscleral/episcleral vessels were clearly identified. Structural details of the collagenous cornea stroma match what has been reported for 2PM imaging in other species.16,25,26 The presence of TM and SC in the 2PM scans in this study demonstrates the usefulness of using mouse eye tissue as a suitable animal model for 2PM analysis of aqueous drainage pathology. Detection of significant 2PAF at the iridocorneal angle in the pigment-overproducing DBA/2J mouse in this study suggests this mouse strain as a useful model for tracking glaucomatous changes by 2PM. Fluorescent dextran allowed for the visualization of some, but not all, vessels in the sclera near the limbus, leaving SC and CCs unlabeled. A more rigorous categorization of these channels with multiple labeling compounds may enable detailed characterization of outflow pathways by 2PM.
The potential to image the eyes of normal and DBA/2J mice, without sacrificing them for histology, could add to our understanding of aqueous outflow and would demonstrate the usefulness of 2PM for diagnosing glaucoma or characterizing its progression.
Supplementary Material
Acknowledgments
The authors thank Mark Petrash and Moshe Levi for providing the mouse eyes obtained for this study.
Footnotes
Supported in part by National Institutes of Health/National Center for Research Resources, Colorado CTSI Grant UL1 RR025780 (Advanced Microscopy Core Facility, Division of Renal and Hypertensive Diseases, Department of Medicine, University of Colorado Denver).
Disclosure: A.W. Johnson, None; D.A. Ammar, P; M.Y. Kahook, P
References
- 1. Resnikoff S, Pascolini D, Etya'ale D, et al. Global data on visual impairment in the year 2002. Bull World Health Organ. 2004;82:844–851 [PMC free article] [PubMed] [Google Scholar]
- 2. Weinreb RN, Khaw PT. Primary open-angle glaucoma. Lancet. 2004;363:1711–1720 [DOI] [PubMed] [Google Scholar]
- 3. Libby RT, Gould DB, Anderson MG, John SW. Complex genetics of glaucoma susceptibility. Annu Rev Genomics Hum Genet. 2005;6:15–44 [DOI] [PubMed] [Google Scholar]
- 4. Congdon NG, Broman AT, Bandeen-Roche K, Grover D, Quigley HA. Central corneal thickness and corneal hysteresis associated with glaucoma damage. Am J Ophthalmol. 2006;141:868–875 [DOI] [PubMed] [Google Scholar]
- 5. Johnson M. What controls aqueous humour outflow resistance? Exp Eye Res. 2006;82:545–557 [DOI] [PMC free article] [PubMed] [Google Scholar]
- 6. Leung CK, Weinreb RN. Anterior chamber angle imaging with optical coherence tomography. Eye (Lond). 2011;25(3):261–267 [DOI] [PMC free article] [PubMed] [Google Scholar]
- 7. Irshad FA, Mayfield MS, Zurakowski D, Ayyala RS. Variation in Schlemm's canal diameter and location by ultrasound biomicroscopy. Ophthalmology. 2010;117:916–920 [DOI] [PubMed] [Google Scholar]
- 8. Ammar DA, Lei TC, Gibson EA, Kahook MY. Two-photon imaging of the trabecular meshwork. Mol Vis. 2010;16:935–944 [PMC free article] [PubMed] [Google Scholar]
- 9. Gibson EA, Masihzadeh O, Lei TC, Ammar DA, Kahook MY. Multiphoton microscopy for ophthalmic imaging. J Ophthalmol. 2011;2011:870–879 [DOI] [PMC free article] [PubMed] [Google Scholar]
- 10. Masihzadeh O, Ammar DA, Lei TC, Gibson EA, Kahook MY. Real-time measurements of nicotinamide adenine dinucleotide in live human trabecular meshwork cells: effects of oxidative stress. Exp Eye Res. In press [DOI] [PMC free article] [PubMed] [Google Scholar]
- 11. Ammar DA, Lei TC, Masihzadeh O, Gibson EA, Kahook MY. Trans-scleral imaging of the human trabecular meshwork by two-photon microscopy. Mol Vis. 2011;17:583–590 [PMC free article] [PubMed] [Google Scholar]
- 12. Helmchen F, Denk W. Deep tissue two-photon microscopy. Nat Methods. 2005;2:932–940 [DOI] [PubMed] [Google Scholar]
- 13. Toyran S, Liu Y, Singha S, et al. Femtosecond laser photodisruption of human trabecular meshwork: an in vitro study. Exp Eye Res. 2005;81:298–305 [DOI] [PubMed] [Google Scholar]
- 14. McKinnon SJ, Schlamp CL, Nickells RW. Mouse models of retinal ganglion cell death and glaucoma. Exp Eye Res. 2009;88:816–824 [DOI] [PMC free article] [PubMed] [Google Scholar]
- 15. Teuchner K, Freyer W, Leupold D, et al. Femtosecond two-photon excited fluorescence of melanin. Photochem Photobiol. 1999;70:146–151 [PubMed] [Google Scholar]
- 16. Wang BG, Koenig K, Riemann I, Krieg R, Halbhuber KJ. Intraocular multiphoton microscopy with subcellular spatial resolution by infrared femtosecond lasers. Histochem Cell Biol. 2006;126:507–515 [DOI] [PubMed] [Google Scholar]
- 17. van der Merwe EL, Kidson SH. Advances in imaging the blood and aqueous vessels of the ocular limbus. Exp Eye Res. 2010;91:118–126 [DOI] [PubMed] [Google Scholar]
- 18. Leung CK, Li H, Weinreb RN, et al. Anterior chamber angle measurement with anterior segment optical coherence tomography: a comparison between slit lamp OCT and Visante OCT. Invest Ophthalmol Vis Sci. 2008;49:3469–3474 [DOI] [PubMed] [Google Scholar]
- 19. Knspik DA, Starkoski B, Pavlin CJ, Foster FS. A 100–200 MHz ultrasound biomicroscope. IEEE Trans Ultrason Ferroelectr Freq Control. 2000;47:1540–1549 [DOI] [PubMed] [Google Scholar]
- 20. Quigley HA, Vitale S. Models of open-angle glaucoma prevalence and incidence in the United States. Invest Ophthalmol Vis Sci. 1997;38:83 91 [PubMed] [Google Scholar]
- 21. Rohen JW, Witmer R. Electron microscopic studies on the trabecular meshwork in glaucoma simplex. Albrecht Von Graefes Arch Klin Exp Ophthalmol. 1972;183:251–266 [DOI] [PubMed] [Google Scholar]
- 22. Lutjen-Drecoll E, Shimizu T, Rohrbach M, Rohen JW. Quantitative analysis of ‘plaque material’ in the inner- and outer wall of Schlemm's canal in normal- and glaucomatous eyes. Exp Eye Res. 1986;42:443 455 [DOI] [PubMed] [Google Scholar]
- 23. Maepea O, Bill A. The pressures in the episcleral veins, Schlemm's canal and the trabecular meshwork in monkeys: effects of changes in intraocular pressure. Exp Eye Res. 1989;49:645–663 [DOI] [PubMed] [Google Scholar]
- 24. Lutjen-Drecoll E, Rohen JW. Morphology of aqueous humor outflow pathways in normal and glaucomatous eyes. In: Ritch R, Shields MB, Krupin T. eds. The Glaucomas. St. Louis: CV Mosby; 1996:89–123 [Google Scholar]
- 25. Morishige N, Wahlert AJ, Kenney MC, et al. Second-harmonic imaging microscopy of normal human and keratoconus cornea. Invest Ophthalmol Vis Sci. 2007;48:1087–1094 [DOI] [PMC free article] [PubMed] [Google Scholar]
- 26. Yeh AT, Nassif N, Zoumi A, Tromberg BJ. Selective corneal imaging using combined second-harmonic generation and two-photon excited fluorescence. Opt Lett. 2002;27:2082–2084 [DOI] [PubMed] [Google Scholar]
Associated Data
This section collects any data citations, data availability statements, or supplementary materials included in this article.


