The authors characterized the edge fitting of soft contact lenses and predicted mismatches between the lens and the ocular surface using UHR-OCT and UL-OCT. This technology may open new methods for lens design and fitting evaluation.
Abstract
Purpose.
To characterize the edge fitting of soft contact lenses using ultra-high resolution optical coherence tomography (UHR-OCT) and ultra-long scan depth optical coherence tomography (UL-OCT).
Methods.
A total of 20 participants (11 men, 9 women; mean age, 32.3 years) were recruited. Four different types of soft contact lenses were randomly fitted to both eyes of each subject on two separate visits. After 30 minutes, the horizontal meridians of the corneal center, midperiphery, and limbus were imaged by UHR-OCT. UL-OCT imaged each lens in vitro and the ocular surface of a physical model eye.
Results.
Angle-edged lenses had significantly less conjunctival buildup than did round-edged lenses (P = 0.008). Limbal post-lens tear film gaps were present in 42% of the eyes, with the round-edged lenses having the most at 68%. Similarly, post-lens tear film gaps at the corneal mid-periphery were present in 47% of all eyes, with the round-edged lens having the most at 75%. Mismatches between the lens and the ocular surface were simulated based on UL-OCT images of the in vitro lenses and the model eye. The existence of tear film gaps and touching points were predicted in the simulation.
Conclusions.
The soft contact lens edge fitting was characterized by the conjunctival buildup and tear film gaps. Different types of contact lenses presented different levels of conjunctival buildup as well as different frequencies of tear film gaps. The findings by UHR-OCT were predicted in the simulation by UL-OCT. The application of these new technologies may open new ways of designing lenses and evaluating their fit.
Evaluation of contact lens fit is critical to clinical practice. Poorly fitting soft lenses are more likely to alter ocular physiology than well-fitting lenses and can contribute to the discontinuation of contact lens wear.1 Both tight- and loose-fitting lenses are associated with greater fluorescein staining, and loose-fitting lenses can cause bulbar and limbal hyperemia.1 Tears on contact lenses are critical for maintaining clear vision, ocular comfort, and health.2,3 The presence of an abnormally thin tear film on both sides of the lens or less tear exchange underneath the lens may cause dry eye sensations that are also a common cause of contact lens wear discontinuation.4
Traditionally, the slit-lamp evaluation of soft lens fitting is focused primarily on the lens centration, movement, and coverage. However, such evaluation may not be enough to understand the cause of contact lens–induced discomfort and complications. Differently designed lenses with different materials may have unique fitting characteristics, and these may impact the interaction of the lens with the ocular surface and the distribution of post-lens tear film. These features may result in different levels of altered ocular physiology and discomfort. However, because of a lack of suitable tools, there is very little published evidence that quantitatively characterizes the edge-fitting properties of soft contact lenses.
With technological advancements in optical coherence tomography (OCT), a custom-built ultra-high resolution spectral domain OCT (UHR-OCT) instrument was used to visualize tear dynamics at the lens center and around the edge.5 Additionally, the modified ultra-long scan depth OCT (UL-OCT) has the ability to image the entire ocular surface and the overall lens shape in vitro.6 In this study, we used UHR- and UL-OCT imagery to characterize the edge fitting of soft contact lenses and to predict mismatches between the lens and the ocular surface.
Subjects and Methods
This study was approved by the research review board of the University of Miami. Informed consent was obtained from each subject, who was treated in accordance with the tenets of the Declaration of Helsinki. Each subject was enrolled in the study if there was no evidence or history of binocular vision anomalies, dry eye, or any ocular surface disease, such as conjunctivochalasis, that might have affected the relationship between the contact lens and the ocular surface.7 None of the subjects was taking ocular medication.
Four soft contact lenses with different designs were used in this study (Table 1). After the subject was fitted with the study lens during the screening visit, slit-lamp evaluation was performed by one of the investigators (JW) to confirm the lens fitting. Acceptable fitting was judged to have a centration of <1 mm and the post-blink movement within 0.2 to 0.4 mm. The investigator also asked the subject if the discomfort was intolerable. All four study lenses were evaluated for each potential subject during the screening examination. After screening, a total of 20 participants (11 men, 9 women, 5 Caucasian, 15 Asian) with a mean age of 32.3 years (range, 25–39 years) were recruited from the campus of the University of Miami and the medical center. Eleven of the subjects were adapted contact lens wearers, and nine were non-lens wearers.
Table 1.
Properties of Soft Contact Lenses
| Biomedics 55 | Pure Vision | Acuvue 2 | Acuvue Advance | |
|---|---|---|---|---|
| Manufacturer | Cooper Vision | Bausch & Lomb | Vistakon, Johnson & Johnson | Vistakon, Johnson & Johnson |
| Diameter, mm | 14.2 | 14.2 | 14.0 | 14.0 |
| Base curvature, mm | 8.6 | 8.6 | 8.7 | 8.7 |
| Power, D | −3.00 | −3.00 | −3.00 | −3.00 |
| Material | Ocufilcon D | Balafilcon A (SiHi) | Etafilcon | Galyfilcon A (SiHi) |
| Modulus, MPa | 0.47 | 1.1 | 0.3 | 0.43 |
| Edge shape | Rounded | Rounded | Angled | Angled |
| Center thickness, mm | 0.07 | 0.09 | 0.08 | 0.07 |
| Water content, % | 55 | 36 | 58 | 47 |
A UHR-OCT instrument with 3-μm resolution was used to visualize the lens edges and interaction with the ocular surface, as described in detail in our previous studies.5,8 In brief, the instrument used a three-module superluminescent diode light source (Broadlighter, T840-HP; Superlumdiodes Ltd, Moscow, Russia) with a center wavelength of 840 nm and a full-width-at-half-maximum bandwidth of 100 nm. The source, after passing through a fiber pig-tailed isolator, was coupled to a fiber-based Michelson interferometer. The interferometer included a fiber coupler that split the light into the reference arm and the sample arm. The sample light was delivered to a telecentric light delivery system driven by an X-Y galvanometer scanner. The power of the sample light was adjusted to lower than 750 μW to ensure the safety of the eye.
The study consisted of two visits for each subject in which the edge-fitting properties of the four lenses (Table 1) were assessed. Two of the lenses (Biomedics 55 [CooperVision Inc., Fairport, NY] and PureVision [Bausch & Lomb, Rochester, NY]) had rounded edges, and two (Acuvue 2 [Vistakon, Johnson & Johnson Vision Care, Inc., Jacksonville, FL] and Acuvue Advance [Vistakon]) had angled edges. At each of the two visits, which took place 1 to 3 days apart, 2 of the 4 lenses were randomly selected. The order of lens insertion was also randomized for each eye of each subject. Thirty minutes after lens insertion, UHR-OCT imagery was performed immediately after a blink.
All OCT imaging was conducted in a consulting room with controlled temperature (15°C-25°C) and humidity (30%–50%). All subjects were scheduled after 10 AM to avoid the edematous cornea and the alteration of the tear film induced by sleep, which could have affected the results.9,10 The subjects were asked to sit in front of the instrument and to look straight at an external target while an 8-mm-wide scan was made on the horizontal meridian. Images for the center, nasal, and temporal sides of the lens were obtained for each eye by rotating the OCT probe to target the limbus.
Each of the four types of lenses and the surface of an ocular imaging eye model (OEMI-7; Ocular Instruments Inc., Bellevue, WA) were also imaged by UL-OCT. The eye model simulated a normally shaped human ocular surface, anterior chamber, and crystalline lens. The lenses were imaged while immersed in contact lens solution (ReNu MultiPlus; Bausch & Lomb). If the lens image was not readable, liquid droplets (0.5% Intralipid; Fresenius Kabi, Uppsala, Sweden) were applied to enhance the contrast. The UL-OCT instrument was used to image the entire contact lens and model ocular surface, as described in our recent study.6 Briefly, a custom spectrometer with a special design was developed to achieve an experimental scan depth of 7.2 mm in air based on the technology of spectral-domain OCT. The modification includes a transmission grating and a line scan CCD camera (Aviiva SM2 CL 2010, 2048 pixels; Atmel, San Jose, CA). X-Y cross-aiming was applied to align the UL-OCT scanning position necessary to image the ocular surface and the entire lens in vitro. The UL-OCT has an approximately 6-μm axial resolution and a scan width up to 20 mm.
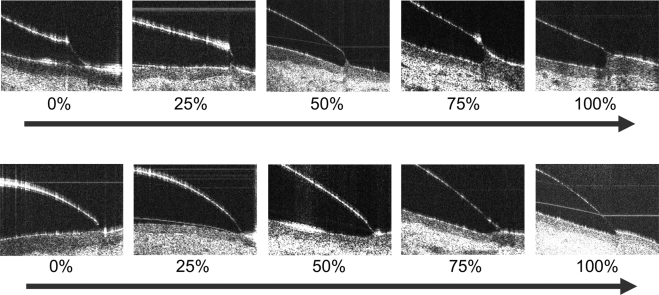
UHR-OCT images of the contact lens edges were optically distorted because of the different refractive indices and curved surfaces of the edges.11 Custom software was used to correct the image using the Fermat principle.11 The percentage of edge covered by the conjunctiva was categorized by an analog ranking scale of 0%, 25%, 50%, 75%, and 100% for each lens (Fig. 1). Images labeled as 0% edge coverage showed almost no conjunctiva buildup around the lens edge. Images labeled as 100% edge coverage showed conjunctiva buildup of almost all the entire lens edge. The rankings were evaluated in the OCT images after optical correction for the distortion.11 To count the tear film gaps underneath the lens edge region, each OCT image was evaluated and marked Gap if a gap was present on the cornea and at the limbus. It was ranked as No Gap if the gap was absent. The observer (JW) was masked to the lens types to minimize bias during evaluation of the edge coverage and tear film gaps.
Figure 1.
In vivo UHR-OCT images of soft contact lens edges. (A) PureVision. (B) Acuvue 2. The PureVision lenses had a rounded edge, and the Acuvue 2 lenses had an angled edge. All images were corrected for optical distortion. Conjunctival buildup at the lens edge varied from 0%, indicating nearly no buildup, to 100%, indicating nearly full conjunctival buildup. Scale bar, 500 μm.
Data analysis was performed using statistical analysis software (Statistica; StatSoft, Tulsa, OK). The nonparametric Mann-Whitney U test was used to determine significant differences of the measured conjunctival buildup among contact lenses. The χ2 test was used to test the differences of occurrence frequency of tear film gaps among lenses. Nonparametric Spearman R was used to analyze the correlation between the tear film gaps and conjunctival buildup.
Results
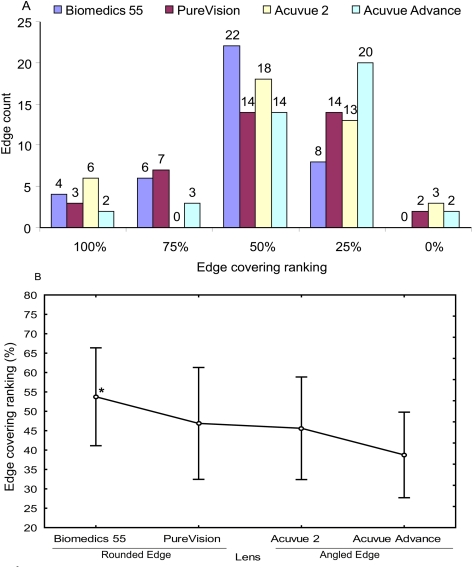
Corrected UHR-OCT images were used to rank the conjunctival buildup on the lenses with rounded edges (Fig. 1A) and angled edges (Fig. 1B). Approximately 75% of all lenses were covered between 25% and 50% at the edge (Fig. 2A). The conjunctiva was not flat in any of the subjects using the round-edged Biomedics 55 lens (CooperVision Inc.). The angled-edge Advance Acuvue (Vistakon) lens had significantly less edge covering than did the round-edged Biomedics 55 lens (Mann-Whitney U test; P = 0.008; Fig. 2B). There were no significant differences in conjunctival buildup among other lenses.
Figure 2.
Edge ranking among lenses. Conjunctival buildup on the lens edge was ranked on an analog scale at 0%, 25%, 50%, 75%, and 100%, indicating the degree of buildup around the lens edge. Rankings were assigned after the image was optically corrected. (A) Distribution of the edge ranking among the four lenses. Approximately 75% of all lenses were covered between 25% and 50% at the edge. In the Biomedics 55 lens, the conjunctiva did not remain flat (0%). (B) Comparison of edge ranking among lenses. The Biomedics 55 lens with the rounded edge had significantly more covering than did the Acuvue Advance lens with the angled edge (Mann-Whitney U test; *P = 0.008 for Biomedics 55 vs. Acuvue Advance). There were no significant differences in conjunctival buildup among the other lenses.
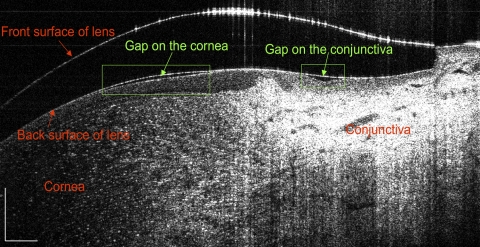
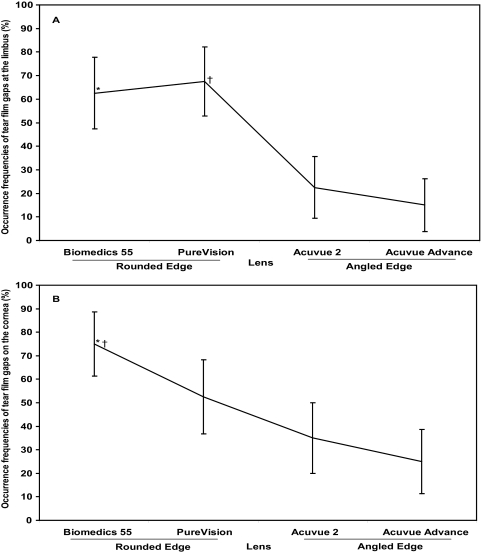
Tear film gaps were visualized at two locations. One was between the lens edge and the limbus, and the other was between the lens and the midperipheral cornea (Fig. 3). These two gaps did not appear to be connected. The post-lens limbal tear film gap was present in 42% of all eyes, with the round-edged PureVision (Vistakon) lens having the most at 68% (Fig. 4A; χ2 test; P < 0.001) compared with the two angled-edge lenses. The Biomedics 55 lens also presented more occurrence frequency of limbal tear film gaps compared with the two angled-edge lenses (Fig. 4A; χ2 test; P < 0.001). The occurrence frequency of the limbal tear film gap was similar for the two rounded-edge lenses and for the two angled-edge lenses (χ2 test; P > 0.05).
Figure 3.
Visualized tear film gaps underneath the lens. Tear film gaps between the lens and the ocular surface were clearly visualized. The limbal gap was located at the corneal-scleral transition, and the corneal gap was located at the midperiphery. These two gaps did not appear to be connected. Scale bar, 500 μm.
Figure 4.
Occurrence frequencies of tear film gaps. (A) Tear film gap at the limbus. The round-edged PureVision lens had the highest percentage of post-lens tear film gap at the limbus (68%; χ2 test; †P < 0.001 for PureVision and *P < 0.001 for Biomedics 55 compared with the two angle-edged lenses, respectively). There was no significant difference in the frequency between the two round-edged lenses or between the two angle-edged lenses (χ2 test; P > 0.05). (B) Tear film gap over the cornea. The round-edged Biomedics 55 lens had the highest percentage of post-lens tear film gap on the cornea (75%; χ2 test; *P < 0.001 compared with the angle-edged Acuvue 2 and the Acuvue Advance; †P < 0.05 compared with the round-edged PureVision). There was no significant difference between the two angle-edged lenses (P > 0.05). Bars denote 95% confidence intervals.
The post-lens corneal tear film gap was present in 47% of all eyes; the round-edged Biomedics 55 lens had the most at 75% (Fig. 4B; χ2 test; P < 0.001) compared with the angle-edged Acuvue 2 and Acuvue Advance lenses. The frequency of occurrence in the Biomedics 55 was also greater than in round-edged PureVision lenses (χ2 test; P < 0.05). There was no difference between the angled-edge lenses (P > 0.05) and no correlation between the conjunctival buildup and tear film gaps at either the limbus or the cornea (Spearman R; P > 0.05).
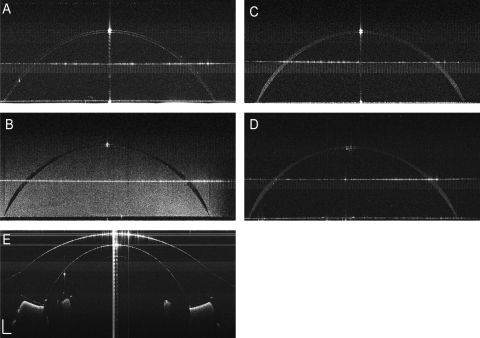
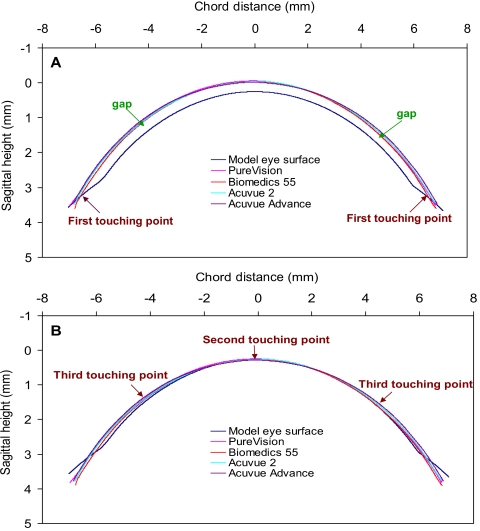
Each of the four contact lenses and the model eye were clearly visualized by UL-OCT (Fig. 5). The simulation (Fig. 6) matching the back surface of each contact lens and the front surface of the model eye demonstrated the gaps and touch points. The first touch point was predicted at the limbus, where the lens first contacted the surface of the model eye (Fig. 6A). The second predicted touch point was located on the apex of the model eye (Fig. 6B). Finally, the third predicted touch point was apparent at the midperiphery of the model eye. Clearly, the post-lens tear film gaps were located between the touch points at the lens edge and the apex (Fig. 6A). The gap located at the limbus was predicted between the edge and the third touch point. The other gap was predicted between the second touch point at the apex and the third touch point at the midperiphery of the cornea. Locations of the predicted touch points and gaps were consistent with the UHR-OCT imagery of the subjects wearing each of the four types of lenses.
Figure 5.
In vitro UL-OCT images of entire contact lenses and a model eye. Four study lenses were immersed in contact lens solution and imaged using UL-OCT. A model eye was also imaged in air. (A) Biomedics 55. (B) PureVision. (C) Acuvue 2. (D) Acuvue Advance. (E) Ocular surface of the model eye. The Acuvue 2 lens image was enhanced by liquid droplets added in the solution. Scale bar, 500 μm.
Figure 6.
Simulations of surface mismatches between the contact lenses and the model eye. The simulation matching the back surface of each contact lens and the front surface of the model eye demonstrated the gaps and touching points. The first touching point was predicted at the limbus when the lens first contacted the surface of the model eye (A). When the apex touched the surface of the model eye, the second touching point was located on the apex of the model eye (B). Meanwhile, the third touching point was apparent at the midperiphery of the model eye. Clearly, the post-lens tear film gaps were located between the touching point at the lens edge and the apex (A).
Discussion
Traditional methods to evaluate the fit of a lens rely primarily on the pattern of fluorescein under the lens. For a soft contact lens, regular fluorescein cannot be used because of permanent staining of the lens surface.12 Evaluation is limited to subjective comfort, lens centration, lens movement, and surface wettability. However, it takes time to evaluate all these parameters. Importantly, these parameters do not provide enough information about the relationship between the lens and the ocular surface that may enable understanding of contact lens–induced complications and discomfort. The interaction between the ocular surface and the contact lens, especially around the lens edge, may play a significant role in lens comfort and in the health of the ocular surface. Characterization of soft contact lens edge fitting may enable understanding of the relationship between the lens properties and the ocular surface, leading to better lens design and improved ocular health. In the present study, we used UHR-OCT to characterize the fit of the lens edge by assessing the conjunctival buildup and the post-lens tear film gap. Evaluation by UHR-OCT may open a new era for objectively evaluating the lens fit to achieve the best possible match between the lens and the ocular surface.
Based on the in vitro eye model, the tip of the edge first touched the ocular surface, which could then induce changes in the lens to comply with the surface shape. The bending of the lens edge could then create another touch point on the cornea, inducing the second tear film gap that was evident in the in vivo UHR-OCT findings. Pressure in the post-lens tear film can be induced by the deformation of the contact lens to the shape of the ocular surface.13,14 If a lens does not match well with the ocular surface shape, localized pressure variations will occur, thus possibly inducing clinical consequences that depend on the magnitude and distribution of the pressure.13,14 Conjunctival buildup occurred around the lens edge and the tear film gaps occurred at the midperipheral cornea and at the limbus. This implies that the mismatch or localized pressured occurred around these locations when fitting the lenses. Higher levels of conjunctival buildup and greater frequencies of tear film gaps occurred in the lenses with rounded edges, indicting that lens edge shape may affect lens fitting. However, these differences may also depend on other lens factors, such as material modulus, central thickness, base curve, and lens diameter. Contact lenses with a higher modulus are less likely to match the shape of the ocular surface. Pressure variations in the post-lens region, combined with elastic forces of the lens, can result in a tight fit or in edge fluting.15,16 This may also be the cause of the different levels of the conjunctival buildup and distribution of post-lens tear film gaps. Lens design parameters, including thickness, diameter, and power, also affect localized pressure14,17 and thus can contribute to the OCT findings investigated in this study. The relationship between these lens factors and OCT findings should be explored in further studies that take into account ocular surface shape, especially at the peripheral cornea and the corneal-scleral junction. It has been shown that for a given contact lens design and material, the main factor that affects lens pressure, and therefore lens fitting, is ocular surface shape.18 Other factors, such as eyelid shape and tension,19 could also play a role in lens fitting.
Tear exchange may be impacted by the interaction between the lens edge and the shape of the ocular surface. We hypothesize that a higher level of conjunctival buildup around the lens edge may reduce tear exchange beneath the lens. The tear exchange may also have an association with the tear film gaps. Another factor related to the tear exchange is movement of the lens,20,21 which may facilitate the tear exchange. In the present study, we did not measure lens movement or tear exchange. Therefore, future studies will be needed to confirm these hypotheses.
The present study demonstrates the feasibility using OCT to characterize the edge fitting of soft contact lenses and paves the way to study the relationship between lens fitting and ocular responses. In vitro simulation clearly predicted the mismatch points between the lens and the ocular surfaces. Based on comparisons between the in vitro and in vivo studies, it is likely that the shape of the lens edge changes when it is placed on the eye. Touch points between the lens and the ocular surface were identified at the corneal apex, midperiphery of the cornea, and the limbus. Given that the apex is the thinnest point of these minus lenses, the other two touch points may be responsible for some clinical signs or mechanical damage to the ocular surface, including conjunctival folds,22 indentation,16,23 corneal and conjunctival staining,24,25 and possibly epithelial thinning.26,27 Contact lens–induced conjunctival staining and indentation of the conjunctival tissue are commonly seen in tight-fitting soft contact lens wear because of the compression of the lens edge.16,24 Conjunctival folds, a predictor of the dryness in contact lens wearers, is presumed to be the result of the mechanical influence of the lens edge.22 Some studies have reported contact lens wear–induced corneal and conjunctival epithelial thinning because of the overall or localized pressure on the ocular surface.26,27 The touch points may exist around the entire circumference of the eye because of the overall tight fit. If this predication is true, then buckling at the circumferential touch points may cause adverse responses such as staining and superior epithelial arcuate lesions (SEALs).28 The arc shape of many SEALs may be attributed to the interaction of the lid with a poorly fitting contact lens.
Because this was the first attempt to characterize the edge-fitting properties of soft contact lenses and to predict the mismatches between the lens and the ocular surface, the study had some limitations. The UL-OCT was not available at the time of the in vivo study; therefore, we were unable to use it to image the ocular surface of the subjects wearing the lenses. We also assumed that both eyes of each subject were similar; however, this might have introduced some measurement errors because of the different ocular surface shapes of the right and left eyes. Although the in vitro study using the UL-OCT with the eye model provided useful information for generalized prediction, the application of the UL-OCT in vivo will yield more details on the lens fitting at the edge and over the cornea. Interestingly, the simulation of the four study lenses on the surface of the model eye provided some predictions regarding the touch points and resultant tear film gaps. Further studies will be needed to link the ocular surface and the lens for a full range of the fitting evaluation. The relationships between the edge-fitting and overall fitting characteristics will be the subject of future studies. Our results with this small subject population for two visits and a 30-minute study period demonstrated the feasibility of characterizing edge-fitting properties and their implications for successful contact lens wear. A larger sample size will be needed to test the differences between lenses worn for long periods. Frequent ratings of ocular comfort and frequent measurements might also reveal the relationship between ocular comfort and lens edge interactions. Finally, different lens designs for improving ocular comfort, health, and mobility may also be investigated with these OCT techniques.
In summary, this was the first attempt using UHR-OCT and UL-OCT in characterizing lens edge fitting and the interaction between the lens and the ocular surface for a short period of lens wear. Different types of contact lenses presented different levels of conjunctival buildup as well as different frequencies of tear film gaps on the mid-peripheral cornea and at the limbus. The findings by UHR-OCT were predicted in simulations based on UL-OCT of the lenses and a model eye. The evolving technology of OCT may open new methods for designing and evaluating lenses for goodness of fit to the ocular surface.
Acknowledgments
The authors thank Britt Bromberg (Xenofile Editing, New Orleans, LA) for providing editing services for this manuscript.
Footnotes
Supported in part by research grants from Vistakon, National Institutes of Health Center Grant P30 EY014801 (JW), and Research to Prevent Blindness (JW).
Disclosure: M. Shen, Vistakon, Johnson & Johnson (F); L. Cui, Vistakon, Johnson & Johnson (F); C. Riley, Vistakon, Johnson & Johnson (F, E); M.R. Wang, Vistakon, Johnson & Johnson (F); J. Wang, Vistakon, Johnson & Johnson (F)
References
- 1. Young G, Coleman S. Poorly fitting soft lenses affect ocular integrity. CLAO J. 2001;27:68–74 [PubMed] [Google Scholar]
- 2. Fonn D. Targeting contact lens induced dryness and discomfort: what properties will make lenses more comfortable. Optom Vis Sci. 2007;84:279–285 [DOI] [PubMed] [Google Scholar]
- 3. Maruyama K, Yokoi N, Takamata A, et al. Effect of environmental conditions on tear dynamics in soft contact lens wearers. Invest Ophthalmol Vis Sci. 2004;45:2563–2568 [DOI] [PubMed] [Google Scholar]
- 4. Caffery BE, Richter D, Simpson T, et al. CANDEES: the Canadian Dry Eye Epidemiology Study. Adv Exp Med Biol. 1998;438:805–806 [PubMed] [Google Scholar]
- 5. Wang J, Jiao S, Ruggeri M, et al. In situ visualization of tears on contact lens using ultra high resolution optical coherence tomography. Eye Contact Lens. 2009;35:44–49 [DOI] [PMC free article] [PubMed] [Google Scholar]
- 6. Shen M, Wang MR, Wang J, et al. Entire contact lens imaged in vivo and in vitro with spectral domain optical coherence tomography. Eye Contact Lens. 2010;36:73–76 [DOI] [PMC free article] [PubMed] [Google Scholar]
- 7. Mimura T, Usui T, Yamamoto H, et al. Conjunctivochalasis and contact lenses. Am J Ophthalmol. 2009;148:20–25 [DOI] [PubMed] [Google Scholar]
- 8. Chen Q, Wang J, Tao A, et al. Ultrahigh-resolution measurement by optical coherence tomography of dynamic tear film changes on contact lenses. Invest Ophthalmol Vis Sci. 2010;51:1988–1993 [DOI] [PMC free article] [PubMed] [Google Scholar]
- 9. Patel S, Bevan R, Farrell JC. Diurnal variation in precorneal tear film stability. Am J Optom Physiol Opt. 1988;65:151–154 [DOI] [PubMed] [Google Scholar]
- 10. Shen M, Wang J, Qu J, et al. Diurnal variation of ocular hysteresis, corneal thickness, and intraocular pressure. Optom Vis Sci. 2008;85:1185–1192 [DOI] [PubMed] [Google Scholar]
- 11. Westphal V, Rollins A, Radhakrishnan S, et al. Correction of geometric and refractive image distortions in optical coherence tomography applying Fermat's principle. Opt Express. 2002;10:397–404 [DOI] [PubMed] [Google Scholar]
- 12. Refojo MF, Miller D, Fiore AS. A new fluorescent stain for soft hydrophilic lens fitting. Arch Ophthalmol. 1972;87:275–277 [DOI] [PubMed] [Google Scholar]
- 13. Jenkins JT, Shimbo M. The distribution of pressure behind a soft contact lens. J Biomech Eng. 1984;106:62–65 [DOI] [PubMed] [Google Scholar]
- 14. Martin DK, Holden BA. Forces developed beneath hydrogel contact lenses due to squeeze pressure. Phys Med Biol. 1986;31:635–649 [DOI] [PubMed] [Google Scholar]
- 15. Dumbleton K. Adverse events with silicone hydrogel continuous wear. Cont Lens Anterior Eye. 2002;25:137–146 [DOI] [PubMed] [Google Scholar]
- 16. Santodomingo-Rubido J, Wolffsohn J, Gilmartin B. Conjunctival epithelial flaps with 18 months of silicone hydrogel contact lens wear. Eye Contact Lens. 2008;34:35–38 [DOI] [PubMed] [Google Scholar]
- 17. Martin DK, Boulos J, Gan J, et al. A unifying parameter to describe the clinical mechanics of hydrogel contact lenses. Optom Vis Sci. 1989;66:87–91 [DOI] [PubMed] [Google Scholar]
- 18. Yong G. Ocular sagittal height and soft contact lens fit. J Br Contact Lens Assoc. 1992;15:45–49 [Google Scholar]
- 19. Lin MC, Soliman GN, Lim VA, et al. Scalloped channels enhance tear mixing under hydrogel contact lenses. Optom Vis Sci. 2006;83:874–878 [DOI] [PubMed] [Google Scholar]
- 20. Chauhan A, Radke CJ. The role of fenestrations and channels on the transverse motion of a soft contact lens. Optom Vis Sci. 2001;78:732–743 [DOI] [PubMed] [Google Scholar]
- 21. Miller KL, Polse KA, Radke CJ. Fenestrations enhance tear mixing under silicone-hydrogel contact lenses. Invest Ophthalmol Vis Sci. 2003;44:60–67 [DOI] [PubMed] [Google Scholar]
- 22. Pult H, Purslow C, Berry M, Murphy PJ. Clinical tests for successful contact lens wear: relationship and predictive potential. Optom Vis Sci. 2008;85:E924–E929 [DOI] [PubMed] [Google Scholar]
- 23. Brennan NA, Coles ML, Comstock TL, et al. A 1-year prospective clinical trial of balafilcon a (PureVision) silicone-hydrogel contact lenses used on a 30-day continuous wear schedule. Ophthalmology. 2002;109:1172–1177 [DOI] [PubMed] [Google Scholar]
- 24. Brautaset RL, Nilsson M, Leach N, et al. Corneal and conjunctival epithelial staining in hydrogel contact lens wearers. Eye Contact Lens. 2008;34:312–316 [DOI] [PubMed] [Google Scholar]
- 25. Nichols KK, Mitchell GL, Simon KM, et al. Corneal staining in hydrogel lens wearers. Optom Vis Sci. 2002;79:20–30 [DOI] [PubMed] [Google Scholar]
- 26. Efron N, Al Dossari M, Pritchard N. Confocal microscopy of the bulbar conjunctiva in contact lens wear. Cornea. 2010;29:43–52 [DOI] [PubMed] [Google Scholar]
- 27. Perez JG, Meijome JM, Jalbert I, et al. Corneal epithelial thinning profile induced by long-term wear of hydrogel lenses. Cornea. 2003;22:304–307 [DOI] [PubMed] [Google Scholar]
- 28. Holden BA, Stephenson A, Stretton S, et al. Superior epithelial arcuate lesions with soft contact lens wear. Optom Vis Sci. 2001;78:9–12 [DOI] [PubMed] [Google Scholar]


