

The bugeye zebrafish mutant exhibits a glaucoma-like phenotype, which includes elevated intraocular pressure and enlarged eyes. This study characterized this mutant to determine its potential as an animal model to study aspects of glaucoma.
Abstract
Purpose.
The bugeye mutant has an enlarged eye phenotype, presumably because of elevated intraocular pressure. Since elevated intraocular pressure is a significant risk factor for glaucoma, the bugeye zebrafish mutant may be a model organism for the disease.
Methods.
The optomotor response (OMR) was used to assess visual responsiveness in both larval and adult zebrafish. Electroretinograms (ERGs) were recorded to measure outer retinal function, and histologic analyses were performed on WT and mutant eyes.
Results.
At 5 days old, bugeye mutants have an OMR, ERGs, and retinal morphology indistinguishable from those of wild-type (WT) animals. By 2 months of age, bugeye mutants begin to develop an enlarged eye phenotype. At 3 months, some mutants show deficits in the OMR assay, including lower contrast sensitivity. The data suggest that there is a correlation between the size of the enlarged eye and the degree of OMR deficit. Histologic analysis of the bugeye mutant retina revealed decreases in retinal ganglion cell densities by 3 months. By 5 months, the mutant's ERG b-wave had smaller amplitudes and longer latencies at brighter light intensities than those of the WT fish.
Conclusions.
After phenotypic onset at 3 months, the bugeye mutants begin to develop visual deficits. At 3 months, bugeye mutants exhibit a decrease in retinal cell densities and by 5 months, they show diminished outer retinal function. In summary, the bugeye mutant provides a means of studying glaucoma-associated phenotypes in the zebrafish.
Glaucoma comprises a heterogeneous group of disorders that progressively lead to blindness due to loss of retinal ganglion cells (RGCs) and damage to the optic nerve.1 It is the second leading cause of blindness and the leading cause of irreversible blindness worldwide.2–4 Mutations in single genes, such as myocilin, have been found to be associated with an increased prevalence in one type of glaucoma (primary open-angle glaucoma, or POAG).5 However, it is now clear that glaucoma is a complex eye disease resulting from a confluence of multiple alleles and environmental factors.6 Nonetheless, both human glaucoma and mammalian glaucoma models are characterized by important risk factors. These include elevated intraocular pressure, age, family history, and myopia. While there is substantial evidence of the importance of elevated intraocular pressure (IOP) as a significant risk factor for and cause of glaucomatous pathologies, the importance of the relationship between glaucoma and myopia is not well understood. Based on correlation studies in patients with POAG, after controlling for elevated intraocular pressure, myopia has been identified as a significant risk factor.7 Several independent studies have supported this conclusion,8,9 but another study has reported no correlation between glaucoma and myopia,10 possibly because they did not account for the degree of myopia.11 The exact link between myopia and POAG pathology remains unknown, and there is currently no animal model in which this relationship has been investigated.
The zebrafish is an attractive model with which to study glaucoma phenotypes because of its fast development and the similarity of its nervous system, including the retina, to that of other vertebrates.12 One of the major advantages is the precedence of well-established methods of studying retinal function and vision in the zebrafish.13 The zebrafish is a highly visual animal with several well-characterized visually driven behaviors, which are more robust and innate than similar behaviors in the nocturnal mouse. These behaviors include the optokinetic reflex (OKR), optomotor response (OMR), prey capture, visual startle response, and the escape response.14,15
Another important advantage is the availability of genetically altered mutant zebrafish, such as the bugeye mutant. The bugeye mutant exhibits several glaucoma-like phenotypes, which include elevated intraocular pressure and enlarged eyes, resembling buphthalmos (John SW, et al. IOVS 2003;44:ARVO E-Abstract 1125).16 In this study, we further characterized this mutant and investigated the progressive loss of visual function by electrophysiology and visual behavioral testing. Using histologic techniques, we also demonstrated that the bugeye mutant exhibits a substantial loss of RGCs and significant thinning of all the cellular layers of the retina. In addition bugeye mutants exhibit a high degree of myopia that is associated with the enlarged eye phenotype. Thus, the bugeye mutant provides an opportunity for the study of several aspects of glaucoma, especially myopia-associated glaucoma.
Materials and Methods
Breeding and Isolating Mutant Zebrafish
WT and mutant zebrafish (Danio rerio, AB/TL background) were maintained at 28°C with a 14-hour ON/10-hour OFF light cycle and were fed a standard diet.17 All animal husbandry and experiments were approved and conducted in accordance with the guidelines set forth by the Institutional Animal Care and Use Committee of Harvard University and the ARVO Statement for the Use of Animals in Ophthalmic and Vision Research. The mutation is observed in homozygous recessive fish, and all experiments were carried out on fish that came from a homozygous cross in which both the male and female fish exhibited a pronounced eye phenotype. Control fish were age-matched AB/TL fish.
Eye and Lens Size Measurement
The fish were anesthetized with 0.4% tricaine (A5040) and imaged at a fixed magnification dorsally with a digital camera attached to a dissecting microscope. These images were imported into ImageJ Software (developed by Wayne Rasband, National Institutes of Health, Bethesda, MD; available at http://rsb.info.nih.gov/ij/index.html). Body lengths, eye volumes, and lens sizes were measured from these images with a custom ImageJ macro and commercial software program (MatLab; The MathWorks, Natick, MA). Body size was linearly correlated with eye length along both the temporal-nasal (R = 0.89) and lateral–medial axes (R = 0.89). To control for body size differences, eye lengths were normalized to body size before calculating overall eye volumes. Normalized eye volume was estimated using the formula for a spheroid, V = (4/3)πa2b, where a is the normalized temporal-nasal radius and b is the normalized lateral-medial radius. Lens sizes were determined at high magnification and evenly spaced points (at least 20) on each lens were chosen by manually clicking with a mouse cursor. The points were fitted with a best fit circle in a least-squares sense. The focal length (ƒ) of the lens and its distance to the retina were estimated as previously described by Easter and Nicola,18 using the approximate relationship that focal length is equal to the lens radius multiplied by 2.5. Briefly, a best fit ellipse was made for each eye, and points were chosen on opposite sides of the major axis. The distance from the center of the best fit sphere to each of these points was measured and averaged to arrive at xretina. A myopia index (MI) was calculated:
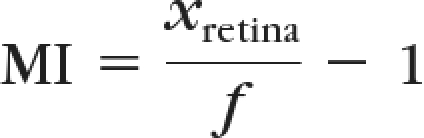 |
where ƒ is the lens radius × 2.5.
In using the above equation, a value of MI = 0 indicates no focusing deficits, whereas a value > 0 corresponds to a longer focusing distance and thus predicts myopic vision. MI values < 0 indicate hyperopia.
Histology
Histologic sections were prepared as previously described.12 Briefly, samples (entire fish heads) were fixed in 4% paraformaldehyde at 4°C overnight, washed three times with PBS, and dehydrated in increasing ethanol solutions (50%, 70%, 80%, 90%, 95%, 100%) for 10 minutes each at RT. The samples were infiltrated with propylene oxide twice for 15 minutes and then a 1:1 mix of propylene oxide:Epon for 2 hours at RT. They were then transferred to a 1:3 mix of propylene oxide:Epon and incubated overnight on a rotor at RT, embedded in Epon, and polymerized for 24 hours at 65°C. Serial sections (1 μm) were cut with an ultramicrotome stained with aqueous 1% methylene blue, 1% azure B, and 1% borax, covered with a synthetic resin mounting medium (Permount; Fisher Scientific, Pittsburgh, PA), coverslipped, and photographed under a bright-field microscope (DMRB; Leica Microsystems, Bannockburn, IL).
Retinal Layer Cell Counts
Cells in the photoreceptor (ONL), inner nuclear layer (INL), and ganglion cell layer (GCL) were counted in three consecutive 1-μm-thick sections in which the optic nerve tract was visible through both the retina and sclera. Neuronal cells were identified by their pale, round nuclei. The cells in the ONL and INL were counted in a 100-μm length of both peripheral and central retina (for a total of 200 μm), and cells in the entire length of the GCL were counted. Retinal ganglion cells (RGCs) in three consecutive sections were first counted in ImageJ with a semiautomated macro, and the counts were averaged. This quantification was then verified by manually counting the same slides in a blind manner. Retinal arc length was measured by tracing the INL with a custom ImageJ macro, and cell density was determined as the mean number of nuclei per retinal arc length.
Electroretinogram Recording
All experiments were performed at room temperature (22–26°C) under photopic conditions. ERG recordings from isolated larval fish eyes were performed as previously described by Wong et al.19 Adult fish were briefly anesthetized with 0.02% tricaine before being injected with 1 to 4 μL of 0.2% gallamine triethiodide, a nondepolarizing muscle relaxant. The fish were transferred to a sponge moistened with fish water and intubated with a small plastic pipette tip, which released a slow stream of fish water containing 0.4% tricaine through their gills. A small hole was made in the sclera of one eye near the pupil with a sharp tungsten needle, and the eye was perfused from above with a slow flow of Ringer's solution containing 130 mM NaCl, 2.5 mM KCl, 20 mM NaHCO3, 0.7 mM CaCl2, 1.0 mM MgCl2, and 20 mM glucose and maintained at pH 7.8 by continuously gassing it with ∼97% O2 and ∼3% CO2. A glass electrode with a tip diameter of 20 to 25 μm and filled with the Ringer's solution was lowered into the hole, just below the surface of the eye. The reference electrode was placed in the sponge inside the recording chamber. The fish (or larval eyes) were placed with the cornea facing the light stimulus: a 0.5-second, full-field, white-light stimulus ranging from the brightest light intensity log I = 0 to log I = −5 (530 mW/cm2 at log I = 0). All ERG recordings, performed under photopic conditions and amplified at 1000 total gain, were filtered from 0 to 300 Hz. The ERG traces were sorted and analyzed using custom software (written in MatLab; The MathWorks). Averaged traces were analyzed at several light intensities (log I = −5 to 0) by averaging three consecutive ERG recordings for each stimulus intensity, with the exception of log I = 0 intensity, in which only the first waveform was analyzed, to avoid light adaptation of the retina with subsequent flashes.
Amplitude and Implicit Time Calculations.
To avoid bias in the analysis of ERG data, b- and d-wave amplitudes, latencies, and implicit times were calculated using custom software (Matlab; The MathWorks) implementing automated algorithms, with performance optimized for accuracy on sample data. Boxcar and Savitzsky-Golay smoothing filters were applied to the data to remove noise before the measurements were made. The b-wave amplitude was measured from the trough of the a-wave to the peak of the b-wave. Implicit time was measured as the time to reach the peak of the waveform (a- or b-wave) after stimulus onset.
The b-Wave Decay Analysis.
A 2-second light stimulus of log 0 intensity was used to record b-wave decay. Three recordings were averaged before analysis. Decay time was calculated as the time between b-wave peak and return to baseline, using the custom software.
Optomotor Response
The apparatus for the OMR assay in the adult was similar to that previously described by Li and Dowling20 and Maaswinkel and Li et al.21 Fish were placed into a round drum with an opaque, white column in the center. Black and white stripes on the outside wall of the drum were rotated at 32 rotations per minute. These parameters were in the ranges for which Maaswinkel and Li found optimal OMR assay responsiveness.21 Before testing, the zebrafish were exposed to the light conditions of the apparatus to adapt for at least 20 minutes. OMR performance was quantified by the proportion of time swimming in the direction of the grating (PG). For testing visual responsiveness, the grating was presented to the fish in six 60-second trials (first two trials for adaptation and last four trials for data collection). Grating direction was alternated in each trial. Fish were exposed to a rotating uniform gray stimulus to determine the baseline response: the proportion of the time a fish swam in clockwise (CW) or counterclockwise (CCW) directions (PBcw and PBccw, respectively) in the absence of a grating was recorded.
The optomotor index (OMI) was used to determine whether a fish was responding positively, comparing direction preference during the presentation of a grating to baseline:
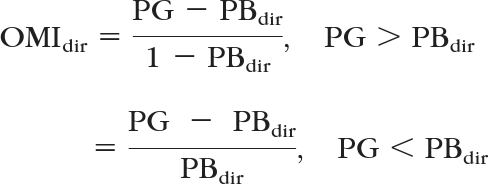 |
where dir indicates the direction, CW or CCW. A null response was conservatively defined as an OMI less than 0.3 in either direction. To confirm that the null response was not due to confounding factors unrelated to visual responsiveness, we retested the zebrafish at least three times on subsequent days.
Contrast Sensitivity Assay.
Stimuli of different contrasts (100%, 60%, 30%, 20%, 10%, 5%, and 0%) were used. These stimuli consisted of alternating black and white stripes (100% contrast) or alternating dark and light gray stripes, with contrast defined as Michelson contrast:
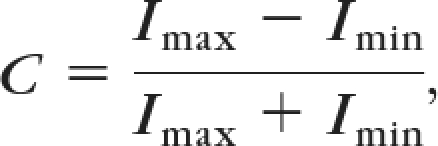 |
where I is the luminance.
Statistics
To compare groups, P values (two-sided) were calculated using one-way ANOVA (equivalent to two sample t-test for two groups) unless otherwise noted. Welch's t-test was applied as an alternative in cases in which the equal variance assumption was violated. Linear correlation P values were calculated with one-sample t-tests.
Results
The bugeye Mutant Displays an Enlarged Eye Phenotype with Age
The bugeye mutant was isolated in a forward genetic screening for adult ocular abnormalities and is characterized by a visibly enlarged eye phenotype. Larval bugeye zebrafish develop normally and are indistinguishable from wild-type (WT) embryos by morphology, electrophysiology, and behavioral testing until at least 1 month of age (Supplementary Fig. S1, http://www.iovs.org/lookup/suppl/doi:10.1167/iovs.10-6434/-/DCSupplemental). The enlarged eye phenotype is easily recognized by a pronounced bulging of the eyes starting at 3 months, and it progressively increases with age and reaches a plateau at 9 to 12 months (Fig. 1A). The severity of the enlarged eyes as well as the time of onset varies among the adult bugeye mutants. Although the eyes maintained a spheroidal shape, the degree to which the eyes expanded in the nasal–temporal and medial–lateral axes varied substantially among the fish. Thus, to characterize the progression of enlarged eyes in bugeye mutants, we calculated the eye volume, a measure of overall eye size that was normalized to body size, and tracked the WT and the mutant fish from 3 to 12 months of age (Fig. 1B). In the WT fish this ratio remained constant as the fish grew in size (0.125 ± 0.025). However, in the bugeye mutants the ratio increased significantly from 3 to 12 months of age (0.175 ± 0.005 and 0.26 ± 0.025, respectively). The increase in eye size was not always symmetrical and occasionally some of the bugeye mutants first developed the phenotype in one eye, with the other eye remaining normal in size (Supplementary Fig. S2, http://www.iovs.org/lookup/suppl/doi:10.1167/iovs.10-6434/-/DCSupplemental). This phenotype of bulging eyes resembles the human eye condition buphthalmia, which is often associated with elevated intraocular pressure. As noted earlier, bugeye mutants exhibit elevated intraocular pressure (IOP).16
Figure 1.

Progression of the enlarged eye phenotype in bugeye mutants. (A) Photographs (dorsal view) of representative WT fish and phenotypic bugeye mutants at several adult stages. (B) Quantification of the normalized eye volume from WT and bugeye mutants at several adult stages.
The Retina of Bugeye Mutants Exhibits a Thinning of All Cellular Layers
To determine whether the increase in eye size is due to overgrowth of the retina we examined histologic cross sections of the retinas of WT and bugeye mutants between the ages of 3 and 7 months (Fig. 2A). Starting at 3 months of age, both WT fish and bugeye mutants exhibited a substantial decrease in thickness of the ganglion cell layer (GCL). By 7 months of age, all the cellular layers of the retina in the WT and the bugeye fish were reduced. To quantify the thinning of the retina in the WT and the bugeye fish, we calculated the cell density of the layers of the retina as a function of age. At 3 months of age, a clear decrease in GCL density was observed in the WT retinas, but the cell density in the GCL was significantly more reduced (P < 0.001) in the bugeye mutants compared with the WT retinas (Fig. 2B). There was further reduction of GCL density in both the WT and the bugeye mutant retinas at 5 months of age, but again the reduction in the bugeye mutants was proportionally greater. In contrast, INL density in the WT animals increased initially with age (i.e., at 3 months) but as with GCL density, INL cell density in the bugeye fish mutants was less than in the WT fish at both 3 and 5 months (Fig. 2C). This was also the case for ONL cell density; we observed a significant decrease in cell density in the bugeye mutant retinas at 3 and 5 months of age compared with the WT retinas (Fig. 2D). Thus, there is a significant reduction of density in all cellular layers of the retina as the bugeye mutant ages compared with that in the WT retinas, but the reduction is most pronounced in the GCL.
Figure 2.

Histologic analysis of bugeye mutant retinas revealed severe morphologic abnormalities in the GCL, INL and ONL. (A) Retinal sections near the optic nerve from 3 to 7 months showing GCL, IPL (inner plexiform layer), INL, OPL, ONL, and RPE. Scale bar, 20 μm. Cell counts (nuclei per retinal arc length in a 1-μm section containing the optic nerve) of the (B) GCL, (C) INL, and (D) ONL at different ages (n = 6, and 4 at 5 days; n = 3, and 6 at 3 months; and n = 3, and 5 at 5 months for WT and bugeye mutants, respectively). Error bars, SEM, *P < 0.05 and **P < 0.01.
Bugeye Mutants Are Predicted to Have Significant Myopia at Adult Stages
Histologic cross sections of the eyes revealed a significant increase in size of the vitreous humor in bugeye mutants compared with WT fish at several adult ages (Fig. 3A). This observation implies that the focal length between the lens and retina in mutants with enlarged eyes is increased, and the eyes should therefore be myopic. The myopia index (MI), an estimate of the degree of myopia, was calculated for mutant and WT eyes at 3, 5, and 7 months of age (Fig. 3B). Using the MI equation (see the Methods section), positive values indicate myopic vision, a value of 0 corresponds to no predicted focusing deficit, and negative values correspond to predicted hyperopia. Whereas the WT fish were predicted to have no focusing defects or a slight hyperopia, the bugeye mutants were predicted to have significant myopia starting at 3 months of age. As the enlarged eye phenotype increased with age, the bugeye mutants were predicted to have an increase in the degree of myopic vision.
Figure 3.

Bugeye mutants may have significant myopia at adult stages. (A) Histologic sections of eyes from 3- and 5-month-old WT and bugeye mutant fish. Scale bar, 500 μm. (B) The MI for WT fish (n = 3 for each age group) suggests no significant focusing defects (P > 0.1) at adult stages, whereas bugeye mutants (n = 7, 6, and 8 at 3, 5 and 7 months, respectively) are predicted to have significant myopia at adult stages (*P < 0.05, **P < 0.01). Error bars, SEM.
Morphologic Abnormalities of the Retina Result in Visual Deficits in Bugeye Mutants
To determine whether bugeye mutants have any visual deficits after phenotypic onset, we tested their OMR. The OMR was quantified by an OMI, which is a measure of increased preference of a fish to swim in the direction of the rotating black and white stripes over a uniform gray stimulus. Fish that displayed an OMI equal to or greater than 0.3 in both directions were considered to be OMR positive (OMR+) (Supplementary Fig. S3, http://www.iovs.org/lookup/suppl/doi:10.1167/iovs.10-6434/-/DCSupplemental). We started with two populations of fish, WT (n = 20) and bugeye (n = 22) at two months of age before significant eye enlargement had occurred in the mutants. We tracked the progression of visual deficits by retesting fish from both groups that were OMR+ every 2 to 3 months until the fish exhibited a null response in at least one eye, or reached 1 year of age (Fig. 4A). As with the WT fish, the bugeye mutants were OMR+ at 2 months of age, suggesting that there were as yet no gross visual deficits as a result of the mutation. Over the 10-month period, there was not a significant decrease in the number of WT fish (95%) that were OMR+. In contrast, the number of the bugeye mutants that failed to exhibit an OMR steadily increased over time, and by 12 month of age approximately 75% of the bugeye mutants were OMR negative (OMR−). Nevertheless, approximately 25% of bugeye mutants continued to have a positive response through 1 year of age, despite having severe eye enlargement. These data suggest that in addition to phenotypic differences, there is also substantial variability in the bugeye population for retinal dysfunction as a result of the enlarged eye phenotype and elevated intraocular pressure.
Figure 4.

Bugeye mutants exhibited visual deficits beginning at 3 months. (A) The OMR of WT (n = 20) and bugeye mutant fish (n = 22) was tested starting at 2 months and ending at 12 months of age. Shown is the percentage distribution of fish that were either responsive (OMR+) or unresponsive (OMR−) to the rotating black-and-white stripes for each group of fish. (B) WT and bugeye mutant fish that tested OMR+ (n = 20 for each group) at 3 months were retested for more subtle visual deficits by changing the contrast level of the grating bars. The graph summarizes the OMI for the different contrast levels for each group of fish. Error bars, SEM. *P < 0.05 and ***P < 0.001.
Since myopia is associated with an increase in eye size, we next determined whether myopia is a significant factor in the gross visual deficits that we observed in the bugeye population. To test this hypothesis, we performed the OMR assay on the bugeye mutants with asymmetrical eye enlargement and compared the difference in OMI between the two eyes in relation to the difference in the predicted myopia index for each eye. We did not find a significant correlation between the two values (R = 0.21, P = 0.49; n = 13). Likewise, we did not see a significant difference between the myopic index of OMR+ and OMR− fish. As expected however, we did see a significant correlation between eye size and OMI value (R = 0.70, P = 0.008; n = 13; Supplementary Fig. S3, http://www.iovs.org/lookup/suppl/doi:10.1167/iovs.10-6434/-/DCSupplemental). We conclude, therefore, that myopia is not a critical factor in the vision deficits we observed in the bugeye mutants.
Next, we determined whether bugeye mutants with a robust OMR at 3 months of age display a more subtle visual loss. We tested the animal's ability to see lower contrast stimuli, by changing the black-and-white gratings of the OMR test to varying degrees of dark gray and light gray stripes (Fig. 4B). For each fish (n = 20 for the WT and bugeye fish) we recorded OMI at each contrast level and normalized them to the fish's maximum OMI value. Both 100% and 60% contrast levels of the grating did not elicit a difference in response between the WT and bugeye fish. However, at lower contrast levels (30%, 20%, 10%, and 5%), the bugeye mutants had significantly lower responses than did the WT fish. The difference was most significant (P < 0.001) for the 10% contrast stimulus. These results suggest that the onset of the enlarged eye phenotype is associated not only with gross visual deficits in bugeye mutants, but also with more subtle visual defects such as decreased contrast sensitivity.
Bugeye Mutants Exhibit Abnormal Outer Retinal Function Starting at 5 Months of Age
To determine whether the development of the enlarged eye phenotype has any effects on outer retinal function, we recorded ERGs at 3, 5, and 7 months of age in WT fish and bugeye mutants. Figure 5A shows representative ERG traces in response to a 0.5-second light stimulus over several log units of light intensity from a WT and bugeye retina at 5 months of age. The overall shape of the ERG response from the bugeye mutants was similar to that of the WT fish; however, the ERG b-wave was smaller in amplitude. We measured ERG b-wave amplitudes over several light intensities. Figure 5B shows the voltage-versus-light intensity curves for 3- and 5-month-old fish. At 3 months, there was no significant difference in the b-wave amplitudes between the bugeye mutants and the WT fish. However, by 5 months, the b-wave amplitudes were significantly reduced at higher light intensities (log I = −2, −1, and 0) in the bugeye mutant retinas.
Figure 5.

Starting at 5 months bugeye mutants exhibited ERG waveforms with diminished b-wave amplitudes. (A) Characteristic ERG responses to a flash of white light stimulus over several log units of light intensity (log I) for WT and bugeye mutant fish at 5 months of age. Black-and-white bars indicate light OFF and ON, respectively. (B) Quantification of averaged b-wave amplitudes in response to a 0.5-second light stimulus over several intensities at 3 and 5 months of age (n = 8). Error bars indicate SEM. *P < 0.05 and ***P < 0.001.
In addition to the reduction in ERG b-wave amplitude, the averaged decay time (i.e., the time necessary for the ERG b-wave to return to baseline after reaching peak amplitude) was also significantly prolonged in the bugeye mutants at 5 months of age (Fig. 6B). Figure 6A shows a representative ERG response to a prolonged 2 seconds light stimulus. That a small portion (one fifth) of the mutants lacked this abnormal b-wave decay may reflect variability in the damage done to the outer retina in the bugeye mutants. These results suggests that the progression of the enlarged eye phenotype does not have an effect on outer retinal function until 5 months of age, when most bugeye mutants develop a pronounced bulging of the eyes and exhibit a significant decrease in cell density throughout the retina.
Figure 6.

Bugeye mutants exhibited ERG waveforms with abnormal shape. (A) Representative WT and bugeye mutant ERG responses (superimposed) to a 2-second light stimulus (log I = −1) at 5 months. (B) Dashed line: averaged decay time (time required for the ERG b-wave to return to baseline level after reaching peak amplitude) at 3 and 5 months (n = 8). Error bars, SEM. *P < 0.05.
To determine whether the functional properties of the outer retina further deteriorates with age, we also recorded ERGs at 7 months of age. By this time, the bugeye mutants exhibited delays in both ERG a- and b-wave responses (Fig. 7). Thus, the implicit time, the time needed to reach peak amplitudes after the onset of the light stimulus, was significantly increased. Interestingly, we did not see a further reduction of peak b-wave amplitudes between 5 and 7 months of age in the bugeye mutants. These results suggest that as the enlarged eye phenotype becomes more pronounced with age, bugeye mutants exhibit an increase in morphologic and functional abnormalities of the outer retina, as well as various visual deficits.
Figure 7.

By 7 months, bugeye mutants exhibited a significant delay in ERG a- and b-wave responses. Left: Averaged ERG b-wave response to a flash of white light (log I = −1) of WT and bugeye mutants (superimposed) at 7 months. Middle and right: the average ERG a- and b-wave implicit times (time required to reach peak value after the onset of light) at 5 and 7 months, respectively. Error bars, SEM and **P < 0.01.
Discussion
The bugeye mutant zebrafish has been reported to exhibit enlargement of the eyes that is associated with elevated IOP.16 Since elevated IOP is a significant risk factor for glaucoma, we have characterized this mutant to determine its potential as an animal model for the study of several glaucoma phenotypes. Histologic analysis of the retina revealed that cell densities in the GCL, INL, and ONL are significantly lower in the bugeye mutant as early as 3 months of age, when the enlarged eye phenotype first becomes pronounced, but the loss of ganglion cells is proportionally greater. Further, we observed a noticeable loss of visual responsiveness (OMR and contrast sensitivity) at 3 months of age, and altered ERGs by 5 months. Another animal model with enlarged eyes and extreme myopia is the Black Moor goldfish, which has been shown to have a thinning of all cellular layers in adult fish.22–25 Whether there is an increase in IOP in these fish is controversial26–28; however, no genetic, physiological, or behavioral studies on these fish have been reported.
Similar to mammalian glaucoma models, such as the DBA/2J mouse line,29 the bugeye mutation leads to phenotypic expression in adulthood, and its consequences are both variable and asymmetric, even between eyes within the same animal. Eye enlargement was first apparent in some bugeye mutants at 2 to 3 months of age, with pronounced enlargement by 3 months. In the DBA/2J mouse, iris transillumination defects and elevated IOP first appeared between 6 and 8 months of age due to abnormal iris pigment synthesis in melanosomes,30,31 followed by mild depletion of RGCs starting at 11 months.32 This phenotypic progression is slower than that of the bugeye mutant, which exhibits elevated IOP by 3 months of age at which time it already displays significant RGC depletion. Despite the more rapid progression of RGC-related damage in the bugeye mutant zebrafish compared with that in the DBA/2J mouse, the impact of elevated IOP on the optic nerve was less obvious in the bugeye mutant. The excavation of the optic nerve seen clinically in humans is also observed in the mouse model; however, no cupping or thinning of the nerve fiber layer was obvious in the bugeye mutant retina (Supplementary Fig. S4, http://www.iovs.org/lookup/suppl/doi:10.1167/iovs.10-6434/-/DCSupplemental).
Zebrafish, like other teleosts, show a continuous generation of cells at the retinal margin. As has been shown in the closely related goldfish, this generation is the product of neural proliferation at the marginal zones, which continuously produces new retinal cells during normal eye growth or after injury.33 Also, it is well known that in teleosts the axons of newly generated RGCs correctly find their way to the tectum and make appropriate tectal innervations, as do the regenerating axons of injured ganglion cells.34,35 Further, experimental axotomy or optic nerve crush in zebrafish results in only 20% RGC death,36 whereas optic nerve axotomy in mammals results in apoptosis of nearly all RGCs.37–40 The ability to regenerate lost retinal cells may explain why the bugeye mutant, despite progressive increases in visual deficits (from mild loss of contrast sensitivity to gross visual deficits), does not go blind. In fact, the bugeye mutants feed normally (live prey), mate, and have a life expectancy similar to that of WT fish. This similarity suggests that the loss of retinal cell density, especially RGC density, does not surpass the critical rate that is necessary to maintain some vision.
In addition to an increase in visual behavioral deficits that correlate with age, we also observed alterations in outer retinal function as measured by ERG recordings from the bugeye retinas. At the initial onset of the enlarged eye phenotype at 3 month of age, no significant differences were observed in outer retinal function. However, at later stages (5 and 7 months), when the enlarged eye phenotype is more pronounced, significant changes were observed in ERG b-wave amplitude, decay, and implicit times. The ERG b-wave is generated mainly by ON bipolar cells in response to the onset of the light stimulus. The decrease in b-wave amplitudes may be associated with the decrease in cell density in the INL as well as in the ONL in the bugeye retina at 5 months of age (Figs. 2C, 2D). The increase in ERG b-wave implicit times observed in the bugeye mutant zebrafish has also been reported in several other mutants, such as the knock-out mouse, that lacks the Dp260 dystrophin gene normally expressed in the outer plexiform layer (OPL) of the retina.41 It was suggested that the delay in b-wave implicit time could reflect a defect in the release of l-glutamate from photoreceptors.
Longer b-wave implicit times have also been observed in other glaucoma animal models. In a 2003 study by Raz et al.,42 elevated IOP was induced in macaques by photocoagulation of the trabecular meshwork. After 7 years of ocular hypertension, aberrant responses in waveform latencies but not in amplitudes43 were found by multifocal (mf)ERG, a method that reflects visual field deficits after glaucomatous damage. Although effects on the inner retina were more obvious, outer retinal components of the mfERG were also found to have delayed latencies and implicit times, a result supported by other reports.44–46 However, these changes were much more subtle and longer-term than those we report. In humans, Fazio et al.,47 using the standard ERG protocol found in patients with glaucoma, significantly reduced a-waves, and delayed implicit times of the a-wave and of the scotopic b-wave. Furthermore, it has been shown that in optic atrophy, the pattern-reversal stimuli (PERG) can be either missing or strongly altered,48 and Korth et al.49 reported that the value of the ERG scotopic threshold response (STR), which is known to originate in the proximal retina, is only slightly reduced in glaucoma, but the scotopic b-wave is significantly diminished.
Independent of the visual deficits observed in the OMR test, the bugeye zebrafish also exhibits myopia, the degree of which increases with age. As bugeye zebrafish age, the enlarged eye phenotype becomes more pronounced, and the retina increases in size compared with the lens, which in turn results in significant refractive errors. Whether the enlarged eye phenotype is due to the elevated intraocular pressure in bugeye mutants is not clear; it is possible that these two phenotypes are distinct.
Veth et al.16 have recently identified nonsense mutations in the lrp2 gene in bugeye fish. The Lrp2 protein (LDL-receptor related protein 2) is a transmembrane protein and participates in receptor-mediated endocytosis. Lrp2 is expressed in many tissues including cells of the renal proximal tubule, choroid plexus, developing neural tube, intestine, thyroid, and inner ear. This protein is also expressed within the eye, in the retinal pigment epithelial cells and ciliary epithelial cell.50–52 In humans, mutations in this gene causes Donnai-Barrow syndrome (DBS).53 DBS is characterized by a range of variable phenotypes, such as sensorineural hearing loss, agenesis of the corpus callosum, cognitive impairment, congenital diaphragmatic hernia, and distinctive craniofacial features, including hypertelorism and enlarged fontanelle. More important, DBS is also characterized by typical ocular abnormalities, such as high myopia, progressive vision loss, and buphthalmia,54 deficits we observed in the zebrafish mutant bugeye.
Supplementary Material
Acknowledgments
The authors thank Alan R. Adolph and Ishara Mill-Henry for their helpful suggestions and technical support.
Footnotes
Supported by National Institute of Health Grants EY000811 (JED) and F32 EY018044-01A2 (FE). JMS was a fellow of the Harvard College Research Program and was supported by a Mary Gordon Roberts Research Grant from the Mind, Brain, Behavior Program of Harvard University.
Disclosure: J.M. Stujenske, None; J.E. Dowling, None; F. Emran, None
References
- 1. Weinreb RN, Levin LA. Is neuroprotection a viable therapy for glaucoma? Arch Ophthalmol. 1999;117:1540–1544 [DOI] [PubMed] [Google Scholar]
- 2. Quigley HA, Broman AT. The number of people with glaucoma worldwide in 2010 and 2020. Br J Ophthalmol. 2006;90:262–267 [DOI] [PMC free article] [PubMed] [Google Scholar]
- 3. Resnikoff S, Pascolini D, Etay'ale D, et al. Global data on visual impairment in the year 2002. Bull World Health Organ. 2004;82:844–851 [PMC free article] [PubMed] [Google Scholar]
- 4. Coleman AL. Glaucoma. Lancet. 1999;354:1803–1810 [DOI] [PubMed] [Google Scholar]
- 5. Allingham RR, Liu Y, Rhee DJ. The genetics of primary open-angle glaucoma: a review. Exp Eye Res. 2009;88:837–844 [DOI] [PMC free article] [PubMed] [Google Scholar]
- 6. Sieving PA, Collins FS. Genetic ophthalmology and the era of clinical care. JAMA. 2007;297:733–736 [DOI] [PubMed] [Google Scholar]
- 7. Chihara E, Liu X, Dong J, et al. Severe myopia as a risk factor for progressive visual field loss in primary open-angle glaucoma. Ophthalmologica. 1997;211:66–71 [DOI] [PubMed] [Google Scholar]
- 8. Mitchell P, Hourihan F, Sandbach J, Wang JJ. The relationship between glaucoma and myopia: the Blue Mountains Eye Study. Ophthalmology. 1999;106:2010–2015 [DOI] [PubMed] [Google Scholar]
- 9. Leske MC, Connell AM, Wu SY, Hyman LG, Schachat AP. Risk factors for open-angle glaucoma. The Barbados Eye Study. Arch Ophthalmol. 1995;113:918–924 [DOI] [PubMed] [Google Scholar]
- 10. Quigley HA, Enger C, Katz J, Sommer A, Scott R, Gilbert D. Risk factors for the development of glaucomatous visual field loss in ocular hypertension. Arch Ophthalmol. 1994;112:644–649 [DOI] [PubMed] [Google Scholar]
- 11. Jonas JB, Budde WM. Optic nerve damage in highly myopic eyes with chronic open-angle glaucoma. Eur J Ophthalmol. 2005;15:41–47 [DOI] [PubMed] [Google Scholar]
- 12. Schmitt EA, Dowling JE. Early eye morphogenesis in the zebrafish, Brachydanio rerio. J Comp Neurol. 1994;344:532–542 [DOI] [PubMed] [Google Scholar]
- 13. Fadool JM, Dowling JE. Zebrafish: a model system for the study of eye genetics. Prog Retin Eye Res. 2008;27:89–110 [DOI] [PMC free article] [PubMed] [Google Scholar]
- 14. Portugues R, Engert F. The neural basis of visual behaviors in the larval zebrafish. Curr Opin Neurobiol. 2009;19:644–647 [DOI] [PMC free article] [PubMed] [Google Scholar]
- 15. Fleisch VC, Neuhauss SC. Visual behavior in zebrafish. Zebrafish. 2006;3:191–201 [DOI] [PubMed] [Google Scholar]
- 16. Veth KN, Willer JR, Collery RF, et al. Mutations in zebrafish lrp2 result in adult onset ocular pathogenesis that models myopia and other risk factors for glaucoma. PLoS Genet. 2011;7:e-1001310. [DOI] [PMC free article] [PubMed] [Google Scholar]
- 17. Westerfield M. The Zebrafish Book: A Guide for the Laboratory Use of Zebrafish. Portland, OR: University of Oregon Press; 2000 [Google Scholar]
- 18. Easter SS J, Nicola GN. The development of vision in the zebrafish (Danio rerio). Dev Biol. 1996;180:646–663 [DOI] [PubMed] [Google Scholar]
- 19. Wong KY, Gray J, Hayward CJC, Adolph AR, Dowling JE. Glutamatergic mechanisms in the outer retina of larval zebrafish: analysis of electroretinogram b- and d-waves using a novel preparation. Zebrafish. 2004;1:121–131 [DOI] [PubMed] [Google Scholar]
- 20. Li L, Dowling JE. A dominant form of inherited retinal degeneration caused by a non-photoreceptor cell-specific mutation. Proc Natl Acad Sci U S A. 1997;94:11645–11650 [DOI] [PMC free article] [PubMed] [Google Scholar]
- 21. Maaswinkel H, Li L. Spatio-temporal frequency characteristics of the optomotor response in zebrafish. Vision Res. 2003;43:21–30 [DOI] [PubMed] [Google Scholar]
- 22. Easter SS, Jr, Johns PR, Baumann LR. Growth of the adult goldfish eye, I: optic. Vision Res. 1977;17:469–477 [DOI] [PubMed] [Google Scholar]
- 23. Sivak JG. The refractive error of the fish eye. Vision Res. 1974;14:209–213 [DOI] [PubMed] [Google Scholar]
- 24. Raymond PA, Hitchcock PF, Palopoli MF. Neuronal cell proliferation and ocular enlargement in Black Moor goldfish. J Comp Neurol. 1988;276:231–238 [DOI] [PubMed] [Google Scholar]
- 25. Yew DT, Li WW, Au C, et al. Retinal changes in a mutant form of goldfish with megalophthalmia. Scanning Microsc. 1991;5:585–593 [PubMed] [Google Scholar]
- 26. Easter SS, Jr, Hitchcock PF. The myopic eye of the Black Moor goldfish. Vision Res. 1986;26:1831–1933 [DOI] [PubMed] [Google Scholar]
- 27. Yew DT, Li WW, Chan KH. Uptake of labelled proline in the degenerating retina of goldfish. Anat Anz. 1990;171:179–185 [PubMed] [Google Scholar]
- 28. Yew DT, Lai HW, Ma SA, Zhou L, Lam KW. Chromatographic identification of a biochemical alteration in the aqueous humour of megalophthalmic Black Moor goldfish. J Chromatogr B Biomed Sci Appl. 2001;751:349–355 [DOI] [PubMed] [Google Scholar]
- 29. Schlamp CL, Li Y, Dietz JA, Janssen KT, Nickells RW. Progressive ganglion cell loss and optic nerve degeneration in DBA/2J mice is variable and asymmetric. BMC Neurosci. 2006;66:1471–2202 [DOI] [PMC free article] [PubMed] [Google Scholar]
- 30. McKinnon SJ, Schlamp CL, Nickells RW. Mouse models of retinal ganglion cell death and glaucoma. Exp Eye Res. 2009;88:816–824 [DOI] [PMC free article] [PubMed] [Google Scholar]
- 31. John SW. Mechanistic insights into glaucoma provided by experimental genetics: The Cogan lecture. Invest Ophthalmol Vis Sci. 2005;46:2649–2661 [DOI] [PubMed] [Google Scholar]
- 32. John SW, Smith RS, Savinova OV, et al. Essential iris atrophy, pigment dispersion, and glaucoma in DBA/2J mice. Invest Ophthalmol Vis Sci. 1998;39:951–962 [PubMed] [Google Scholar]
- 33. Hitchcock PF, Raymond PA. Retinal regeneration. Trends Neurosci. 1992;15:103–108 [DOI] [PubMed] [Google Scholar]
- 34. Sperry RW. Patterning of central synapses in regeneration of the optic nerve in teleosts. Physiol Zool. 1948;21:351–361 [DOI] [PubMed] [Google Scholar]
- 35. Murray M. Regeneration of retinal axons into the goldfish optic tectum. J Comp Neurol. 1976;168:175–195 [DOI] [PubMed] [Google Scholar]
- 36. Zhou LX, Wang ZR. Changes in number and distribution of retinal ganglion cells after optic nerve crush in zebrafish (in Chinese). Shi Yan Sheng Wu Xue Bao. 2002;35:159–162 [PubMed] [Google Scholar]
- 37. Vidal-Sanz M, Villegas-Perez MP, Bray GM, Aguayo AJ. Persistent retrograde labeling of adult rat retinal ganglion cells with the carbocyanine dye diI. Exp Neurol. 1988;102:92–101 [DOI] [PubMed] [Google Scholar]
- 38. Berkelaar M, Clarke DB, Wang YC, Bray GM, Aguayo AJ. Axotomy results in delayed death and apoptosis of retinal ganglion cells in adult rats. J Neurosci. 1994;14:4368–4374 [DOI] [PMC free article] [PubMed] [Google Scholar]
- 39. Quigley HA, Hohman RM, Sanchez R, Addicks EM. Optic nerve head blood flow in chronic experimental glaucoma. Arch Ophthalmol. 1985;103:956–962 [DOI] [PubMed] [Google Scholar]
- 40. Alarcon-Martinez, Aviles-Trigueros M, Galindo-Romero C, et al. ERG changes in albino and pigmented mice after optic nerve transection. Vision Res. 2010;50:2176–2187 [DOI] [PubMed] [Google Scholar]
- 41. Kameya S, Araki E, Katsuki M, et al. Dp260 disrupted mice revealed prolonged implicit time of the b-wave in ERG and loss of accumulation of beta-dystroglycan in the outer plexiform layer of the retina. Hum Mol Genet. 1997;6:2195–2203 [DOI] [PubMed] [Google Scholar]
- 42. Raz D, Perlman I, Percicot CL, Lambrou GN, Ofri R. Functional damage to inner and outer retinal cells in experimental glaucoma. Invest Ophthalmol Vis Sci. 2003;44:3675–3684 [DOI] [PubMed] [Google Scholar]
- 43. Hasegawa S, Takagi M, Usui T, Takada R, Abe H. Waveform changes of the first-order multifocal electroretinogram in patients with glaucoma. Invest Ophthalmol Vis Sci. 2000;41:1597–1603 [PubMed] [Google Scholar]
- 44. Raz D, Seeliger MW, Geva GB, Pericot CL, Lambrou GN, Ofri R. The effect of contrast and luminance on mfERG responses in a monkey model of glaucoma. Invest Ophthalmol Vis Sci. 2002;43:2027–2035 [PubMed] [Google Scholar]
- 45. Ofri R, Raz D, Kass PH, Lambrou GN, Percicot CL. The effect of 0.12% unoprostone isopropyl (rescula) on intraocular pressure in normotensive dogs. J Vet Med Sci. 2000;62:1313–1315 [DOI] [PubMed] [Google Scholar]
- 46. Nork TM, VerHoeve JN, Poulsen GN, et al. Swelling and loss of photoreceptors in chronic human and experimental glaucomas. Arch Ophthalmol. 2000;118:235–245 [DOI] [PubMed] [Google Scholar]
- 47. Fazio DT, Heckenlively JR, Martin DA, Christensen RE. The electroretinogram in advanced open-angle glaucoma. Doc Ophthalmol. 1986;63:45–54 [DOI] [PubMed] [Google Scholar]
- 48. Harrison JM, O'Connor PS, Young RSL, Kincaid M, Bentley R. The pattern ERG in man following surgical resection of the optic nerve. Invest Ophthalmol Vis Sci. 1987;28:429–499 [PubMed] [Google Scholar]
- 49. Korth M, Nguyen NX, Horn F, Martus P. Scotopic threshold response and scotopic PII in glaucoma. Invest Ophthalmol Vis Sci. 1994;35:619–625 [PubMed] [Google Scholar]
- 51. Christensen EI, Birn H. Megalin and cubilin: multifunctional endocytic receptors. Nat Rev Mol Cell Biol. 2002;3:256–266 [DOI] [PubMed] [Google Scholar]
- 52. Fisher CE, Howie SE. The role of megalin (LRP-2/Gp330) during development. Dev Biol. 2006;296:279–297 [DOI] [PubMed] [Google Scholar]
- 53. McCarthy RA, Argraves WS. Megalin and the neurodevelopmental biology of sonic hedgehog and retinol. J Cell Sci. 2003;116:955–960 [DOI] [PubMed] [Google Scholar]
- 53. Kantarci S, Al-Gazali L, Hill RS, et al. Mutations in LRP2, which encodes the multiligand receptor megalin, cause Donnai-Barrow and facio-oculo-acoustico-renal syndromes. Nat Genet. 2007;39:957–959 [DOI] [PMC free article] [PubMed] [Google Scholar]
- 54. Donnai D, Barrow M. Diaphragmatic hernia, exomphalos, absent corpus callosum, hypertelorism, myopia, and sensorineural deafness: a newly recognized autosomal recessive disorder? Am J Med Genet. 1993;47:679–682 [DOI] [PubMed] [Google Scholar]
Associated Data
This section collects any data citations, data availability statements, or supplementary materials included in this article.