The authors assessed crush-injured retinal ganglion cell axons using in vivo diffusion tensor imaging.
Abstract
Purpose.
Diffusion tensor imaging (DTI) measures the random motion of water molecules reflecting central nervous system tissue integrity and pathology. Glaucoma damages retinal ganglion cells (RGCs) and their axons. The authors hypothesized that DTI-derived axonal and myelin injury biomarkers may be used to detect early axonal damage and may be correlated with RGC loss in the mouse model of optic nerve crush (ONC).
Methods.
The progression of RGC axon degeneration was quantitatively assessed with DTI in vivo, corroborated with axon/myelin immunohistochemical staining and retrograde fluorogold labeling in mice after ONC.
Results.
Decreased axial diffusivity (λ‖) and relative anisotropy (RA) of damaged axons were observed from 6 hours to 14 days, reflecting axonal injury. DTI detected axonal injury at 6 hours after ONC when SMI-31 did not detect axonal abnormality. Both decreased λ‖, and SMI-31 identified axon damage at 3 days after ONC. Decreased λ‖ correlated with reduced SMI-31–positive axon counts from 3 days after ONC. In contrast, the increased λ⊥ was seen only in the distal segment of optic nerve whereas decreased myelin basic protein-positive axon counts were seen in all segments 3 days after ONC. The number of retrograde-labeled RGCs did not decline significantly until 7 days after ONC. There was a significant correlation between RGC loss and optic nerve axon damage.
Conclusions.
The authors demonstrated that in vivo DTI detected axonal injury earlier than SMI-31. Results suggest that in vivo DTI of optic nerve injury may be used as a noninvasive tool for assessing the pathogenesis of RGC axonal injury.
Glaucoma is a leading cause of blindness worldwide.1 The pathophysiology of glaucomatous optic neuropathy is still not well understood. Studies have proposed that the visual field defects in glaucoma may be secondary to retinal ganglion cell (RGC) axon loss.2 Whether the site of primary damage is the retinal ganglion cell body or the axon remains debated. Recent studies suggest that the optic nerve axon or the visual pathway degeneration may be the initial site leading to RGC loss in an animal glaucoma model.3–5 A large body of evidence also supports the notion that the interplay between axon-neuron damage and degeneration plays an important role in the progression of neurodegenerative disease.6
Current clinical management of glaucoma includes parametric evaluation of the visual field or imaging of the optic disc/nerve fiber layer. These clinical practices may not be sufficient for direct assessments of damaged retinal ganglion cells (RGCs) and their axons in glaucoma or other neurodegenerative diseases. Thus, there remains a need for noninvasive imaging methods to better understand these pathologic processes to facilitate the development of more effective therapies.
Diffusion tensor imaging (DTI) has been proposed as a noninvasive method to directly visualize and characterize axonal injury.7,8 Previous reports have demonstrated that decreased axial diffusivity (λ‖, describes water molecule diffusion parallel to axonal fibers) is associated with axonal injury and dysfunction; the increased radial diffusivity (λ⊥, describes water molecule diffusion perpendicular to axonal fibers) is associated with myelin injury. This concept has seen its applications to accurately detect the underlying axonal injury in mouse models7,9,10 and human patients.11 The application of this approach to assess chronic optic nerve degeneration in rats12,13 and humans14 with glaucoma has also been reported. To date, this technique has not been fully applied to examine the correlation between optic nerve axonal injury and retinal neuron degeneration.
In this study, we chose an optic nerve crush (ONC) mouse model to examine optic neuropathy in vivo. The ONC rodent model has been widely used in studying RGC axon degeneration and the pathophysiology of glaucoma as well as other optic neuropathies.15–18 This study sought to determine the relationship between in vivo DTI parameters and histopathology in mouse optic nerve axons after injury. The optic nerve provides an excellent model in which to study directional diffusion because optic nerve axons are pure white matter tracts running in parallel without significant crossing. In the present study, in vivo DTI was used to longitudinally assess the progression of damaged optic nerve in mice after ONC. The observed changes of DTI parameters were correlated with histology-determined RGC axon damage. Our results demonstrated the feasibility of DTI for early detection and longitudinal assessment of optic neuropathy in vivo.
Methods
Mouse Model of Optic Nerve Crush
Female C57BL/6 mice at 8 to 12 weeks of age were purchased from the Jackson Laboratory (Bar Harbor, ME). All animal experiments were performed according to protocols approved by the Animal Studies Committee at Washington University and in accordance with the ARVO Statement for the Use of Animals in Ophthalmic and Vision Research.
Mice were anesthetized by intraperitoneal injection of a cocktail containing ketamine (80 mg/kg) and xylazine (10 mg/kg). The conjunctiva of one eye was incised. The optic nerve was surgically exposed by blunt dissection under an operating microscope. The right nerve was crushed approximately 1 mm behind the globe for 20 seconds using jeweler's forceps. Special care was taken to avoid damaging the central retinal artery. The left eye served as the sham-operation control in which the surgery was performed without crushing the optic nerve.
Diffusion Tensor Imaging and Data Analyses
In vivo DTI was performed on two groups of ONC animals. The first group (n = 5) underwent longitudinal examination to determine the time course of axonal and myelin injury at 6 hours and at 3, 7, 14, and 28 days after ONC. The second group (n = 3 for each time point) underwent cross-sectional DTI measurement followed by histologic analysis. For MRI scans, mice were anesthetized using isoflurane/oxygen (5% for induction and 1% for maintenance) delivered through a custom nose cone. The anesthetized mice were placed in a custom-made holder designed to immobilize the head. A circular surface coil with a 1.5-cm outer diameter was placed on top of the head to serve as the receiver for the MRI signal. The entire apparatus was placed in a custom-made cradle permitting the mouse to be placed at the center of the magnet inside a 9-cm inner diameter Helmholtz coil (the radio frequency transmit coil). This arrangement was positioned in a second cradle that fits into a 4.7-T, 33-cm clear bore magnet (Oxford Instruments, Oxfordshire, UK) equipped with a 15-cm inner diameter, actively shielded gradient coil (18 G/cm, 200-μs rise time) interfaced and controlled by a spectrometer (Unity-Inova; Varian, Palo Alto, CA).
A conventional, multislice, spin-echo imaging sequence, modified by the addition of the Stejskal-Tanner diffusion sensitizing gradient pair, was used for acquiring the required series of diffusion-weighted images (DWI) with repetition period (TR) 1.5 seconds, spin-echo time (TE) 50 ms, time between application of gradient pulses (Δ) 25 ms, diffusion gradient duration (δ) 8 ms, slide thickness 0.4 mm, field of view 3 cm, and data matrix 192 × 192 (zero filled to 512 × 512). Diffusion-sensitizing gradients were applied along six directions: [Gx, Gy, Gz] = [1,1,0], [1,0,1], [0,1,1], [−1,1,0], [0,−1,1], and [1,0,−1]. The two diffusion-sensitizing factors, or b values, used for acquisition of the diffusion-weighted images were 0 and 765 s/mm2. The DTI data set of each mouse was obtained with an acquisition time of 2 hours.
On a pixel-by-pixel basis, quantitative indices including axial diffusivity (λ‖), radial diffusivity (λ⊥), and relative anisotropy (RA) were derived using a program written with a computing software (MatLab; MathWorks, Natick, MA). Three eigenvalues (λ1, λ2, λ3) were calculated from the diffusion tensor matrix diagnolization. Mean diffusivity (D) was calculated as D = (λ1 + λ2 + λ3)/3. Axial diffusivity was defined as λ‖ = λ1. Radial diffusivity was defined as λ⊥ = (λ2 + λ3)/2. RA was calculated as
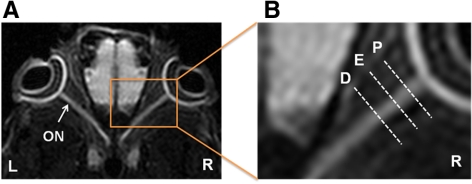
The optic nerve region of interest (ROI) was defined from globe to optic chiasm for quantitative DTI and histologic analysis. The proximal segment was at approximately 300 to 600 μm posterior to the globe, the epicenter segment was approximately 900 to 1100 μm (ONC site at approximately 1000 μm), and the distal segment was at 1200 to 1600 μm. The definition of ROI is shown at the DWI from a control mouse (Fig. 1). In vivo DTI parameters were quantitatively analyzed using the defined ROI.
Figure 1.
Defining ROI in a control DWI map. Both eyeballs (L, left eye; R, right eye) and optic nerves (ON) are clearly seen in DWI. The ROI is defined as follows: proximal (P), 300 to 600 μm posterior to the globe; epicenter (E), approximately 900 to 1100 μm from the globe; distal (D), 1200 to 1600 μm posterior to the globe.
Histologic Analysis
On the completion of MRI scans, mice were deeply anesthetized and perfusion fixed through the left cardiac ventricle with 4% paraformaldehyde in 0.1 M phosphate-buffered saline (PBS, pH 7.4). After perfusion, the eyes were enucleated. The retinas were dissected and flat-mounted on glass slides for FluoroGold-labeled RGC counting. The optic nerve was isolated and fixed in 4% paraformaldehyde after MRI scans. Isolated optic nerves were embedded in paraffin and sectioned to be 5-μm thick. The cross-sectional optic nerve reacted with primary antibodies against SMI-31 (1:5000 dilution; Sternberger Monoclonals, Baltimore, MD) and myelin basic protein (MBP; 1:1000 dilution; Sigma, St. Louis, MO) were further reacted with the appropriate secondary antibodies at room temperature. The results were observed on a microscope (80i; Nikon Inc, Melville, NY). Intact axons were quantified by counting SMI-31–positive axons. The MBP-positive axons were also counted. The positive axon/myelin stains were quantified for each optic nerve in a blinded fashion (MetaMorph; MathWorks).
To correlate RGC integrity with the extent of axonal injury assessed by in vivo DTI, retrograde labeling of retinal ganglion cells was performed as previously described.19 Briefly, 1.5 μL of a 3% FluoroGold (Fluorochrome, Inc., Englewood, CO) in saline was injected into the superior colliculi of anesthetized mice immobilized in a stereotaxic apparatus. FluoroGold was taken up bilaterally by the RGC axon terminals and transported retrogradely to their somata in the retina. The loaded marker persisted for at least 4 weeks without significant fading or leakage. ONC was performed 1 week after application of the tracer. At various times after ONC, the retinal flat-mounts were prepared as described. RGCs in the retina from four fields of central retina and four fields of peripheral retina were captured at 40× magnification using fluorescence microscopy.20 Quantification of fluorescent RGCs was performed using image analysis software (MetaMorph; MathWorks). Counting was performed in a blinded fashion.
Statistical Analysis
Statistical analyses were performed using SAS software (SAS Institute, Cary, NC). For comparisons between two experimental groups, one-way ANOVA was used to test the difference in RA, axial diffusivity, and radial diffusivity among all segments and all groups of mice at all time points. Student's t-test was used to test the difference of histologic parameters between experimental and control groups. Correlation between DTI parameters and histologic data were examined using Pearson's correlation coefficients. Linear regression was performed to determine the correlation among axial diffusivity, RA, SMI-31, radial diffusivity, and MBP. In all cases, P < 0.05 was accepted as a statistically significant difference.
Results
In Vivo DTI Evaluation of Optic Nerve Axonal Injury
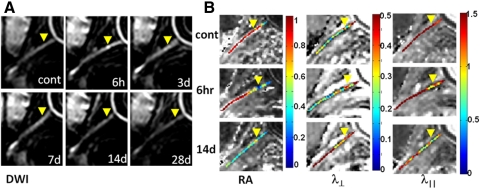
Optic nerves were readily recognized in the in vivo DWI and diffusion tensor parameter maps after ONC (Fig. 2). The control optic nerve was hyperintense in DWI (Fig. 2A). Six hours after ONC, the epicenter appeared brighter than the normally hyperintense optic nerve, reflecting decreased diffusion resulting from crush injury. Also consistent was the decreased RA and λ‖ at the epicenter. At 14 days after ONC, decreased RA and λ‖ extended to the entire injured nerve, suggestive of spreading axon damage. Increased λ⊥ was seen at 14 days at the distal site, suggestive of myelin damage (Fig. 2B).
Figure 2.
Serial in vivo diffusion MRI of the crushed optic nerve from a mouse (A, DWI; B, DTI maps). Yellow arrowheads: epicenter. The optic nerve is hyperintense in DWI (A). Increased intensity is seen at the epicenter 6 hours after ONC. Optic nerve ROI was defined based on the DWI (Fig. 1). Significantly decreased RA resulting from the axonal injury extended the entire ON at 14 days (B). Progressive myelin damage reflected as the increased λ⊥ is also clearly demonstrated (B). Decreased λ‖ indicative of axonal injury after ONC clearly identified the epicenter (B). Image scales are as follow: RA, 0.0–1.0 (no unit); λ⊥, 0.0–0.5 (μm2/ms); λ‖, 0.0–1.5 (μm2/ms).
In Vivo DTI Quantification of the Damaged Optic Nerve
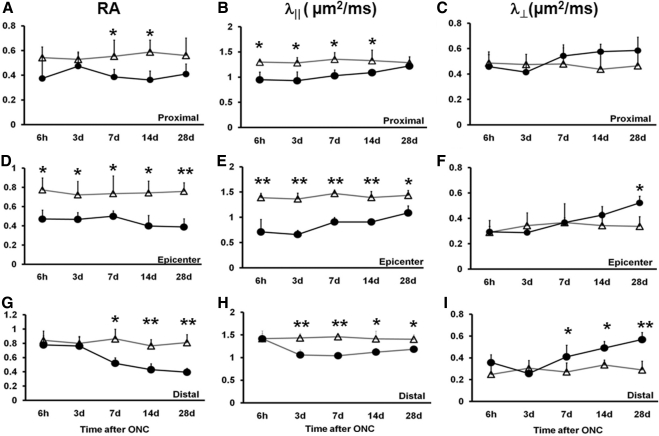
The longitudinal in vivo DTI parameters were quantitatively analyzed using ROI analysis (Fig. 3). At the proximal site (Fig. 3A), RA decreased by 30% (P < 0.05) beginning at 7 days. At the epicenter (Fig. 3D), decreased RA was seen at all time points by approximately 30% to 50% (P < 0.05). Distally (Fig. 3G), RA decreased by 40%, 44%, and 52% at 7, 14, and 28 days (P < 0.01) after injury. Proximally (Fig. 3B), significantly decreased axial diffusivity was seen as early as 6 hours (by 27%, P < 0.05) after ONC compared with the control. The extent of decreased axial diffusivity was maintained for 2 weeks by 28% (P < 0.05, 3 days), 24% (P < 0.05, 7 days), and 18% (P < 0.05,14 days) and increased toward the control value at 28 days after ONC (insignificantly decreased by 5%; P > 0.05). The more significantly decreased axial diffusivity was observed in the epicenter (Fig. 3E) compared with the control nerve by 49%, 52%, 41%, 35%, and 24% at 6 hours and at 3, 7, 14, and 28 days after ONC (P < 0.01 at all time points). Distally (Fig. 3H), axial diffusivity did not change at 6 hours after ONC. Statistically significant decreases were evident beginning at 3 days after ONC (by 26%; P < 0.05) and continued by 29% (P < 0.05, 7 days), 21% (P < 0.05, 14 days), and 16% (P < 0.05, 28 days). Radial diffusivity did not change at the proximal ROI (Fig. 3C). In the epicenter (Fig. 3F), the only significant change was seen at 28 days after ONC (55%, P < 0.05). Distally (Fig. 3I), radial diffusivity progressively increased (by 50%, 46%, and 100% at 7, 14, and 28 days after ONC; P < 0.05).
Figure 3.
The time course of DTI parameters measured from longitudinal analysis of crush-injured optic nerves (circles) and uninjured optic nerves (triangles). RA, λ‖, and λ⊥ of proximal, epicenter, and distal ROI are displayed as mean ± SD (n = 5). At the proximal site, the RA value decreased from day 7 (A), λ‖ values significantly decreased from 6 hours (B), and λ⊥ increased around day 14 (C). At the epicenter, significant decreases in RA and λ‖ were seen at all time points (D, E). Significantly increased λ⊥ was seen only at 28 days (F). At the distal site, a changed RA value was observed from day 7 (G), significantly decreased λ‖ started at day 3 (H), and λ⊥ was significantly increased at day 7 (I). Statistical differences indicated in relation to control group: *P < 0.05, **P < 0.01, two-way ANOVA.
Histologic Evaluation of RGC Axon Damage
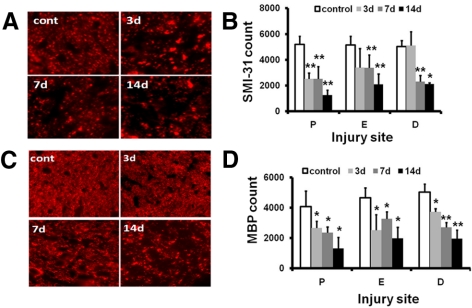
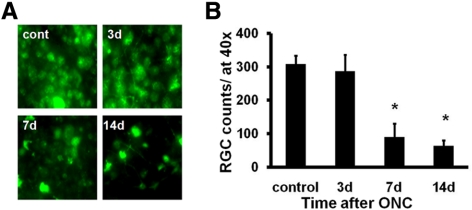
Axon damage was evaluated using immunohistochemistry staining of SMI-31 (for phosphorylated heavy neurofilament subunit) and MBP after in vivo DTI. The optic nerve was sectioned using the globe as the reference to match image ROI locations. Decreased SMI-31 staining exhibited a trend similar to that of axial diffusivity with a clear sign of axonal injury at the proximal site and epicenter 3 days after ONC (Figs. 4A, 4B). Delayed axonal injury at the distal site was also reflected by the loss of SMI-31 staining beginning at 7 days after ONC. MBP staining revealed significantly decreased myelinated axon staining in the injured optic nerves (Figs. 4C, 4D). No staining was observed when the primary antibodies were omitted (data not shown). Next, we evaluated RGC loss with retrograde FG labeling. Representative images of FG-labeled ganglion cell soma indicate significant losses of RGCs by 70% and 79% at 7 and 14 days after ONC compared with the control nerve (Figs. 5A, 5B).
Figure 4.
Immunohistochemistry of SMI-31 and MBP of the control and the crush-injured optic nerves. (A) SMI-31 of proximal optic nerve cross-sections from control (cont) and ONC injury mice at 3, 7, and 14 days. (B) Quantitative SMI-31–positive axon counts of the optic nerve at proximal (P), crushed epicenter (E), and distal (D) sites. (C) MBP of the proximal optic nerve cross-sections from the control (cont) and ONC-injured mice at 3, 7, and 14 days after injury. (D) Quantitative MBP-positive axon counts at the three selected sites. The timing of myelin injury reflected as loss of MBP-positive axon counts is similar to that of SMI-31. *P < 0.05, **P < 0.01. Magnification, 60×.
Figure 5.
RGCs were retrogradely labeled with FG a week before ONC. Flat-mount retinas, at 40× magnification, were examined at 3, 7, and 14 days after ONC (A). Quantitative estimation of the remaining RGCs was performed after ONC using fluorescence microscopy (mean ± SEM; n = 3 for each experimental group; B). Crush injury induced a significant loss of RGCs at both 7 and 14 days after ONC. *P < 0.05.
Correlation of Retinal Ganglion Cell Loss and Optic Nerve Axon Damage
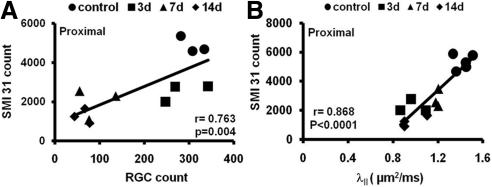
We examined the relationship between RGC loss and axonal injury after ONC. The SMI-31–positive axon counts at the proximal site correlated strongly with FG-labeled RGC counts (r = 0.76; P = 0.004; Fig. 6A). We investigated whether the changes in DTI parameters correlated with the severity of axonal injury. Axial diffusivity and axonal injury were compared at the proximal site. There was a significant correlation between axial diffusivity and SMI-31–positive axon counts at the proximal site (r = 0.87; P < 0.0001; Fig. 6B).
Figure 6.
Correlations of the SMI-31 counts with RGC loss (A) and axial diffusivity (B) after ONC. FG-labeled RGC counts correlated with the numbers of SMI-31–stained axons. Axial diffusivity also correlated with SMI-31 axon counts at the proximal site.
Discussion
In this study, DTI was applied to assess retinal ganglion cell axon degeneration in mice after ONC. We found that DTI accurately detected the progression of optic nerve injury in vivo, consistent with our previous findings in mouse models and human optic neuritis.7,8,21,22 The noninvasive biomarker of axonal injury (i.e., decreased axial diffusivity) detected axon damage as early as 6 hours after injury, consistent with the findings of our previous report on mouse spinal cord injury.23 Based on the results presented in this study, we suggest that the damaged RGC axon measured using axial diffusivity may be used as an indicator of subsequent retinal ganglion cell body loss.
Axonal injury occurs in many neurologic diseases, such as spinal cord trauma and multiple sclerosis, and is considered a predictor of progressive neuron degeneration.24,25 In optic neuropathy such as glaucoma, recent histologic studies suggest that damage to the optic nerve axon and visual pathway may precede RGC loss.3–5 In this study we examined the timing and progression of damaged RGC axons using DTI and histology. The time course of DTI-determined axonal injury after 3 days in our studies correlated well with the loss of phosphorylated neurofilament (SMI-31, axon integrity marker). SMI-31 was downregulated 3 days after ONC at the proximal segment and was observed at the distal segment from days 7 to 14 after ONC. The immunohistochemistry-detected axonal injury (decreased SMI-31–positive axon counts) in the current ONC model followed the in vivo axial diffusivity decreases seen at 6 hours after ONC at the proximal segment and epicenter.
We have hypothesized and demonstrated that decreased axial diffusivity reflects axonal injury and that increased radial diffusivity reflects myelin injury in a retinal ischemia model and various animal models.7,8,10,21,23,26,27 However, the previously observed correlation of increased radial diffusivity with demyelination was not seen in the current ONC model (data not shown). MBP staining of the damaged optic nerve was not specifically correlated with the radial diffusivity in the crush mice. Although the exact mechanism remains unclear, the lack of specificity in this injury model may be confounded by the presence of reactive gliosis, cell proliferation, and inflammatory response in addition to axonal injury, similarly observed by other groups.28,29
Use of imaging methods to identify RGC axon damage is desirable for a better understanding of the mechanisms underlying optic neuropathy. Our aim in this study was to assess the timing of axonal injury and its correlation with RGC after optic nerve injury. We detected considerable RGC loss at day 7, following the axon damage detected by SMI-31 at day 3, which in turn followed the decreased axial diffusivity at 6 hours after ONC. This is consistent with the fact that the injury began at the RGC axon. Results of our previous studies7 in the mouse model of retinal ischemia indicated that 3 days after retinal ischemia, axial diffusivity decreased by 50%. The in vivo DTI–detected axonal injury correlated with histologic findings of significant loss of SMI-31–positive axon counts. Selles-Navarro et al.30 have reported a time course in the rat retinal ischemia model, with progressive RGC loss of 20% and 40% at 5 and 7 days, respectively. Results by Selles-Navarro et al.30 and our previous mouse retinal ischemia findings7 suggest that the axial diffusivity–detected axon damage occurred earlier than the reported RGC loss. The current finding is in line with findings of previous studies of optic neuropathy in a glaucoma model,3–5 suggesting that axon damage could lead to RGC body loss. With the use of an in vivo fluorescence imaging technique, rapid axon loss was also detected within 6 hours at proximal sites after ONC.31
In glaucoma patients, increased IOP and decreased optic nerve head blood flow have traditionally been considered to affect visual neurons from RGCs to the major vision center of the brain.2,32 Recent literature3–5 suggests that damaged visual neurons in a glaucoma model may result from high IOP–impaired axon structure, leading to retrograde RGC degeneration; this is known as the axonopathy hypothesis.25 Our DTI and histology results suggest a plausible “dying-back” or “retrograde degeneration mechanism” implying that axonal injury occurs earlier than RGC loss in mouse models of ONC. To validate the axonopathy hypothesis in glaucoma, further experiments would be needed to measure RGC axonal and retinal injury using in vivo DTI in rodents of elevated IOP.
In conclusion, in vivo DTI may provide an effective and noninvasive method with which to detect RGC axon loss during the progression of optic neuropathy. DTI may be used to assess the efficacy of various therapeutic interventions in animal models of glaucoma.
Acknowledgments
The authors thank Joong Hee Kim and colleagues at the Biomedical MR Laboratory for helpful discussions, and Bill Coleman and Marlene Scott for technical assistance.
Footnotes
Supported in part by National Institutes of Health Grants P01-NS 059560, R01NS047592, and R01NS 05194.
Disclosure: X. Zhang, None; P. Sun, None; J. Wang, None; Q. Wang, None; S.-K. Song, None
References
- 1. Quigley HA, Broman AT. The number of people with glaucoma worldwide in 2010 and 2020. Br J Ophthalmol. March 2006. 2006;90(3):262–267 [DOI] [PMC free article] [PubMed] [Google Scholar]
- 2. Quigley HA, Dunkelberger GR, Green WR. Retinal ganglion cell atrophy correlated with automated perimetry in human eyes with glaucoma. Am J Ophthalmol. 1989;107(5):453–464 [DOI] [PubMed] [Google Scholar]
- 3. Buckingham BP, Inman DM, Lambert W, et al. Progressive ganglion cell degeneration precedes neuronal loss in a mouse model of glaucoma. J Neurosci. 2008;28(11):2735–2744 [DOI] [PMC free article] [PubMed] [Google Scholar]
- 4. Crish SD, Sappington RM, Inman DM, Horner PJ, Calkins DJ. Distal axonopathy with structural persistence in glaucomatous neurodegeneration. Proc Natl Acad Sci U S A. 2010;107(11):5196–5201 [DOI] [PMC free article] [PubMed] [Google Scholar]
- 5. Schlamp CL, Li Y, Dietz JA, Janssen KT, Nickells RW. Progressive ganglion cell loss and optic nerve degeneration in DBA/2J mice is variable and asymmetric. BMC Neurosci. 2006;7:66. [DOI] [PMC free article] [PubMed] [Google Scholar]
- 6. Raff MC, Whitmore AV, Finn JT. Axonal self-destruction and neurodegeneration. Science. 2002;296(5569):868–871 [DOI] [PubMed] [Google Scholar]
- 7. Song SK, Sun SW, Ju WK, Lin SJ, Cross AH, Neufeld AH. Diffusion tensor imaging detects and differentiates axon and myelin degeneration in mouse optic nerve after retinal ischemia. Neuroimage. 2003;20(3):1714–1722 [DOI] [PubMed] [Google Scholar]
- 8. Kim JH, Loy DN, Liang H-F, Trinkaus K, Schmidt RE, Song S-K. Noninvasive diffusion tensor imaging of evolving white matter pathology in a mouse model of acute spinal cord injury. Magn Reson Med. 2007;58(2):253–260 [DOI] [PubMed] [Google Scholar]
- 9. Song SK, Kim JH, Lin SJ, Brendza RP, Holtzman DM. Diffusion tensor imaging detects age-dependent white matter changes in a transgenic mouse model with amyloid deposition. Neurobiol Dis. 2004;5(3):640–64704 [DOI] [PubMed] [Google Scholar]
- 10. Song SK, Yoshino J, Le TQ, et al. Demyelination increases radial diffusivity in corpus callosum of mouse brain. Neuroimage. 2005;26(1):132–140 [DOI] [PubMed] [Google Scholar]
- 11. Ashtari M, Cervellione KL, Hasan KM, et al. White matter development during late adolescence in healthy males: a cross-sectional diffusion tensor imaging study. Neuroimage. 2007;35(2):501–510 [DOI] [PubMed] [Google Scholar]
- 12. Hui ES, Fu QL, So KF, Wu EX. Diffusion tensor MR study of optic nerve degeneration in glaucoma. Conf Proc IEEE Eng Med Biol Soc. 2007:4312–4315 [DOI] [PubMed] [Google Scholar]
- 13. Chan KC, Fu Q-l, Hui ES, So K-f, Wu EX. Evaluation of the retina and optic nerve in a rat model of chronic glaucoma using in vivo manganese-enhanced magnetic resonance imaging. NeuroImage. 2008;40(3):1166–1174 [DOI] [PubMed] [Google Scholar]
- 14. Garaci FG, Bolacchi F, Cerulli A, et al. Optic nerve and optic radiation neurodegeneration in patients with glaucoma: in vivo analysis with 3-T diffusion-tensor MR imaging. Radiology. 2009;252(2):496–501 [DOI] [PubMed] [Google Scholar]
- 15. Mabuchi F, Aihara M, Mackey MR, Lindsey JD, Weinreb RN. Regional optic nerve damage in experimental mouse glaucoma. Invest Ophthalmol Vis Sci. 2004;45(12):4352–4358 [DOI] [PubMed] [Google Scholar]
- 16. Mackenzie P, Cioffi G. How does lowering of intraocular pressure protect the optic nerve? Surv Ophthalmol. 2008;53(suppl. 1):S39–S43 [DOI] [PubMed] [Google Scholar]
- 17. Schwartz M. Optic nerve crush: protection and regeneration. Brain Res Bull. 2004;62(6):467–471 [DOI] [PubMed] [Google Scholar]
- 18. Goldblum D, Mittag T. Prospects for relevant glaucoma models with retinal ganglion cell damage in the rodent eye. Vis Res. 2002;42(4):471–478 [DOI] [PubMed] [Google Scholar]
- 19. Zhang X, Cheng M, Chintala SK. Kainic acid-mediated upregulation of matrix metalloproteinase-9 promotes retinal degeneration. Invest Ophthalmol Vis Sci. 2004;45(7):2374–2383 [DOI] [PubMed] [Google Scholar]
- 20. Barnett EM, Zhang X, Maxwell D, Chang Q, Piwnica-Worms D. Single-cell imaging of retinal ganglion cell apoptosis with a cell-penetrating, activatable peptide probe in an in vivo glaucoma model. Proc Natl Acad Sci U S A. 2009;106(23):9391–9396 [DOI] [PMC free article] [PubMed] [Google Scholar]
- 21. Budde MD, Xie M, Cross AH, Song S-K. Axial diffusivity is the primary correlate of axonal injury in the experimental autoimmune encephalomyelitis spinal cord: a quantitative pixelwise analysis. J Neurosci. 2009;29(9):2805–2813 [DOI] [PMC free article] [PubMed] [Google Scholar]
- 22. Naismith RT, Xu J, Tutlam NT, et al. Disability in optic neuritis correlates with diffusion tensor-derived directional diffusivities. Neurology. 2009;72(7):589–594 [DOI] [PMC free article] [PubMed] [Google Scholar]
- 23. Kim JH, Loy DN, Wang Q, et al. Diffusion tensor imaging at 3 hours after traumatic spinal cord injury predicts long-term locomotor recovery. J Neurotrauma. 2010;27(3):587–598 [DOI] [PMC free article] [PubMed] [Google Scholar]
- 24. Medana IM, Esiri MM. Axonal damage: a key predictor of outcome in human CNS diseases. Brain. 2003;126(3):515–530 [DOI] [PubMed] [Google Scholar]
- 25. Coleman M. Axon degeneration mechanisms: commonality amid diversity. Nat Rev Neurosci. 2005;6:889–898 [DOI] [PubMed] [Google Scholar]
- 26. Song SK, Sun SW, Ramsbottom MJ, Chang C, Russell J, Cross AH. Dysmyelination revealed through MRI as increased radial (but unchanged axial) diffusion of water. Neuroimage. 2002;17(3):1429–1436 [DOI] [PubMed] [Google Scholar]
- 27. Sun S-W, Liang H-F, Schmidt RE, Cross AH, Song S-K. Selective vulnerability of cerebral white matter in a murine model of multiple sclerosis detected using diffusion tensor imaging. Neurobiol Dis. 2007;28(1):30–38 [DOI] [PMC free article] [PubMed] [Google Scholar]
- 28. MacDonald CL, Dikranian K, Song SK, Bayly PV, Holtzman DM, Brody DL. Detection of traumatic axonal injury with diffusion tensor imaging in a mouse model of traumatic brain injury. Exp Neurol. 2007;205(1):116–131 [DOI] [PMC free article] [PubMed] [Google Scholar]
- 29. Zhang J, Jones M, DeBoy CA, et al. Diffusion tensor magnetic resonance imaging of Wallerian degeneration in rat spinal cord after dorsal root axotomy. J Neurosci. 2009;29(10):3160–3171 [DOI] [PMC free article] [PubMed] [Google Scholar]
- 30. Selles-Navarro I, Villegas-Perez MP, Salvador-Silva M, Ruiz-Gomez JM, Vidal-Sanz M. Retinal ganglion cell death after different transient periods of pressure-induced ischemia and survival intervals: a quantitative in vivo study. Invest Ophthalmol Vis Sci. 1996;37(10):2002–2014 [PubMed] [Google Scholar]
- 31. Knoferle J, Koch JC, Ostendorf T, et al. Mechanisms of acute axonal degeneration in the optic nerve in vivo. Proc Natl Acad Sci U S A. 2010;107(13):6064–6069 [DOI] [PMC free article] [PubMed] [Google Scholar]
- 32. Dahlmann-Noor AH, Vijay S, Limb GA, Khaw PT. Strategies for optic nerve rescue and regeneration in glaucoma and other optic neuropathies. Drug Discov Today. 2010;15(7–8):287–299 [DOI] [PubMed] [Google Scholar]


