The present results suggest that downregulation of GS during pressure-loading may result from impaired GLAST expression. The authors conclude that the retina is at risk during acute intraocular pressure elevation due to downregulation of GS activity resulting from depressed GLAST expression.
Abstract
Purpose.
High levels of glutamate can be toxic to retinal GCs. Thus, effective buffering of extracellular glutamate is important in preserving retinal structure and function. GLAST, a major glutamate transporter in the retina, and glutamine synthetase (GS) regulate extracellular glutamate accumulation and prevent excitotoxicity. This study was an examination of changes in function and expression of GLAST and GS in ex vivo rat retinas exposed to acute increases in ambient pressure.
Methods.
Ex vivo rat retinas were exposed to elevated hydrostatic pressure for 24 hours. The expression of GLAST and GS were examined using immunochemistry and real-time PCR analysis. Also examined were the effects of (2S,3S)-3-[3-[4-(trifluoromethyl) benzoylamino] benzyloxy] aspartate (TFB-TBOA), an inhibitor of glutamate transporters, and l-methionine-S-sulfoximine (MSO), an inhibitor of GS.
Results.
In this acute model, Western blot and real-time RT-PCR analyses revealed that substantially (75 mm Hg), but not moderately (35 mm Hg), elevated pressure depressed GLAST expression, diminished GS activity, and induced axonal swelling between the GC layer and the inner limiting membrane. However, at the moderately elevated pressure (35 mm Hg), administration of either TFB-TBOA or MSO also induced axonal swelling and excitotoxic neuronal damage. MSO did not depress GLAST expression but TFB-TBOA significantly suppressed GS, suggesting that downregulation of GS during pressure loading may result from impaired GLAST expression.
Conclusions.
The retina is at risk during acute intraocular pressure elevation due to downregulation of GS activity resulting from depressed GLAST expression.
Glutamate acts as a neurotransmitter in the normal rat retina. However, excessive stimulation of glutamate receptors can result in excitotoxicity.1 Intraocular glutamate can cause severe degeneration of the inner retinal layers especially the ganglion cell (GC) layer.2,3 These findings support the hypothesis that increased extracellular glutamate concentration or decreased glutamate clearance results in excitotoxic damage and may contribute to the pathogenesis of glaucoma. Müller glia maintain an intimate relationship with retinal neurons and play a crucial role in regulating extracellular glutamate levels. Glutamate is transported into the Müller glia via glutamate transporters (GTs) and is catalyzed by glutamine synthetase (GS) to the nontoxic amino acid glutamine. Our prior study4 revealed that GS activity in isolated retinas decreases after pressure loading. However, it remains unclear whether pressure loading alters glutamate transporters as a potential mechanism contributing to excitotoxicity.
Glutamate transport is the only mechanism for removing glutamate from the extracellular fluid.5 It is hypothesized that functional impairment of glutamate transporters may play a major role in excitotoxicity and contribute to the pathogenesis of glaucoma.6,7 In support of this, glutamate transporter-knockout mice show glaucomatous-type damage of the optic nerve.8
To date, five distinct glutamate transporters, GLAST (EAAT1),9 GLT-1 (EAAT2),10 EAAC1 (EAAT3),11 EAAT4,12 and EAAT5,13 have been cloned. Among these, GLAST is the major glutamate transporter expressed in retinal Müller cells.14–18 Some studies have shown that GLAST expression diminishes6,7,19 or remains stable20 in experimental glaucoma, whereas others have reported increased expression.21 Thus, it remains unclear whether elevated intraocular pressure (IOP) alters glutamate uptake by modulating GLAST.
In this study, we examined changes in the expression of GLAST and GS by immunochemistry and real-time RT-PCR analyses in a rat ex vivo model with hydrostatic pressure loading.4 To examine the interaction of GLAST and GS under hyperbaric conditions, we incubated ex vivo retinas with (2S,3S)-3-[3-[4-(trifluoromethyl) benzoylamino] benzyloxy] aspartate (TFB-TBOA), a potent blocker of all subtypes of glutamate transporters,22 or l-methionine-S-sulfoximine (MSO), a specific inhibitor of GS.23 Changes in GLAST and GS expression induced by TFB-TBOA or MSO were also examined to determine whether there are interactions between GLAST and GS.
Materials and Methods
Rat Retina Preparation
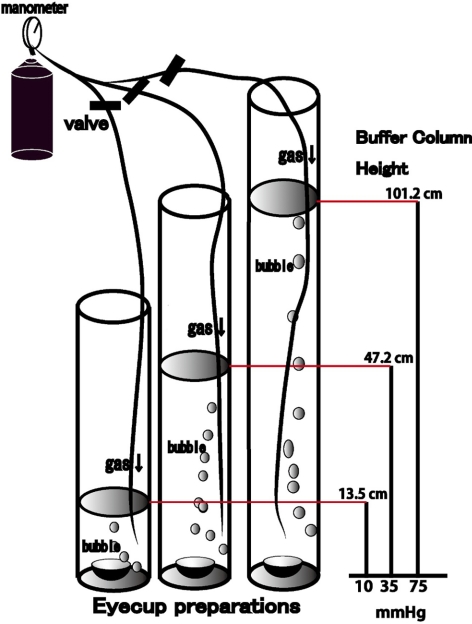
All experiments were performed in accordance with the guidelines of the ARVO Statement for the Use of Animals in Ophthalmic and Vision Research. Rat ex vivo specimens were prepared from approximately 30-day-old male Sprague-Dawley rats (Charles River Laboratories International Inc., Wilmington, MA), using previously described methods.24 The globes were carefully dissected from the orbits and placed in a holding device at the bottom of an ice-cold Petri dish filled with chilled aCSF24 containing (in mM): 124 NaCl, 5 KCl, 2 MgSO4, 2 CaCl2, 1.25 NaH2PO4, 22 NaHCO3, and 10 glucose. The holding device consisted of an inverted cap (inside diameter, 5 mm) removed from a 1.5-mL plastic vial. The globes were initially opened anterior to the equator, but posterior to the ora serrata to isolate, the eye cup. The optic disc was approximately at the center of the eye cup. Portions of the vitreous were mechanically removed when necessary. Each eye cup was submerged at the bottom of a tall glass cylinder filled to specific heights with aCSF to simulate IOP elevation (Fig. 1). A 95% O2 to 5% CO2 gas mixture was delivered through PE90 plastic tubing that terminated 2 cm above from the bottom of the cylinder. The pH was maintained between 7.35 and 7.40, and experiments were performed at 30°C.
Figure 1.
Outline of the present experiments. Eye cups prepared from Sprague-Dawley rats were placed at the bottom of a glass cylinder filled with aCSF at 30°C for 24 hours. The medium was bubbled with 95% O2 and 5% CO2. Hydrostatic pressure at the bottom of the cylinder was calculated to be 10, 35, and 75 mm Hg when aCSF was added to a height of 13.5, 47.2, and 101.2 cm. TFB-TBOA and MSO were added to the aCSF medium during some experiments.
The pressure at the bottom of the incubation cylinder was calculated as P = ρgH (P, pressure; ρ, density of the aCSF; g, gravity; H, height of the aCSF column). To simulate an IOP of 75 mm Hg, a pressure that can occur during a severe acute angle-closure attack, the CSF column height was adjusted to 101.2 cm. The depth of aCSF in the control column was set at 13.5 cm to create a pressure of 10 mm Hg. The depth of aCSF was adjusted to 47.2 cm to generate an intermediate pressure of 35 mm Hg. Pressure-loaded and control eye cups were incubated for 24 hours in the pressure column to examine pressure-dependent changes in the retina.
Light Microscopy
On completion of each experiment, eyecups were fixed in 1% paraformaldehyde and 1.5% glutaraldehyde-0.1 M phosphate buffer overnight at 4°C. The fixed eye cups were rinsed in 0.1 M phosphate buffer and placed in 1% buffered osmium tetroxide for 60 minutes. Specimens were dehydrated with alcohol, embedded in Epon 812 resin (TAAB Laboratories; Aldermaston, Berks, UK), and cut into 1-μm-thick sections for light microscopy. The sections were then stained with toluidine blue and evaluated by light microscopy. In the present study, we sectioned the plastic block of eye cup horizontally through the optic nerve along the entire anteroposterior axis of the retina, allowing simultaneous observation of the medial and lateral quadrants. We typically examined 10 light micrographs taken from five pairs of medial and lateral quadrants in each experimental condition. In cases of focal or spotty damage, the data from the damaged quadrant were deleted, and the corresponding quadrant without damage in the other eye cup was examined.
Pharmacological Effects of Glutamate Transporter and GS Inhibitors
We added TFB-TBOA (20 or 40 nM) or MSO (1 and 2 mM) to the aCSF starting 10 minutes before the introduction of pressure-loading. In some experiments, the combined effects of TFB-TBOA and MSO were examined at control pressure to determine whether this simulated the hyperbaric condition. TFB-TBOA and MSO were obtained from Sigma-Aldrich (St. Louis, MO).
Data Analysis
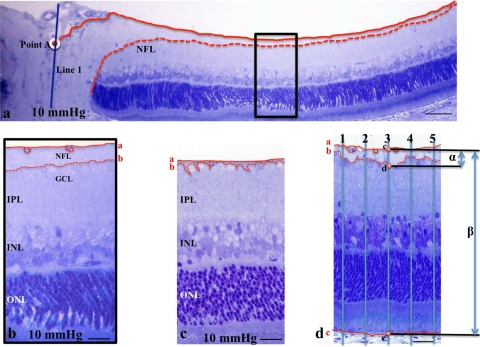
We examined the middle portion of the retina, along the inner limiting membrane (ILM), more than 1200 μm away from the center of the optic disc. By light microscopy, the nerve fiber layer (NFL) was defined as a layer between the ILM and the anterior boundary of the GC layer (GCL). When we encountered retinal vessels under the ILM, we traced the posterior boundary of the vessels, and measured the nerve fiber layer thickness (NFLT) based on this line. The NFLT and the total retinal thickness (RT) were measured by constructing a line perpendicular to the pigment epithelial layer, as shown in Figure 2. The percent NFLT (NFLT/RT × 100%) was measured along five perpendicular lines in each light micrograph of the retina ∼1200 μm away from the center of the optic disc. The average percentage of NFLT was determined in 10 different light micrographs taken from 5 to 7 eye cup samples in each condition, and the mean ± SD was analyzed and compared with the control (Fig. 2).
Figure 2.
(a) Light micrograph of the posterior region of the eye cup preparation incubated at 10 mm Hg. The NFL was traced as a layer between the ILM and the GCL. Solid line: the ILM; dashed line: posterior boundary of the NFL. We constructed a perpendicular line (line 1) through the center of the optic disc, and the distance was measured along the ILM from the crossing point (point A; white circle) of the ILM and line 1. It is easy to identify the NFL by light microscopy within the retinal region ∼1000 μm proximal to point A. (b) High magnification of the rectangular area depicted in (a). Line a traces the ILM and the posterior border of the retinal vessels. The prominent NFL can be easily traced in this region, but is gradually diminished in thickness, especially in the retinal region 1200 μm distal from point A. In the present study, we examined the NFL thickness of the retinal region greater than 1200 μm away from point A. (c, d) The NFL of retinas incubated at 10 and 75 mm Hg. The lines are as described in (a). The images in (c) and (d) correspond to the micrographs of in Figures 4d and 4c, respectively. (d) Measurement of the NFLT in the retinal region greater than 1200 μm away from point A. The five lines perpendicular to the pigment epithelial layer were constructed at a distance of 15 μm from each other, and the crossing points with the ILM (line a), the posterior boundary of the ILM (line b), and the pigment epithelial layer (line c) are marked as points c, d, and e, respectively. The distance between points c and d is defined as the NFLT (α), and the distance between points c and e as total RT (β). The percentage of NFLT is measured as α/β × 100 (%). Scale bar: (a) 40 μm; (b, c) 12 μm; (d) 15 μm.
The density of degenerated GCs characterized by nuclear chromatin clumping or necrosis was determined by counting 30 fields of 100-μm length (1200–1300 μm apart along the ILM from the center of the optic disc) at 10 different locations in light micrographs taken from each experimental condition.
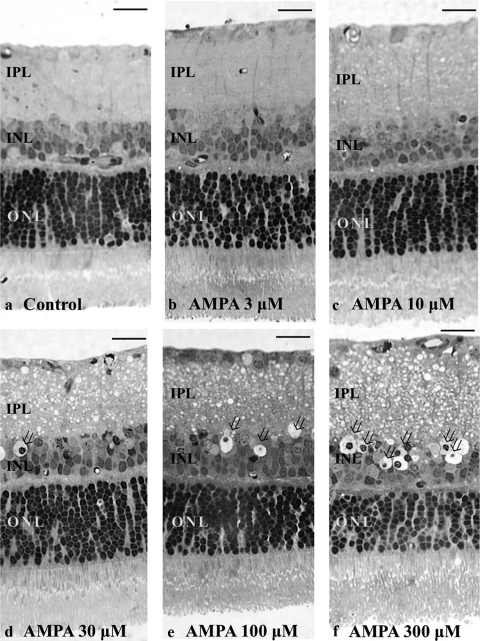
The severity of neuronal damage was assessed by light microscopy in 30 fields from each middle retinal block by using a neuronal damage score (NDS).25 The NDS rates neuronal damage in the inner nuclear layer (INL) and the inner plexiform layer (IPL) on a 0 to 4 scale, with 0 signifying no neuronal damage and 4 indicating very severe damage (Fig. 3). Criteria used in establishing the degree of neuronal damage included the extent of cytoplasmic swelling in the IPL and the number of neurons in the INL showing signs of severe cytoplasmic swelling and coarse clumping of nuclear chromatin (Fig. 3). The highest scale NDS (4) is determined when the IPL shows apparent spongiform appearance due to dendritic swelling and when most cell bodies in the INL show severe cytoplasmic swelling and coarse clumping of nuclear chromatin. If the damage is of a lesser degree, a score of 3 is assigned. NDS 2 is given when cell bodies in the INL are sporadically swollen. NDS 1 indicates that damage does not fulfill higher criteria, but the retinas differ from the controls (NDS 0). Fine dendritic swelling in a limited area of the IPL without damage in the INL is described by NDS 1.
Figure 3.
(a–e) Light micrographs of a control retina (a) and retinas incubated with different concentrations of AMPA (b, 3 μM; c, 10 μM; d, 30 μM; e, 100 μM; and f, 300 μM) representing an NDS of 0, 1, 2, 3, and 4, respectively. Retinal sections were stained with toluidine blue and were used for rating retinal damage in each condition in the present study. Note the apparent spongy appearance of the IPL and the bull's-eye formation in the INL (open arrows) in (d), (e), and (f). Scale bar: 15 μm.
These morphometric parameters were assessed by three raters who remained unaware of the experimental condition. On completion of data assessment, the significance of individual differences among raters was evaluated by using five randomly selected samples in each morphometric parameter for one-way analysis of variance (one-way ANOVA) followed by Tukey-Kramer test. There were no significant differences among the raters in any of the morphometric measurements.
The data were double checked and analyzed (SPBS. ver. 9.53; Nankodo Publisher, Tokyo, Japan). Each parameter was compared with control group by Student's t-test. For all analyses, P values were two-sided and were considered statistically significant, when the values were < 0.05.
Immunocytochemistry
For immunocytochemistry, eye cups were fixed with 1% paraformaldehyde in 0.1 M phosphate buffer for 1 hour at 4°C (n = 5 animals per experiment group) at the end of each experiment. They were then embedded in OCT compound (Sakura Global Holdings, Tokyo, Japan), and frozen with liquid nitrogen. Cryosections were incubated with rabbit anti-rat GLAST antibody (1:100; Frontier Institute, Ishikari, Japan), mouse anti-GS monoclonal antibody (1:100; Chemicon International, Inc., Billerica, MA), or mouse anti-vimentin monoclonal antibody (1:100; Chemicon International, Inc.) at room temperature for 2 hours. FITC-conjugated goat anti-rabbit IgG (1:200; Zymed Laboratories, Carlsbad, CA) or FITC- or rhodamine-conjugated goat anti-mouse IgG (1:200, Santa Cruz biotechnology, Santa Cruz, CA) was applied to the frozen sections as a secondary antibody. Binding sites of IgGs were detected by confocal laser scanning microscopy (LSM510 Axiovert200M; Carl Zeiss Meditec, Göttingen, Germany). DAPI was used for nuclear staining. For double immunofluorescence, cryosections of the fixed control specimens were incubated at room temperature with a mixture of two primary antibodies: GLAST (1:100) and vimentin (1:100). Subsequent antibody detection was performed with a mixture of two secondary antibodies, FITC-conjugated goat anti-rabbit IgG (1:200) and rhodamine-conjugated goat anti-mouse IgG (1:200). After several washes with PBS, colocalization of GLAST and vimentin was observed under a confocal microscope.
For quantification of immunohistochemical data,26 images of each section (five sections per animal) were captured. Each image was normalized by adjusting the black-and-white range (Photoshop, ver. 8.0; Adobe Systems, San Jose, CA). Intensity measurements were represented as the mean gray scale value on a 256 gray-level scale (using NIH Image, ver. 1.59; developed by Wayne Rasband, National Institutes of Health, Bethesda, MD; available at http://rsb.info.nih.gov/ij/index.html). Optical densities obtained from immunohistochemistry images were corrected by subtracting the average value for background noise from five image inputs.
Western Blot Analysis
At the end of each experiment, the empty eye cup (diameter of approximately 5 mm) was placed on a flat cutting surface and immersed in ice-cold aCSF. With a no. 22 surgical scalpel, the eye cup was divided into four equal fan-shaped segments. With the surgical blade, the retina was carefully and gently detached from the sclera with a fine forceps. The isolated retinas were frozen at −80°C. Retinas were then homogenized in lysis buffer solution (CelLytic MT; Sigma-Aldrich, Inc.) with protease inhibitor cocktail (Sigma-Aldrich, Inc.), prepared according to the manufacturer's instructions. The tissue extracts were ultrasonicated and clarified by centrifugation at 12,000g for 20 minutes at 4°C. The protein concentrations in supernatants were assayed (Quant-iT assay kit; Invitrogen Corp., Carlsbad, CA). Twenty micrograms of retinal extract were subjected to SDS polyacrylamide gel electrophoretic analysis. The proteins were then transferred to a PVDF membrane (Invitrogen Corp.). The blots were blocked for 30 minutes with a blocking solution (WesternBreeze Blocker/Diluent; Invitrogen) and then probed for 2 hours at room temperature with anti-GLAST, anti-GS, and mouse anti-β-actin monoclonal antibodies (Chemicon International, Inc.) at concentrations of 1:1000. The same antibodies used for immunohistochemistry were used for Western blot analysis. Immunoblots were visualized (WesternBreeze Chemiluminescent Immunodetection system; Invitrogen), with the exposure time to autoradiograph film (MXJB Plus; Kodak, Rochester, NY) adjusted to avoid over- or undersaturation. The membranes were then stripped and reprobed with β-actin to confirm equal protein loading. The density of Western blot bands was quantified using Image J, version. 1.37, image-analysis software (developed by Wayne Rasband, NIH). Quantification was normalized to the β-actin band at each pressure, and the relative gray-scale value was calculated by densitometric analysis of the obtained bands. At least five independent experiments were performed for each condition, and the results are presented as relative units numerically. Differences in expression levels were evaluated using Student's t-test.
Quantitative Real-Time RT-PCR
We quantified GLAST and GS mRNA expression in the pressure-loaded eye cup specimens incubated with or without TFB-TBOA (20 or 40 nM) and MSO (1 or 2 mM). At the end of each experiment, the empty eye cup was immersed in RNA stabilizer (RNAlater solution; Qiagen, Hilden, Germany) and frozen at −80°C. Total RNA was extracted (RNeasy kit; Qiagen) from the eye cup samples and used for cDNA synthesis. Aliquots (1 μg) of total RNA were reverse transcribed into first-strand cDNA (PrimeScrip RT reagent kit; Takara Bio Inc., Shiga, Japan) in a PCR thermal cycler (MP; Takara). Real-time reverse transcription (RT)-PCR reaction was performed with a second device (Dice Real-Time System; Takara). According to the manufacturer's instructions, the RT-PCR reaction was conducted in 25 μL of reaction buffer containing 12.5 μL Taq polymerase (SYBR Premix Ex Taq II; Takara), 1 μL of 10 μM forward and reverse primers, 2 μL cDNA, and 9.5 μL water. The RNA expression levels were normalized to the level of GAPDH expression. Table 1 summarizes the primers used. The primers were designed (Perfect Real Time Support System; Takara), and quantitative real-time RT–PCR curves were analyzed by the crossing-point standard curve method. At least five independent experiments were performed for each condition. Comparisons were performed with a paired t-test, and P < 0.05 (two-tailed) were considered significant.
Table 1.
Oligonucleotides Used for Real-Time PCR
| Gene | GenBank* Accession Number | Forward and Reverse Primer Sequences | Product Size (bp) |
|---|---|---|---|
| GLAST | NM_019225.1 | F: GCGGAATAGAGTACAGCCCACATTA | 125 |
| R: GACAAAGCGTTTAGGCCAGCA | |||
| GS | NM_017073.3 | F: CCACTGTCCCTGGGCTTAGTTTA | 147 |
| R: AGTGACATGCTAGTCCCACCAA | |||
| GAPDH | NM_017008.3 | F: GCCAAAAGGGTCATCATCTCCG | 143 |
| R: ACATTGGGGGTAGGAACACGGA |
Available at http://www.ncbi.nlm.nih.gov/Genbank; National Center for Biotechnology Information, Bethesda, MD.
Glutamine Synthetase Assay
GS catalyzes the reaction, glutamate+NH4++ATP→glutamine+ ADP+Pi+H+, in the presence of Mn2+ or Mg2+. In the present study, inorganic phosphate released from ATP in a GS biosynthetic assay was detected colorimetrically.27 The protein concentration of retinal samples was determined by the Bradford method (Bio-Rad Laboratories, Hercules, CA) using the assay solution and serum γ-globulin as the standard. GS was assayed in the pressure-loaded retinas incubated with or without TBOA (20 nM, 40 nM) or MSO (1 or 2 mM). At least five independent experiments were performed for each condition.
Results
Pressure-Induced Axonal Swelling
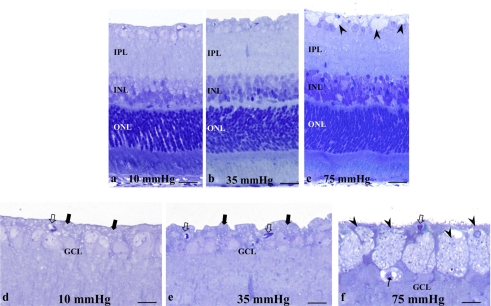
Retinas exhibited no remarkable changes after incubations at 10 mm Hg (Fig. 4a) and 35 mm Hg (Fig. 4b). At 75 mm Hg, axonal swelling was prominent, but the other layers remained intact (Fig. 4c). At higher magnification, the NFL was readily identified between the ILM and the anterior border of the GCL at 10 mm Hg (Fig. 4d) and 35 mm Hg (Fig. 4e), and swollen axons and damaged GCs were not detected. Degeneration of the GCL was occasionally observed at 75 mm Hg (Fig. 4f).
Figure 4.
(a–c) Light micrographs of retinas exposed to elevated hydrostatic pressure. (a, b) The retinas exhibited normal morphology at 10 (a) and 35 (b) mm Hg. Swollen axons were not detected in the nerve fiber layers. (c) Exposure to 75 mm Hg revealed axonal swelling (arrowheads) in the NFL. (d, f) High magnification of the inner retina exposed to 10 (d), 35 (e), and 75 (f) mm Hg. Solid arrows: indicate the NFL in (d) and (e). Open arrow: blood capillary. (f) Note the swollen axons (arrowheads) and degenerated GC in the GCL (arrow). Scale bar: (a–c) 15 μm; (d–f) 7 μm.
Effects of pressure-loading on NFLT percentage of total RT, density of damaged GCs, and NDS are summarized in Table 2.
Table 2.
Pressure-Dependent Changes in Retinal Features at Three Pressures
| Condition (n) | NFLT vs. RT (%) [P] | GC Count (n) [P] | NDS (n) [P] |
|---|---|---|---|
| 10 mm Hg (7) | 2.7 ± 0.4 [–] | 0.2 ± 0.1 [–] | 0.2 ± 0.1 [–] |
| 35 mm Hg (6) | 3.0 ± 1.2 [0.462] | 0.2 ± 0.2 [1.000] | 0.1 ± 0.1 [0.038] |
| 75 mm Hg (5) | 6.0 ± 0.3 [<0.0001]* | 1.2 ± 0.4 [<0.0001]* | 1.0 ± 0.5 [0.0001]* |
Data are the mean ± SD. The density of damaged ganglion cells was counted per 100 μm of the retina. P values were calculated versus control (10 mm Hg) by Student's t-test.
Statistically significant at P < 0.05.
TFB-TBOA-Dependent Changes in the Pressure-Loaded Retinas
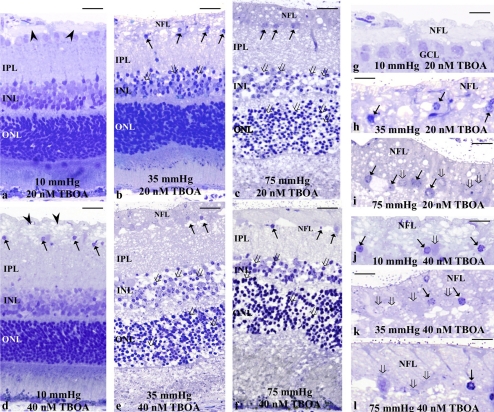
The role of glutamate transport was examined using a specific glutamate uptake inhibitor TFB-TBOA at concentrations of 20 and 40 nM. Administration of 20 nM TFB-TBOA induced axonal swelling in the NFL at 10 mm Hg (Figs. 5a, 5g). At 35 mm Hg, 20 nM TFB-TBOA increased axonal swelling and degeneration in the NFL along with edematous changes in the IPL and bull's-eye formation in the INL (Figs. 5b, 5h). At 75 mm Hg, the development of excitotoxicity was readily apparent (Figs. 5c, 5i). The thickened NFL exhibited degeneration and the INL and the outer nuclear layer (ONL) showed a bull's-eye formation.
Figure 5.
Light micrographs depicting TFB-TBOA-dependent changes in pressure-loaded retinas. (a–c) The photomicrographs show retinas incubated with 20 nM TFB-TBOA at 10 (a), 35 (b), and 75 (c) mm Hg. (a) Axonal swelling (arrowheads) was induced in the NFL. The other retinal layers remained intact. (b) Degeneration of the thickened NFL, pyknosis of the GC nuclei (arrows), and bull's-eye formation (open arrows) in the INL were observed. (c) TFB-TBOA produced clear neurotoxicity with the development of bull's-eye neuronal profiles in the INL (open arrows) and severe spongiform dendritic swelling in the IPL. Swollen axons were found in the NFL. Note also the degeneration of GCs (arrows). The bull's-eye formation was found in the ONL. (d–f) Light micrographs of retinas incubated with 40 nM TFB-TBOA. (d) Axonal swelling (arrowheads) was induced by 40 nM TFB-TBOA at control pressure. The IPL became slightly edematous and the bull's-eye formation (open arrows) was found in the INL. (e, f) Retinas revealed clear neurotoxicity at 35 (e) and 75 (f) mm Hg. Marked axonal swelling in the NFL and degeneration of the GC (arrows) were found. Bull's-eye formation was also found in the ONL. (g–j) High magnification of the NFL and GCL in retinas incubated with 20 nM TFB-TBOA at 10 (g), 35 (h), and 75 (i) mm Hg. (g) The NFL became thickened by axonal swelling. The GCL, however, remained intact. (h) The thickened NFL and the GCs exhibit degeneration. (i) The thickened NFL showed degeneration with vacuole formation, while the GCL seemed intact. (j–l) High magnification of degeneration in the NFL and GCL. (i–l) Arrows: nuclear pyknosis of the GCs; open arrows: degenerated GCs. Scale bar: (a–f) 15 μm; (g–l) 7 μm.
Administration of 40 nM TFB-TBOA induced axonal swelling in the NFL at 10 mm Hg (Figs. 5d, 5j). The IPL showed a slight spongiform appearance. Clear neurotoxicity with the development of bull's-eye neuronal profiles in the INL and severe spongiform dendritic swelling in the IPL was observed at 35 mm Hg (Figs. 5e, 5k) and 75 mm Hg (Figs. 5f, 5l). The swollen axons and GCs were markedly degenerated.
The effects of TFB-TBOA and pressure-loading on NFLT percentage of total RT, density of damaged GCs, and NDS in the retina are summarized in Table 3.
Table 3.
Effects of TFB-TBOA and Pressure-Loading on Retinal Features
| Condition (n) | NFLT vs. RT (%) [P] | GC Count (n) [P] | NDS (n) [P] |
|---|---|---|---|
| 10 mm Hg (6) | 2.0 ± 0.7 [–] | 0.2 ± 0.1 [–] | 0.2 ± 0.2 [–] |
| 10 mm Hg + 20 nM TBOA (7) | 3.4 ± 1.5 [0.016]* | 0.3 ± 0.2 [0.154] | 0.3 ± 0.3 [0.392] |
| 10 mm Hg + 40 nM TBOA (5) | 9.8 ± 3.7 [<0.0001]* | 5.1 ± 1.5 [<0.0001]* | 0.9 ± 0.6 [<0.0001]* |
| 35 mm Hg (7) | 3.3 ± 0.9 [–] | 0.1 ± 0.1 [–] | 0.2 ± 0.1 [–] |
| 35 mm Hg + 20 nM TBOA (6) | 6.3 ± 3.5 [0.017]* | 14.0 ± 3.1 [<0.0001]* | 1.5 ± 0.5 [<0.0001]* |
| 35 mm Hg + 40 nM TBOA (6) | 10.3 ± 3.4 [<0.0001]* | 19.6 ± 3.7 [<0.0001]* | 2.4 ± 0.6 [<0.0001]* |
| 75 mm Hg (7) | 7.0 ± 1.3 [–] | 1.2 ± 0.5 [–] | 1.4 ± 0.8 [–] |
| 75 mm Hg + 20 nM TBOA (6) | 10.4 ± 2.4 [0.001]* | 19.6 ± 3.1 [<0.0001]* | 2.5 ± 0.5 [<0.0001]* |
| 75 mm Hg + 40 nM TBOA (6) | 9.3 ± 2.4 [0.015]* | 20.2 ± 5.1 [<0.0001]* | 3.8 ± 0.5 [<0.0001]* |
Data are the mean ± SD. The density of damaged ganglion cells was counted per 100 μm of the retina. P values were calculated versus control (10 mm Hg) by Student's t-test.
Statistically significant at P < 0.05.
MSO-Dependent Changes in the Pressure-Loaded Retinas
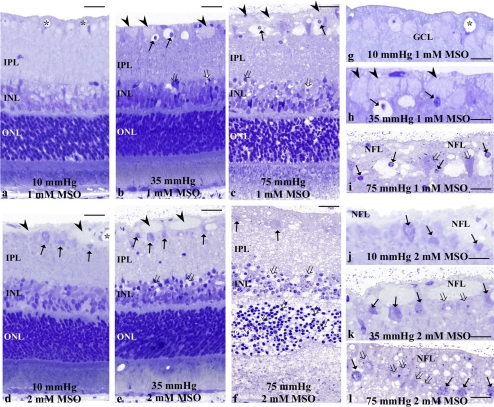
The role of glial glutamate metabolism in Müller cells was examined using the GS inhibitor MSO at concentrations of 1 and 2 mM. Administration of 1 mM MSO did not induce any significant changes at 10 mm Hg (Figs. 6a, 6g). At 35 mm Hg, 1 mM MSO induced axonal swelling in the NFL and GC degeneration in the GCL (Figs. 6b, 6h). At 75 mm Hg, retinas showed degeneration of the swollen axons in the NFL, along with GC degeneration and a spongiform appearance of the IPL (Figs. 6c, 6i). Bull's-eye formation was found in the INL and the ONL.
Figure 6.
(a–c) Light micrographs of pressure-loaded retinas incubated with 1 mM MSO at 10 (a), 35 (b), and 75 (c) mm Hg. (a) Swollen axons were not detected in the NFL. ( ) blood vessels. (b) A retinal section showing axonal swelling (arrowheads) and GC degeneration (arrows) in the NFL. Open arrows: bull's-eye formation in the INL. (c) Administration of 1 mM MSO induced axonal swelling (arrowheads) in the NFL along with neural degeneration in the GCL (arrows). Note the edematous appearance in the IPL and bull's-eye formation in the INL and the ONL (open arrows). (d–f) Light micrographs of the retinas incubated with 2 mM MSO at 10 (d), 35 (e), and 75 (f) mm Hg. (d) Axonal swelling (arrowheads) and degeneration of the GC (arrows) were induced. (e) The NFL became thickened, and degeneration of the GCL (arrows) was apparent. Note the bull's-eye formation (open arrows) in the INL. (f) The retina revealed clear neurotoxicity along with degeneration of the thickened NFL and GC (arrows). Bull's eye formation (open arrows) was found in the INL and the ONL. (g–i) High magnification of the NFL and GCL in retinas incubated with 1 mM MSO at 10 (g), 35 (h), and 75 (i) mm Hg. (g) The NFL and GCL showed normal appearance. (h) Note the axonal swelling in the NFL (arrowheads) and nuclear pyknosis of the GC (arrows). (i) High magnification of the thickened NFL and degenerated GCL (open arrows). Note the shrunken nuclei with chromatin condensation (arrows). (j–l) High magnification of the NFL and GCL in retinas incubated with 2 mM MSO at 10 (g), 35 (h), and 75 (i) mm Hg. (j) High magnification of the thickened NFL and degenerated GCL (open arrows). (k, l) High magnification of the thickened NFL and degenerated GCL. Note the nuclear chromatin condensation (arrows) of the GCs. Open arrow: indicates a deformed GC. Scale bar (a–f) 15 μm; (g–h) 7 μm.
Administration of 2 mM MSO induced axonal swelling in the NFL at 10 mm Hg (Figs. 6d, 6j). Figures 6e and 6k display a retina showing axonal swelling in the NFL, along with GC degeneration and vacuolar formation in the IPL at 35 mm Hg. Bull's-eye formation was found in the INL and the ONL. Severe destruction of each retinal layer was found at 75 mm Hg (Figs. 6f, 6l).
A summary of the effects of MSO and pressure-loading on percentage of NFLT in relation to total RT, density of damaged GC, and NDS are provided in Table 4.
Table 4.
Effects of MSO and Pressure-Loading on Retinal Damage
| Condition (n) | NFLT vs. RT (%) [P] | GC Count (n) [P] | NDS (n) [P] |
|---|---|---|---|
| 10 mm Hg (7) | 2.2 ± 0.8 [–] | 0.1 ± 0.1 [–] | 0.1 ± 0.1 [–] |
| 10 mm Hg + 1 mM MSO (6) | 2.7 ± 0.7 [0.152] | 0.2 ± 0.1 [0.150] | 0.3 ± 0.3 [0.061] |
| 10 mm Hg + 2 mM MSO (5) | 5.4 ± 1.0 [<0.0001]* | 8.1 ± 0.2 [<0.0001]* | 0.3 ± 0.3 [0.061] |
| 35 mm Hg (5) | 1.5 ± 0.6 [–] | 0.1 ± 0.1 [–] | 0.1 ± 0.1 [–] |
| 35 mm Hg + 1 mM MSO (6) | 5.1 ± 1.6 [<0.0001]* | 12.1 ± 2.3 [<0.0001]* | 0.7 ± 0.3 [<0.0001]* |
| 35 mm Hg + 2 mM MSO (6) | 5.9 ± 2.4 [<0.0001]* | 20.8 ± 1.1 [<0.0001]* | 3.6 ± 0.5 [<0.0001]* |
| 75 mm Hg (7) | 7.2 ± 2.6 [–] | 1.8 ± 1.0 [–] | 0.9 ± 0.4 [–] |
| 75 mm Hg + 1 mM MSO (6) | 10.2 ± 3.6 [0.047]* | 16.2 ± 4.7 [<0.0001]* | 0.9 ± 0.4 [0.009]* |
| 75 mm Hg + 2 mM MSO (6) | 11.6 ± 2.8 [0.002]* | 26.0 ± 5.1 [<0.0001]* | 3.6 ± 0.5 [<0.0001]* |
Data are the mean ± SD. The density of damaged ganglion cells was counted per 100 μm of the retina. P values were calculated versus control (10 mm Hg) by Student's t-test.
Statistically significant at P < 0.05.
Effects of Combined TFB-TBOA and MSO
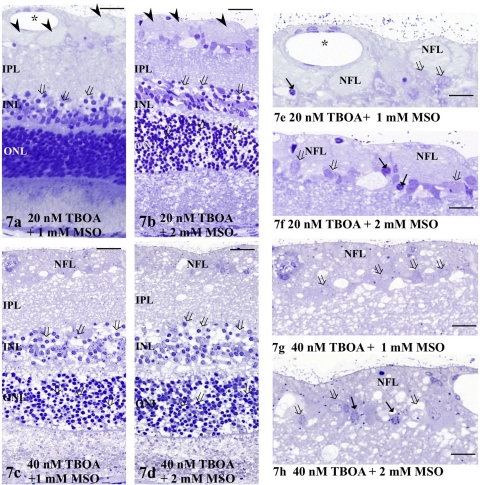
A combination of 20 nM TFB-TBOA and 1 mM MSO induced axonal swelling and GC degeneration, along with excitotoxicity characterized by spongiform changes in the IPL and bull's-eye formation in the INL at control pressure (Figs. 7a, 7e). Several GCs also showed nuclear shrinkage and degeneration. Administration of 2 mM MSO induced a more severe form of excitotoxicity along with GC degeneration when combined with 20 nM TFB-TBOA (Figs. 7b, 7f). Administration of 40 nM TFB-TBOA combined with 1 mM MSO (Figs. 7c, 7g) or 2 mM MSO (Figs. 7d, 7h) induced excitotoxic neural damage characterized by spongiform appearance in the IPL and bull's-eye formation in the INL at control pressure along with axonal swelling and GC degeneration.
Figure 7.
(a–d) Light micrographs of retinas incubated with a combination of TFB-TBOA and MSO at control pressure (10 mm Hg). (a) The light micrograph depicts a retina treated with a combination of 20 nM TFB-TBOA and 1 mM MSO at 10 mm Hg. Bull's-eye formation in the INL (open arrows) and spongiform changes in the IPL were induced, along with axonal swelling (arrowheads) in the NFL. ( ) Retinal vessels. (b–d) Administration of TFB-TBOA and MSO at (b) 20 nM TFB-TBOA and 2 mM MSO, (c) 40 nM TFB-TBOA and 1 mM MSO, and (d) 40 nM TFB-TBOA and 2 mM MSO at control pressure induced severe excitotoxicity characterized by the bull's-eye formation in the INL and spongiform appearance in the IPL along with axonal swelling in the NFL. (e–h) High magnification of the NFL and GCL treated with a combination of TFB-TBOA and MSO at (e) 20 nM TFB-TBOA and 1 mM MSO, (f) 20 nM TFB-TBOA and 2 mM MSO, (g) 40 nM TFB-TBOA and 1 mM MSO, and (h) 40 nM TFB-TBOA and 2 mM MSO at control pressure (10 mm Hg). Note the axonal swelling in the NFL in (e) and (f). Arrows: nuclear pyknosis of GCs. Open arrows: the degenerated GCs. Scale bar: (a–d) 15 μm; (e–h) 7 μm.
A summary of the effects of combined TFB-TBOA and MSO on the percentage of NFLT in relation to total RT, the density of damage to GCs, and the NDS are provided in Table 5.
Table 5.
Effect of TFB-TBOA and MSO Combined on Retinal Features
| Condition (n) | NFLT vs. RT (%) [P] | GC Count (n) [P] | NDS (n) [P] |
|---|---|---|---|
| 10 mm Hg (6) | 1.8 ± 0.6 [–] | 0.1 ± 0.1 [–] | 0.2 ± 0.1 [–] |
| 20 nM TBOA + 1 mM MSO (7) | 12.5 ± 4.4 [<0.0001]* | 18.1 ± 4.7 [<0.0001]* | 3.0 ± 1.1 [<0.0001]* |
| 20 nM TBOA + 2 mM MSO (6) | 14.2 ± 1.6 [<0.0001]* | 22.5 ± 2.7 [<0.0001]* | 3.2 ± 0.4 [<0.0001]* |
| 40 nM TBOA + 1 mM MSO (5) | 13.2 ± 0.7 [<0.0001]* | 24.1 ± 4.1 [<0.0001]* | 3.7 ± 0.5 [<0.0001]* |
| 40 nM TBOA + 2 mM MSO (6) | 12.2 ± 0.6 [<0.0001]* | 26.5 ± 2.3 [<0.0001]* | 3.8 ± 0.4 [<0.0001]* |
Data are the mean ± SD. The density of damaged ganglion cells was counted per 100 μm of the retina. P values were calculated versus control (10 mm Hg) by Student's t-test.
Statistically significant at P < 0.05.
Immunocytochemistry
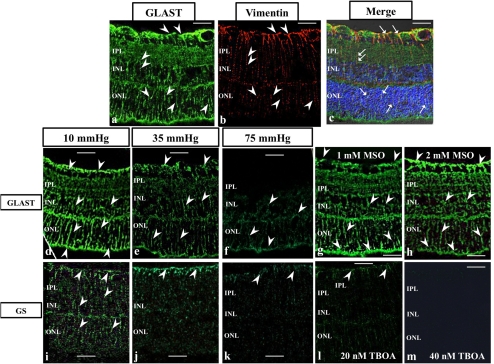
GLAST was expressed throughout control retinas incubated at 10 mm Hg (Fig. 8a). Vimentin was expressed in Müller cells (Fig, 8b). Müller cell end feet and some cell bodies were double-labeled with GLAST and vimentin antibodies (Fig. 8c). GLAST expression decreased in a pressure-dependent manner after incubations at 10 (Fig. 8d), 35 (Fig. 8e), and 75 (Fig. 8f) mm Hg. Administration of 1 mM MSO (Fig. 8g) and 2 mM MSO (Fig. 8h) showed no difference in GLAST immunofluorescence compared with controls incubated at 10 mm Hg.
Figure 8.
Immunofluorescent localization of GLAST (a, c, d–h), vimentin (b), and GS (i–m) by laser scanning microscopy. Cryosections are counterstained with DAPI in (c). (a–c) Sequential localization (a, b) and colocalization (c) of GLAST and vimentin. (a) GLAST (green; FITC) was expressed throughout the retina. Arrowheads: GLAST-positive radial staining throughout the retina. (b) Arrowheads: vimentin-positive Müller cell and radial staining (red; rhodamine). (c) The GLAST signals (green; FITC) coincide with the vimentin staining (red; rhodamine). Arrows: the colocalization of GLAST and vimentin in radial staining. (d–f) GLAST expression (green; FITC) decreased after incubations at 10 (d), 35 (e) and 75 (f) mm Hg in a pressure-dependent manner. (g, h) Administration of 1 (g) and 2 (h) mM MSO showed similar GLAST immunofluorescence intensity compared with controls incubated at 10 mm Hg. (i–m) GS (green; FITC) expression by the Müller cell end foot and cell body decreased in a pressure-dependent manner (i,10; j, 35; and k, 75 mm Hg). (l, m) Administration of 20 (l) and 40 (m) nM TFB-TBOA markedly decreased fluorescence compared with controls incubated at 10 mm Hg. Scale bar, 20 μm.
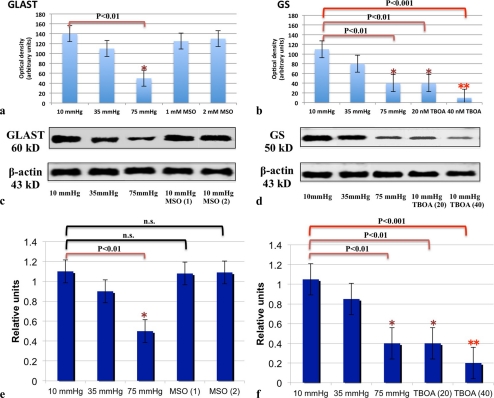
GS was also expressed in Müller cell end feet and cell bodies in retinas incubated at 10 mm Hg (Fig. 8i). GS expression decreased in pressure-dependent manner after incubations at 10 (Fig. 8i), 35 (Fig. 8j), and 75 (Fig. 8k) mm Hg. Administration of 20 nM TFB-TBOA (Fig. 8l) and 40 nM TFB-TBOA (Fig. 8m) markedly decreased fluorescence compared with controls incubated at 10 mm Hg. Quantitative analysis of immunohistochemical data is summarized in Figure 9a for GLAST expression and Figure 9b for GS expression.
Figure 9.
(a, b) Quantitative analysis of immunohistochemical data for GLAST (a) and GS (b) expression. (a) GLAST expression significantly decreased at 75 mm Hg compared with control pressure. Administration of MSO (1 and 2 mM) induced no remarkable changes in GLAST immunofluorescence at 10 mm Hg. (b) GS expression was significantly reduced at 75 mm Hg compared with expression at 10 mm Hg. Administration of 20 and 40 nM TFB-TBOA significantly decreased expression of GS compared to controls at 10 mm Hg. (c, d) Representative Western blot analyses of GLAST (c) and GS (d) proteins in pressure-loaded retinas treated with and without MSO (1 and 2 mM) or TFB-TBOA (20 and 40 nM). β-Actin was used as a loading control. (e, f) Quantitative Western blot analysis of GLAST (e) and GS (f) expression. (e) GLAST expression significantly decreased at 75 mm Hg compared with control pressure. Administration of MSO (1 and 2 mM) induced no remarkable changes in GLAST expression at 10 mm Hg. (f) GS expression was significantly reduced at 75 mm Hg compared with expression at 10 mm Hg, Administration of 20 and 40 nM TFB-TBOA also decreased expression of GS compared with control at 10 mm Hg.
Western Blot Analysis
The GLAST, GS, and β-actin antibodies recognized single bands at approximately 60, 50, and 43 kDa, respectively. Equal protein-loading was confirmed with β-actin antibody. Quantitative Western blot analysis demonstrated that the mean level of GLAST was reduced in a pressure-dependent manner and was significantly depressed at 75 mm Hg compared with expression at 10 mm Hg. Administration of 1 and 2 mM MSO showed no difference in expression of GLAST compared with controls incubated at 10 mm Hg (Figs. 9c, 9e).
Quantitative Western blot analysis demonstrated that the mean level of GS was reduced in a pressure-dependent manner and significantly depressed at 75 mm Hg compared with expression at 10 mm Hg (Fig. 9d). Administration of 20 and 40 nM TFB-TBOA decreased the expression of GS compared to controls at 10 mm Hg (Figs. 9d, 9f). For these studies, equal protein loading was confirmed with β-actin antibody.
Real-time PCR Analysis
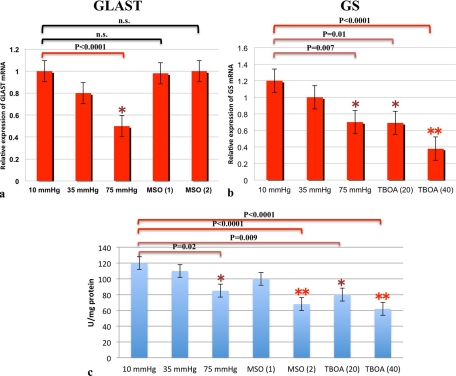
We measured mRNA levels of GLAST (Fig. 10a) in pressure-loaded retinas using real-time PCR. In accordance with the protein expression data, real-time PCR revealed that GLAST mRNA decreased in a pressure-dependent manner, and was significantly depressed at 75 mm Hg compared with expression at 10 mm Hg. At 10 mm Hg, administration of 1 and 2 mM MSO did not show effects on GLAST expression compared with controls at 10 mm Hg.
Figure 10.
(a, b) Real-time RT-PCR analysis of GLAST (a) and GS mRNA (b). (a) GLAST mRNA expression decreased in a pressure-dependent manner and was significantly depressed at 75 mm Hg compared with the control pressure (10 mm Hg). Treatment with 1 and 2 mM MSO induced no remarkable difference in GLAST mRNA expression. (b) GS mRNA was significantly depressed at 75 mm Hg compared with control pressure. Administration of TFB-TBOA (20 and 40 nM MSO) also reduced GLAST mRNA expression at 10 mm Hg. (c) GS activity was significantly depressed at 75 mm Hg compared with control pressure (10 mm Hg). Treatment with 2 mM MSO, 20 nM TFB-TBOA, and 40 nM TFB-TBOA significantly depressed GS activity at 10 mm Hg.
GS mRNA expression significantly decreased at 75 mm Hg compared with expression at 10 mm Hg (Fig. 10b). At 10 mm Hg, administration of 20 and 40 nM TFB-TBOA markedly decreased expression of GS mRNA compared with that in controls.
GS Activity
With a colorimetric enzyme assay, GS activity was found to decrease in a pressure-dependent manner compared with controls (Fig. 10c). There were no significant differences in GS activity between 10 and 35 mm Hg, whereas GS activity was significantly reduced at 75 compared with 10 mm Hg. At 10 mm Hg, administration of 1 mM MSO showed no significant effect on GS activity, whereas 2 mM MSO significantly decreased GS activity compared with the controls. Administration of 20 and 40 nM TFB-TBOA significantly decreased GS activity at 10 mm Hg.
Discussion
In the present study, we used a rat ex vivo model that involves incubating rat eye cups under hydrostatic pressure at the bottom of a deep cylinder. The hydrostatic pressure used in this model is adjusted to 75 mm Hg, a pressure that can occur during a severe acute angle-closure attack. Such acute high pressures can induce retinal ischemia clinically and in in vivo glaucoma models.28–30 Although the degenerative effects of retinal ischemia differ from those of IOP elevation in significant ways, it is difficult to discriminate the relative contributions of IOP elevation from those of retinal ischemia. The advantages of our ex vivo hydrostatic pressure model include better preservation of eye cup samples without ischemia, making it possible to investigate direct effects of pressure-induced retinal injury on glutamate metabolism and the possible role of changes in glutamate metabolism in the pathophysiology of acute angle-closure attacks.
The present study demonstrates that pressure-loading depresses the expression of two key glial proteins, GLAST and GS, both of which are required for regulating extracellular glutamate levels and glutamate metabolism. As previously reported,4 pressure loading of isolated retinas results in swelling of axons between the ILM and the GCL (Fig. 4). To determine whether pressure loading damages the retina through modulation of GLAST and GS, we used TFB-TBOA, a potent inhibitor of glutamate transporters, and MSO, a specific GS inhibitor. Although moderately raised pressure (35 mm Hg) alone did not result in apparent axonal swelling, combination with TFB-TBOA or MSO facilitated axonal swelling and resulted in excitotoxic damage in the inner neuronal layer. At the control pressure in ex vivo retinas, administration of both TFB-TBOA and MSO also induced axonal swelling and excitotoxic neuronal damage and mimicked some effects of pressure loading. These results suggest that depression of GLAST and GS activity is tightly coupled during pressure loading.
Although GLAST and GS activities are intimately intertwined,31 both are simultaneously suppressed by high pressure-loading. Thus, it is also possible that suppression of GLAST and GS activities occur separately32 during pressure-loading. However, a series of observations in the present study suggest that during pressure-loading, the impairment of GLAST expression precedes the depression of GS activity. Pharmacologic inhibition of GS activity with MSO fails to modulate GLAST expression, whereas inhibition of GLAST with TFB-TBOA substantially suppresses GS activity. This finding was observed and confirmed in four different lines of experiments in the present study. Thus, we hypothesize that during pressure-loading, impairment of GLAST takes place first and results in downregulation of GS activity as a secondary effect.
It should be noted that moderately raised pressure (35 mm Hg) that does not induce histologic changes suppresses neither GLAST nor GS activity, while further pressure-loading (75 mm Hg) suppresses both and induces axonal swelling, indicating that substantial elevations to pressures exceeding 35 mm Hg are necessary for downregulation of both GLAST and GS activity and histologic damage. With a moderately elevated pressure (35 mm Hg), however, administration of either TFB-TBOA or MSO induced histologic damage, suggesting that an unknown mechanism that is triggered by even moderately high pressure participates in the development of the damage. Future studies should address how GLAST impairment results in GS downregulation and also determine the mechanisms other than GLAST and GS required for the damage induced by pressure-loading. Taken together, we conclude that the retina is at the risk during pressure-loading at least in part because of impairment in the GS activity resulting from decreases in GLAST expression.
Acknowledgments
The authors thank Yoko Hayami, Sanae Takaseki, and Yumi Hirata for technical support involving the rating of morphologic findings.
Footnotes
Supported in part by National Institutes of Health Grant MH077791, Neuroscience Blueprint Core Grant NS57105, and the Bantly Foundation.
Disclosure: M. Ishikawa, None; T. Yoshitomi, None; C.F. Zorumski, None; Y. Izumi, None
References
- 1. Lucas DR, Newhouse JP. The toxic effect of sodium L-glutamate on the inner layers of the retina. Arch Ophthalmol. 1957;58:193–201 [DOI] [PubMed] [Google Scholar]
- 2. Siliprandi R, Canella R, Carmignoto G, et al. N-methyl-D-aspartate-induced neurotoxicity in the adult rat retina. Vis Neurosci. 1992;8:567–573 [DOI] [PubMed] [Google Scholar]
- 3. Azuma N, Kawamura M, Kohsaka S. Morphological and immunohistochemical studies on degenerative changes of the retina and the optic nerve in neonatal rats injected with monosodium-L-glutamate. Nippon Ganka Gakkai Zasshi. 1989;93:72–79 [PubMed] [Google Scholar]
- 4. Ishikawa M, Yoshitomi T, Zorumski CF, Izumi Y. Effects of acutely elevated hydrostatic pressure in the rat ex vivo retinal preparation. Invest Ophthalmol Vis Sci. 2010;51:6414–6423 [DOI] [PMC free article] [PubMed] [Google Scholar]
- 5. Danbolt NC. Glutamate uptake. Prog Neurobiol. 2001;65:1–105 [DOI] [PubMed] [Google Scholar]
- 6. Naskar R, Vorwerk CK, Dreyer EB. Concurrent downregulation of a glutamate transporter and receptor in glaucoma. Invest Ophthalmol Vis Sci. 2000;41:1940–1944 [PubMed] [Google Scholar]
- 7. Martin KR, Levkovitch-Verbin H, Valenta D, et al. Retinal glutamate transporter changes in experimental glaucoma and after optic nerve transection in the rat. Invest Ophthalmol Vis Sci. 2002;43:2236–2243 [PubMed] [Google Scholar]
- 8. Harada T, Harada C, Nakamura K, et al. The potential role of glutamate transporters in the pathogenesis of normal tension glaucoma. J Clin Invest. 2007;117:1763–1770 [DOI] [PMC free article] [PubMed] [Google Scholar]
- 9. Storck T, Schulte S, Hofmann K, Stoffel W. Structure, expression, and functional analysis of a Na(+)-dependent glutamate/aspartate transporter from rat brain. Proc Natl Acad Sci U S A. 1992;89:10955–10959 [DOI] [PMC free article] [PubMed] [Google Scholar]
- 10. Pines G, Zhang Y, Kanner BI. Glutamate 404 is involved in the substrate discrimination of GLT-1, a (Na++K+)-coupled glutamate transporter from rat brain. J Biol Chem. 1995;270:17093–17097 [DOI] [PubMed] [Google Scholar]
- 11. Kanai Y, Hediger MA. Primary structure and functional characterization of a high-affinity glutamate transporter. Nature. 1992;360:467–471 [DOI] [PubMed] [Google Scholar]
- 12. Fairman WA, Vandenberg RJ, Arriza JL, Kavanaugh MP, Amara SG. An excitatory amino-acid transporter with properties of a ligand-gated chloride channel. Nature. 1995;375:599–603 [DOI] [PubMed] [Google Scholar]
- 13. Arriza JL, Eliasof S, Kavanaugh MP, Amara SG. Excitatory amino acid transporter 5, a retinal glutamate transporter coupled to a chloride conductance. Proc Natl Acad Sci USA. 1997;94:4155–4160 [DOI] [PMC free article] [PubMed] [Google Scholar]
- 14. Izumi Y, Shimamoto K, Benz AM, et al. Glutamate transporters and retinal excitotoxicity. Glia. 2002;39:58–68 [DOI] [PubMed] [Google Scholar]
- 15. Pow DV, Barnett NL. Developmental expression of excitatory amino acid transporter 5: a photoreceptor and bipolar cell glutamate transporter in rat retina. Neurosci Lett. 2000;280:21–24 [DOI] [PubMed] [Google Scholar]
- 16. Rauen T, Taylor WR, Kuhlbrodt K, Wiessner M. High-affinity glutamate transporters in the rat retina: a major role of the glial glutamate transporter GLAST-1 in transmitter clearance. Cell Tissue Res. 1998;291:19–31 [DOI] [PubMed] [Google Scholar]
- 17. Rauen T. Diversity of glutamate transporter expression and function in the mammalian retina. Amino Acids. 2000;19:53–62 [DOI] [PubMed] [Google Scholar]
- 18. Sarthy VP, Pignataro L, Pannicke T, et al. Glutamate transport by retinal Müller cells in glutamate/aspartate transporter-knockout mice. Glia. 2005;49:184–196 [DOI] [PubMed] [Google Scholar]
- 19. Schuettauf F, Thaler S, Bolz S, et al. Alterations of amino acids and glutamate transport in the DBA/2J mouse retina; possible clues to degeneration. Graefes Arch Clin Exp Ophthalmol. 2007;245:1157–1168 [DOI] [PubMed] [Google Scholar]
- 20. Park CK, Cha J, Park SC, et al. Differential expression of two glutamate transporters, GLAST and GLT-1, in an experimental rat model of glaucoma. Exp Brain Res. 2009;197:101–109 [DOI] [PubMed] [Google Scholar]
- 21. Woldemussie E, Wijono M, Ruiz G. Müller cell response to laser-induced increase in intraocular pressure in rats. Glia. 2004;47:109–119 [DOI] [PubMed] [Google Scholar]
- 22. Shimamoto K, Sakai R, Takaoka K, et al. Characterization of novel L-threo-beta-benzyloxyaspartate derivatives, potent blockers of the glutamate transporters. Mol Pharmacol. 2004;65:1008–1015 [DOI] [PubMed] [Google Scholar]
- 23. Izumi Y, Matsukawa M, Benz AM, et al. Role of ammonia in reversal of glutamate-mediated Müller cell swelling in the rat retina. Glia. 2004;48:44–50 [DOI] [PubMed] [Google Scholar]
- 24. Izumi Y, Benz AM, Kirby CO, et al. An ex vivo rat retinal preparation for excitotoxicity studies. J Neurosci Methods. 1995;60:219–225 [DOI] [PubMed] [Google Scholar]
- 25. Izumi Y, Kirby CO, Benz AM, Olney JW, Zorumski CF. Swelling of Müller cells induced by AP3 and glutamate transport substrates in rat retina. Glia. 1996;17:285–293 [DOI] [PubMed] [Google Scholar]
- 26. Natoli R, Provis J, Valter K, Stone J. Expression and role of the early-response gene Oxr1 in the hyperoxia-challenged mouse retina. Invest Ophthalmol Vis Sci. 2008;49:4561–4567 [DOI] [PubMed] [Google Scholar]
- 27. Gawronski JD, Benson DR. Microtiter assay for glutamine synthetase biosynthetic activity using inorganic phosphate detection. Anal Biochem. 2004;327:114–118 [DOI] [PubMed] [Google Scholar]
- 28. Goldblum D, Mittag T. Prospects for relevant glaucoma models with retinal GC damage in the rodent eye. Vision Res. 2002;42:471–478 [DOI] [PubMed] [Google Scholar]
- 29. Osborne NN, Casson RJ, Wood JP, Chidlow G, Graham M, Melena J. Retinal ischemia: mechanisms of damage and potential therapeutic strategies. Prog Retin Eye Res. 2004;23:91–147 [DOI] [PubMed] [Google Scholar]
- 30. Nucci C, Tartaglione R, Rombola L, et al. Neurochemical evidence to implicate elevated glutamate in the mechanisms of high intraocular pressure (IOP)-induced retinal GC death in rat. Neurotoxicology. 2005;26:935–941 [DOI] [PubMed] [Google Scholar]
- 31. Derouiche A, Rauen T. Coincidence of L-glutamate/L-aspartate transporter (GLAST) and glutamine synthetase (GS) immunoreactions in retinal glia: evidence for coupling of GLAST and GS in transmitter clearance. J Neurosci Res. 1995;42:131–143 [DOI] [PubMed] [Google Scholar]
- 32. Jablonski MM, Freeman NE, Orr WE, et al. Genetic pathways regulating glutamate levels in retinal Müller cells. Neurochem Res. 2011;36:594–603 [DOI] [PMC free article] [PubMed] [Google Scholar]


