

Latent class analysis allows the estimation of test sensitivities and specificities in the absence of a gold standard. PCR outperformed clinical examination and intense trachomatous inflammation (TI) appeared much more specific than follicular trachomatous inflammation (TF).
Abstract
Purpose.
Tests for ocular Chlamydia trachomatis have not been well characterized, because there is no gold standard test. Latent class analysis (LCA) was performed to estimate the sensitivity and specificity of laboratory and clinical tests for trachoma in the absence of a gold standard.
Methods.
Individual data from pretreatment, hyperendemic areas in Ethiopia were used. A clustered LCA was performed for three diagnostic tests: PCR and WHO simplified criteria grades of follicular trachoma (TF) and intense trachomatous inflammation (TI).
Results.
Data from 2111 subjects in 40 villages were available. TF was estimated to be 87.3% (95% CI, 83.3–90.1) sensitive and 36.6% (95% CI, 23.6–40.3) specific; TI was estimated to be 53.6% (95% CI, 46.1–88.0) sensitive and 88.3% (95% CI, 83.3–92.0) specific, and PCR was estimated to be 87.5% (95% CI, 79.9–97.2) sensitive and 100% (95% CI 69.3–100) specific.
Conclusions.
LCA allows for an estimate of test characteristics without prior assumption of their performance. TF and TI were found to act in a complementary manner: TF is a sensitive test and TI is a specific test. PCR is highly specific but lacks sensitivity. The performance of these tests may be due to the time course of ocular chlamydial infection, and for this reason, results may differ in areas of low prevalence or recent mass treatment (ClinicalTrials.gov number, NCT00221364).
Trachoma is the leading infectious cause of blindness worldwide, with an estimated 1.3 million blind in 2002.1 The responsible infectious agent, Chlamydia trachomatis, responds to antibiotic treatment,2 but the infection is difficult to diagnose accurately.3 The World Health Organization (WHO) bases its treatment recommendations on the prevalence of clinically active trachoma,4 and our group has demonstrated that treatment strategies may have to be altered depending on the prevalence of chlamydia infection in the community.5–7 Elimination efforts require accurate surveillance of disease to assess when treatments can be discontinued and to detect reemergence in previously treated areas.
Difficulties in diagnosis stem from the lack of an accepted gold standard for active C. trachomatis infection. Disease surveys typically rely on the prevalence of findings from the WHO simplified grading criteria.8 However, clinical examination findings and chlamydial infection are frequently discordant,3 in part because the clinical signs of trachoma persist for many weeks after infection has been cleared.9,10 Culture, while specific for viable organism, is an expensive technical challenge and is thought to have low sensitivity. DNA-based polymerase chain-reaction (PCR) is sometimes assumed to be a gold standard,11 but can be negative in the presence of infection identified by RNA-based PCR.10,12,13 Although the RNA test is thought to be the most sensitive method for detecting chlamydia, it has not been used frequently in trachoma studies.
When determining the sensitivity and specificity of diagnostic tests, using an imperfect test as a gold standard leads to biased estimates of the comparison tests. It also causes the sensitivity and specificity of tests to vary with prevalence, a phenomenon that has been reported with trachoma.14–19 Latent class analysis (LCA) allows comparison between observed data and a parameter-optimized latent gold standard. In effect, the latent gold standard acts as a composite of all available data and permits the estimation of sensitivity and specificity of each test individually. Those estimates are not based on preconceived notions that we have about test performance; rather, they arise completely from trends in the data. In this study, we applied a clustered LCA to baseline village data from the Trachoma Elimination Follow-up (TEF) study to evaluate diagnostic tests for ocular chlamydia infection, including the clinical signs of follicular trachomatous inflammation (TF) and intense trachomatous inflammation (TI) and DNA-PCR assay (Amplicor PCR; Roche Diagnostics, Indianapolis, IN).
Methods
We randomly selected 40 villages in the Gurage zone of Ethiopia for enrollment in the TEF study. All children aged 1 to 5 years in these villages were offered screening before any study interventions were implemented. Screening consisted of conjunctival examination and swabbing. The upper right tarsal conjunctiva was graded by trained personnel using WHO simplified grading criteria,8 which include TF and TI. TF is defined as the presence of five or more follicles at least 0.5 mm in size in the upper tarsal conjunctiva. TI is present when inflammatory thickening obscures more than 50% of the deep tarsal vessels.8 Graders were certified if they had greater than 80% concordance with an expert ophthalmologist in field testing. Dacron swabs of the upper right tarsal conjunctiva were obtained and evaluated with a DNA-PCR assay (Amplicor; Roche Diagnostics; referred to as PCR in this report). Laboratory workers were masked to patient information and clinical examination results, and laboratory testing was unavailable at the time of clinical examination. Multiple controls were used in PCR testing, including positive and negative laboratory controls and negative and duplicate field controls.7 The study protocol adhered to the tenets of the Declaration of Helsinki, informed consent was obtained from all participants, and the study had institutional review board approval from all participating centers. The methodology is described in more detail elsewhere.6,7,11
We used an LCA model20 parameterized to account for village-level clustering. Our model introduces a latent gold standard, which is a categorical variable representing a latent or unknowable true disease state. The latent gold standard divides the population into latent classes representing “disease present” and “disease absent.” In the LCA model, all test results are due to the interaction of latent class status prevalence with the sensitivity and specificity of the tests. In our case, we had 6 sensitivity/specificity parameters and 40 prevalence parameters. Using test values for each of these parameters, we directly calculated the expected frequency tables for each village. To optimize the parameters, we minimized the sum of the Kullback-Leibler discrepancies:
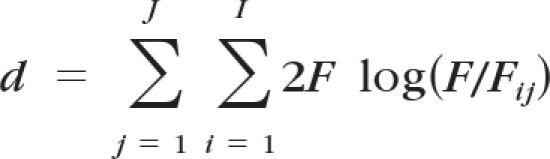 |
for all J villages, where F represents the observed count, Fij the expected count of a particular combination of test results in a village, and I the number of entries in each village's frequency table. The Kullback-Leibler discrepancy is a measure of information gained by introduction of the model,21 and this approach yields the maximum likelihood estimate.20 Note that the LCA model that we implemented requires an assumption of test independence, conditional on the latent class. Latent class methods are described in more depth elsewhere.22
In addition, we performed three comparative analyses: TF versus PCR, TI versus PCR, and clinical activity (defined as TF and/or TI) versus PCR, using the clustered LCA with only two diagnostic tests. Typically, an LCA with m dichotomous tests and one dichotomous latent class is identifiable when m ≥ 3.20 Note that, in this case, the degrees of freedom gained by having multiple villages of different prevalence allowed these two test models to be identifiable.
Parameters were optimized by using a downhill simplex (Nelder-Mead) method (Mathematica 7.0 software; Wolfram Research, Champaign, IL). Percentile confidence intervals were obtained by iterating 999 bootstrap resamples at the village level (to account for clustering). P values were computed by comparing estimates from each model to estimates from the primary model for each resample. To make the density plot for each test, we created a beta distribution for each village's test results and calculated the arithmetic mean.
Results
Clinical examination and PCR data were available for 2111 subjects in 40 villages. The median village prevalence of TF of 1- to 5-year-olds was 73.5% (interquartile range [IQR] 67.9–83.3). Median TI prevalence was 29.9% (IQR 21.1–42.9). Median PCR prevalence was 46.2% (IQR 34.1–60.5). Median latent class prevalence was 53.1% (IQR 38.8–69.9). Figure 1 shows the distributions of prevalence among the villages, separated by test.
Figure 1.

Probability density plots of village test prevalence (x-axis) versus relative frequency (y-axis). The figure can be interpreted as a continuous histogram. Distributions for each of the three tests, as well as the latent gold standard (LCA), are shown. Note that the y-axis is dimensionless and that the area under each curve has been normalized.
Figure 2 compares the prevalence of TF, TI, or PCR with the LCA prevalence for each village. The diagonal line represents the performance of a true gold standard; points in the region above the line corresponds to overdiagnosis and points below to underdiagnosis relative to the latent class. There were various levels of correlation between each of the test prevalences and the latent class prevalence, with an R2 of 0.24 for TF, 0.55 for TI, and 0.97 for PCR.
Figure 2.

Village-level prevalence of each test for trachoma (y-axis) versus the prevalence of the latent gold standard (LCA, x-axis). Each data point represents the prevalence of positive tests from a single village, with multiple tests from the same village aligned vertically. The diagonal line represents the performance of a perfect test.
Estimates for sensitivity and specificity for each of TF, TI, and PCR are shown in Table 1, with 95% CI. Also shown in Table 1 are the results of the three comparative analyses, with 95% CI.
Table 1.
Diagnostic Test Characteristics for 2115 Subjects from 40 Villages in Ethiopia Based on Village-Clustered LCA, with Bootstrapped 95% CI
| Test | Sensitivity | 95% CI | Specificity | 95% CI |
|---|---|---|---|---|
| Primary analysis | ||||
| TF | 87.3 | (83.3–90.1) | 36.6 | (23.6–40.3) |
| TI | 53.6 | (46.1–88.0) | 88.3 | (83.3–92.0) |
| PCR | 87.5 | (79.9–97.2) | 100 | (69.3–100) |
| Comparative analysis 1 | ||||
| TF | 87.7 | (84.7–91.7) | 40.9 | (34.1–50.2) |
| P = 0.058* | ||||
| PCR | 79.3 | (68.5–94.1) | 100 | (89.7–100) |
| P = 0.118* | ||||
| Comparative analysis 2 | ||||
| TI | 71.4 | (51.1–98.0) | 89.3 | (85.3–93.3) |
| PCR | 86.7 | (80.4–94.7) | 76.0 | (62.8–93.7) |
| Comparative analysis 3 | ||||
| Clinical activity | 96.8 | (94.4–100) | 38.4 | (28.1–46.6) |
| PCR | 75.4 | (66.7–92.3) | 100 | (82.8–100) |
Calculated by bootstrap resampling method.
Discussion
We performed a clustered form of LCA to estimate the sensitivity and specificity of three tests of ocular chlamydia infection (TF and TI for clinical trachoma and PCR for chlamydial DNA) and provide village-level estimates of the trachoma prevalence. In making these estimates, we did not assume a gold standard. We estimated TF to be 87.3% sensitive and 36.6% specific, TI to be 53.6% sensitive and 88.3% specific, and PCR to be 87.5% sensitive and 100% specific.
TF, the diagnostic test used in the WHO trachoma guidelines, had its advantages. It is inexpensive, yields instant results, and is sensitive; 87.3% of latent class positives would be expected to be TF positive. However, this analysis suggests that it is poorly specific (36.6%) and tends to overestimate infection rates (Fig. 2), which could lead to unnecessary treatment. Low specificity may be the result of the kinetics of infection in which follicles may persist long after the infection has been cleared23 or in which follicles may reoccur without the presence of chlamydia.14 Despite low specificity, the advantages of TF—namely, low cost and immediate results—ensure that it will remain critical in disease surveys.
TI is not currently used in the WHO treatment protocols. TF is the preferred test, because it is more closely related to the historical MacCallan classification and because TI is often overdiagnosed in the presence of redness or scarring (Taylor H, personal communication, 2011). Nevertheless, this study suggests that TI is far more specific (88.3%) than TF (36.6%). TI has been shown to correlate more strongly with PCR results10,15 and to have higher chlamydial loads by quantitative PCR.24 Our results suggest that it lacks sensitivity (53.6%) and tends to underestimate prevalence (Fig. 2). Again, this may be due to infection kinetics; TI tends to resolve sooner in the course of infection than does TF.25
Another trachoma study used a hidden Markov model, which shares traits with latent class models, to analyze longitudinal data. Briefly, their model had a hidden true disease state, analogous to our latent class, and diagnostic tests approximated this disease state with parameterized sensitivity and specificity. They estimated clinical activity (presence of TF and/or TI) to be 97% sensitive and 93% specific.26 Their results are difficult to directly compare with ours for two main reasons. First, their model used longitudinal data and was designed with the goal of estimating duration of infection, not test characteristics. Second, we used PCR as a diagnostic test, whereas they used an immunoassay.
Our estimates of PCR sensitivity (87.5%) and specificity (100%) closely agree with the best current estimate in a recent review in which sensitivity was estimated at 90% to 100% and specificity at 95% to 100%.3 Although the Amplicor test (Roche Diagnostics) is officially indicated only for urogenital use, it is commonly used in trachoma studies.11,18 In the urogenital literature, similar performance has been reported: sensitivities of 90% to 92% and specificities of 99 to 100%.27–29 Our estimates come from macrolide naive areas with high prevalence. The temporal relationship between infection and clinical examination could lead to different results in other settings, particularly in recently treated or low-prevalence areas. Our estimates should be re-evaluated, as posttreatment data accumulate from ongoing mass-treatment studies.
PCR has limitations, particularly that it may have a false-negative rate as high as 20% (Table 1). The Amplicor test evaluated here detects the cryptic plasmid present in most C. trachomatis. Others have isolated C. trachomatis that lacks the plasmid,30 suggested that other species of Chlamydia can cause trachomatous inflammation,31 and shown that a broadened spectrum of PCR targets increases sensitivity.32 The Amplicor test evaluated here would fail to detect other species or variants with altered or missing, which could be critical in the face of selection pressure. Differences between conjunctival and epithelial specimens, human conjunctival cell yield, DNA extraction efficiency, and removal of molecular inhibitors may also affect test performance33; those factors were not examined in this study and may partially account for PCR's imperfect sensitivity.
Determining test characteristics in the absence of a gold standard is difficult, and latent class analysis has several limitations.34,35 The most relevant limitation in our case is that we assume diagnostic tests are independent, given their underlying latent class disease state. Positive correlation between tests may cause LCA to overestimate sensitivity and specificity,36 and so it is possible that estimates are optimistic. There are methods that directly calculate correlation between diagnostic tests.37–39 These methods all require more than three diagnostic tests for the model to be identifiable. For our data, we were able to perform a two-test LCA comparing TF versus PCR and TI versus PCR (comparative analyses 1 and 2). By ignoring one of the clinical examinations in each of these comparative analyses, we eliminated any possible effect of correlation between TF and TI. The two-test LCA comparing TF and PCR produced estimates for the sensitivity of PCR and the specificity of TF that lay just outside the 95% CIs for the primary analysis. Neither of these differences was significant when accounting for error in each estimate. The results of the two-test LCA comparing TI and PCR lay within the primary analysis CIs. Taken together, these findings suggest that correlation between TF and TI may be playing a small role in our model. Quantifying the relationship further requires more diagnostic tests.
LCA may be particularly well suited to trachoma because of the unclear definition of a case of trachoma. The WHO defines cases based on clinical examination, whereas research studies, such as the source of these data, frequently use laboratory tests such as PCR. These two approaches are fundamentally different; examination detects inflammation whereas PCR detects the causative organism. Examination and laboratory tests are frequently discordant,14,23 possibly due to infection kinetics23 and age-dependent manifestations of infection.40 Latent class is appropriate for trachoma because the trachoma latent class in the model is never specifically defined. Instead, it acts as an unbiased composite of all available data, which is more appropriate than defining cases based on unverified assumptions. This begs clarification of what the latent trachoma class actually represents. In our case, the high sensitivity and almost 100% specificity of PCR suggest that the trachoma class represents chlamydial infection as determined by PCR more than examination findings.
Our LCA approach both reaffirms and challenges some traditionally held views about trachoma. PCR appears to have the specificity of a true gold standard (100%) but lacks sensitivity (87.5%). TF, the diagnosis used in the WHO protocol, is quite sensitive (87.3%) but poorly specific (36.6%). Although TI is no longer used in the WHO protocol, our findings suggest that it could play a role due to its specificity (88.3%) and its strong correlation with LCA prevalence (0.74). The next step is to compare these estimates with those from ongoing clinical trials, particularly those in areas of different prevalence and in areas after treatment.
Footnotes
Supported by National Institutes of Health Grants NIH/NEI K12EX017269 and R21 AI055752 for the Trachoma Elimination Follow-up Study, with additional support from International Trachoma Initiative, Pfizer International, the Bernard Osher Foundation, That Man May See, the Harper Inglis Trust, the Bodri Foundation, the South Asia Research Fund, and Research to Prevent Blindness. Mr. See's research was supported by a grant from the Doris Duke Charitable Foundation.
Disclosure: C.W. See, None; W. Alemayehu, None; M. Melese, None; Z. Zhou, None; T.C. Porco, None; S. Shiboski, None; B.D. Gaynor, None; J. Eng, None; J.D. Keenan, None; T.M. Lietman, None
References
- 1. Resnikoff S, Pascolini D, Etya'ale D, et al. Global data on visual impairment in the year 2002. Bull World Health Organ. 2004;82(11):844–851 [PMC free article] [PubMed] [Google Scholar]
- 2. Schachter J, West SK, Mabey D, et al. Azithromycin in control of trachoma. Lancet. 1999;354(9179):630–635 [DOI] [PubMed] [Google Scholar]
- 3. Solomon AW, Peeling RW, Foster A, Mabey DCW. Diagnosis and assessment of trachoma (review). Clin Microbiol Rev. 2004;17(4):982–1011 [DOI] [PMC free article] [PubMed] [Google Scholar]
- 4. World Health Organization Report of the Eighth Meeting of the WHO Alliance for the Global Elimination of Blinding Trachoma. Geneva, WHO; 2004 [Google Scholar]
- 5. Lietman T, Porco T, Dawson C, Blower S. Global elimination of trachoma: how frequently should we administer mass chemotherapy? Nat Med. 1999;5(5):572–576 [DOI] [PubMed] [Google Scholar]
- 6. Melese M, Alemayehu W, Lakew T, et al. Comparison of annual and biannual mass antibiotic administration for elimination of infectious trachoma. JAMA. 2008;299(7):778–784 [DOI] [PubMed] [Google Scholar]
- 7. Melese M, Chidambaram JD, Alemayehu W, et al. Feasibility of eliminating ocular Chlamydia trachomatis with repeat mass antibiotic treatments. JAMA. 2004;292(6):721–725 [DOI] [PubMed] [Google Scholar]
- 8. Thylefors B, Dawson CR, Jones BR, West SK, Taylor HR. A simple system for the assessment of trachoma and its complications. Bull World Health Organ. 1987;65(4):477–483 [PMC free article] [PubMed] [Google Scholar]
- 9. Bailey RL, Arullendran P, Whittle HC, Mabey DC. Randomised controlled trial of single-dose azithromycin in treatment of trachoma. Lancet. 1993;342(8869):453–456 [DOI] [PubMed] [Google Scholar]
- 10. Bailey RL, Hampton TJ, Hayes LJ, et al. Polymerase chain reaction for the detection of ocular chlamydial infection in trachoma-endemic communities. J Infect Dis. 1994;170(3):709–712 [DOI] [PubMed] [Google Scholar]
- 11. Chidambaram JD, Alemayehu W, Melese M, et al. Effect of a single mass antibiotic distribution on the prevalence of infectious trachoma. JAMA. 2006;295(10):1142–1146 [DOI] [PubMed] [Google Scholar]
- 12. Yang JL, Hong KC, Schachter J, et al. Detection of Chlamydia trachomatis ocular infection in trachoma-endemic communities by rRNA amplification. Invest Ophthalmol Vis Sci. 2009;50(1):90–94 [DOI] [PubMed] [Google Scholar]
- 13. Yang JL, Schachter J, Moncada J, et al. Comparison of an rRNA-based and DNA-based nucleic acid amplification test for the detection of Chlamydia trachomatis in trachoma. Br J Ophthalmol. 2007;91(3):293–295 [DOI] [PMC free article] [PubMed] [Google Scholar]
- 14. Baral K, Osaki S, Shreshta B, et al. Reliability of clinical diagnosis in identifying infectious trachoma in a low-prevalence area of Nepal. Bull World Health Organ. 1999;77(6):461–466 [PMC free article] [PubMed] [Google Scholar]
- 15. Bird M, Dawson CR, Schachter JS, et al. Does the diagnosis of trachoma adequately identify ocular chlamydial infection in trachoma-endemic areas? J Infect Dis. 2003;187(10):1669–1673 [DOI] [PubMed] [Google Scholar]
- 16. Bobo LD, Novak N., Munoz B., et al. Severe disease in children with trachoma is associated with persistent Chlamydia trachomatis infection. J Infect Dis. 1997;176(6):1524–1530 [DOI] [PubMed] [Google Scholar]
- 17. Holm SO, Jha HC, Bhatta RC, et al. Comparison of two azithromycin distribution strategies for controlling trachoma in Nepal. Bull World Health Organ. 2001;79(3):194–200 [PMC free article] [PubMed] [Google Scholar]
- 18. Solomon AW, Holland MJ, Alexander ND, et al. Mass treatment with single-dose azithromycin for trachoma. N Engl J Med. 2004;351(19):1962–1971 [DOI] [PMC free article] [PubMed] [Google Scholar]
- 19. Thein J, Zhao P, Liu H, et al. Does clinical diagnosis indicate ocular chlamydial infection in areas with a low prevalence of trachoma? Ophthalmic Epidemiol. 2002;9(4):263–269 [DOI] [PubMed] [Google Scholar]
- 20. Goodman LA. Exploratory latent structure-analysis using both identifiable and unidentifiable models. Biometrika. 1974;61(2):215–231 [Google Scholar]
- 21. Kullback S, Leibler RA. On information and sufficiency. Ann Math Stat. 1951;22(1):79–86 [Google Scholar]
- 22. Formann AK, Kohlmann T. Latent class analysis in medical research. Stat Methods Med Res. 1996;5(2):179–211 [DOI] [PubMed] [Google Scholar]
- 23. Miller K, Schmidt G, Melese M, et al. How reliable is the clinical exam in detecting ocular chlamydial infection? Ophthalmic Epidemiol. 2004;11(3):255–262 [DOI] [PubMed] [Google Scholar]
- 24. Solomon AW, Holland MJ, Burton MJ, et al. Strategies for control of trachoma: observational study with quantitative PCR. Lancet. 2003;362(9379):198–204 [DOI] [PubMed] [Google Scholar]
- 25. Taylor HR, Johnson SL, Prendergast RA, et al. An animal model of trachoma II. The importance of repeated reinfection. Invest Ophthalmol Vis Sci. 1982;23(4):507–515 [PubMed] [Google Scholar]
- 26. Grassly NC, Ward ME, Ferris S, Mabey DC, Bailey RL. The natural history of trachoma infection and disease in a Gambian cohort with frequent follow-up. PLoS Negl Trop Dis. 2008;2(12):e341. [DOI] [PMC free article] [PubMed] [Google Scholar]
- 27. Bianchi A, Scieux C, Brunat N, et al. An evaluation of the polymerase chain reaction amplicor Chlamydia trachomatis in male urine and female urogenital specimens. Sex Transm Dis. 1994;21(4):196–200 [DOI] [PubMed] [Google Scholar]
- 28. Lowe P, O'Loughlin P, Evans K, et al. Comparison of the Gen-Probe APTIMA Combo 2 assay to the AMPLICOR CT/NG assay for detection of Chlamydia trachomatis and Neisseria gonorrhoeae in urine samples from Australian men and women. J Clin Microbiol. 2006;44(7):2619–2621 [DOI] [PMC free article] [PubMed] [Google Scholar]
- 29. Puolakkainen M, Hiltunen-Back E, Reunala T, et al. Comparison of performances of two commercially available tests, a PCR assay and a ligase chain reaction test, in detection of urogenital Chlamydia trachomatis infection. J Clin Microbiol. 1998;36(6):1489–1493 [DOI] [PMC free article] [PubMed] [Google Scholar]
- 30. Stothard DR, Williams JA, Van Der Pol B, Jones RB. Identification of a Chlamydia trachomatis serovar E urogenital isolate which lacks the cryptic plasmid. Infect Immun. 1998;66(12):6010–6013 [DOI] [PMC free article] [PubMed] [Google Scholar]
- 31. Dean D, Kandel RP, Adhikari HK, Hessel T. Multiple Chlamydiaceae species in trachoma: implications for disease pathogenesis and control. PLoS Med. 2008;5(1):e14. [DOI] [PMC free article] [PubMed] [Google Scholar]
- 32. Goldschmidt P, Rostane H, Sow M, et al. Detection by broad-range real-time PCR assay of Chlamydia species infecting human and animals. Br J Ophthalmol. 2006;90(11):1425–1429 [DOI] [PMC free article] [PubMed] [Google Scholar]
- 33. de Barbeyrac B, Goldschmidt P, Malembic S, et al. Quality assessment of conjunctival specimens for detection of Chlamydia trachomatis by PCR in children with active trachoma. Clin Microbiol Infect. 2007;13(7):689–694 [DOI] [PubMed] [Google Scholar]
- 34. Alonzo TA, Pepe MS. Using a combination of reference tests to assess the accuracy of a new diagnostic test. Stat Med. 1999;18(22):2987–3003 [DOI] [PubMed] [Google Scholar]
- 35. Hadgu A, Miller W. Using a combination of reference tests to assess the accuracy of a diagnostic test by A. Alonzo and M. Pepe. Stat Med. 1999;18: 2987–3003. Stat Med. 2001;20(4):656–660 [DOI] [PubMed] [Google Scholar]
- 36. Pepe MS, Janes H. Insights into latent class analysis of diagnostic test performance. Biostatistics. 2007;8(2):474–484 [DOI] [PubMed] [Google Scholar]
- 37. Hagenaars JA. Latent structure models with direct effects between indicators: local dependence models. Sociol Methods Res. 1988;16(3):379–405 [Google Scholar]
- 38. Qu Y, Tan M, Kutner MH. Random effects models in latent class analysis for evaluating accuracy of diagnostic tests. Biometrics. 1996;52(3):797–810 [PubMed] [Google Scholar]
- 39. Uebersax JS. Probit latent class analysis with dichotomous or ordered category measures: conditional independence/dependence models. Appl Psychol Measure. 1999;23(4):283–297 [Google Scholar]
- 40. Bailey R, Duong T, Carpenter R, Whittle H, Mabey D. The duration of human ocular Chlamydia trachomatis infection is age dependent. Epidemiol Infect. 1999;123(3):479–486 [DOI] [PMC free article] [PubMed] [Google Scholar]