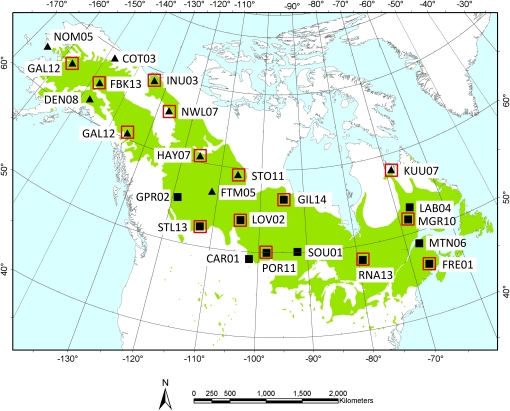
Figure 1 .
Sampling locations and IDs for accessions sequenced in this study. Accessions in the northern group are symbolized by triangles, and those in the southern groups as squares. Red boxes denote those accessions included in the reference gene sequences (from Olson et al. 2010) used for generating the empirical distributions of diversity. The geographic range of P. balsamifera is shown in green.

